Asia-Europe-US session with rectangle filled from top of the chart and the bottom How?
"But, that is not what I want. I want just the bottom of the chart as a low, the top of the chart as a high.
What does that mean? What chart, what time frame, what zoom and what does it have to do with sessions?
I did this. Instead of setting the price, I set 0 ~ 1000. But, now, the rectangle doesn't fill only the specific time.
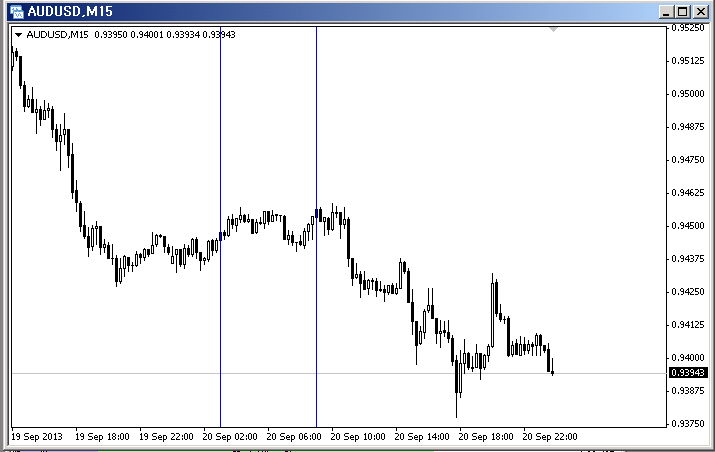
     string objname = "TokyoTime" ;

     datetime datetimeStart  = D'2013.09.20 03:00:00';   // Tokyo Time - 9:00 am
     datetime datetimeEnd    = D'2013.09.20 09:00:00';   // Tokyo Time - 3:00 pm

     ObjectCreate(objname,OBJ_RECTANGLE, 0, datetimeStart,0, datetimeEnd,1000);
     ObjectSet(objname, OBJPROP_STYLE, STYLE_SOLID);
     ObjectSet(objname,OBJPROP_COLOR, Blue);
     ObjectSet(objname,OBJPROP_BACK, false);
I know this is not the generic solution. But, I want to start from the beginning about how to. How can I make it fill the rectange.
Please see the attachment file.
"But, that is not what I want. I want just the bottom of the chart as a low, the top of the chart as a high.
What does that mean? What chart, what time frame, what zoom and what does it have to do with sessions?
Whoa - I haven't thought about all those variable ~ I only focused on showing on the chart first. Hummm... Thank you so much for your analytic questions.
first of all, of course, it should be shown M1 to H4. (We know D, W, Mn have no meaning.) I didn't really think about Zoom. As a newbie, do you have any sites
that might explain about zoom? Thanks in advance ~
ObjectSet(objname,OBJPROP_BACK, false);I know this is not the generic solution. But, I want to start from the beginning about how to. How can I make it fill the rectange.
I found it.
This is very interesting. If I set OBJPROP_BACK == true, then it will fill automatically
without setting width value. But, if I set this OBJPROP_BACK == false, then I have to specify the width.
Interesting ~ Then, perhaps the ObjectCreate Rectangle isn't the higher value. Rectangle must have filled value by common sense.
if not background it will be shown only like 2 vertical lines... Strange -
Thanks in advance ~ GumRai - You didn't answer but you induced me to answer faster ~ Perhaps, I should use better word, inspire me ~
Humbly ~ Thank you~
Draw it in the background. If it's in the foreground you couldn't see anything else so mt4 gives you a hollow rectangle.
Oh, you answered while I was writing ~ Hum - member involvements are faster than I expected.
anyway - I still have questions about the structure of MQL, though -
Another question? I set the time to be shown untiil the market closing. But it shows very strangely. this is a code.
     string objname  = "TokyoTime";
     string objname2 = "NYTime";

     datetime datetimeTkStart  = D'2013.09.20 03:00:00';   // TokyoTime - 9:00 am
     datetime datetimeTkEnd    = D'2013.09.20 09:00:00';   // TokyoTime - 3:00 pm

     datetime datetimeUSStart  = D'2013.09.20 15:00:00';   // TokyoTime - 9:00 pm
     datetime datetimeUSEnd    = D'2013.09.20 24:00:00';   // TokyoTime - 6:00 am (+1 day) <<<<<

     ObjectCreate(objname,OBJ_RECTANGLE, 0, datetimeTkStart, 0, datetimeTkEnd,1000);
     ObjectSet(objname, OBJPROP_STYLE, STYLE_SOLID);
     ObjectSet(objname,OBJPROP_COLOR, Yellow);
     ObjectSet(objname,OBJPROP_BACK, true);

     ObjectCreate(objname2,OBJ_RECTANGLE, 0, datetimeUSStart, 0, datetimeUSEnd,1000);
     ObjectSet(objname2, OBJPROP_STYLE, STYLE_SOLID);
     ObjectSet(objname2,OBJPROP_COLOR, Yellow);
     ObjectSet(objname2,OBJPROP_BACK, true);
After this, I thought it would show until the end, yellow until the last candle that shows. But it isn't as shown below. I insert the vertical trend line to notice easier.
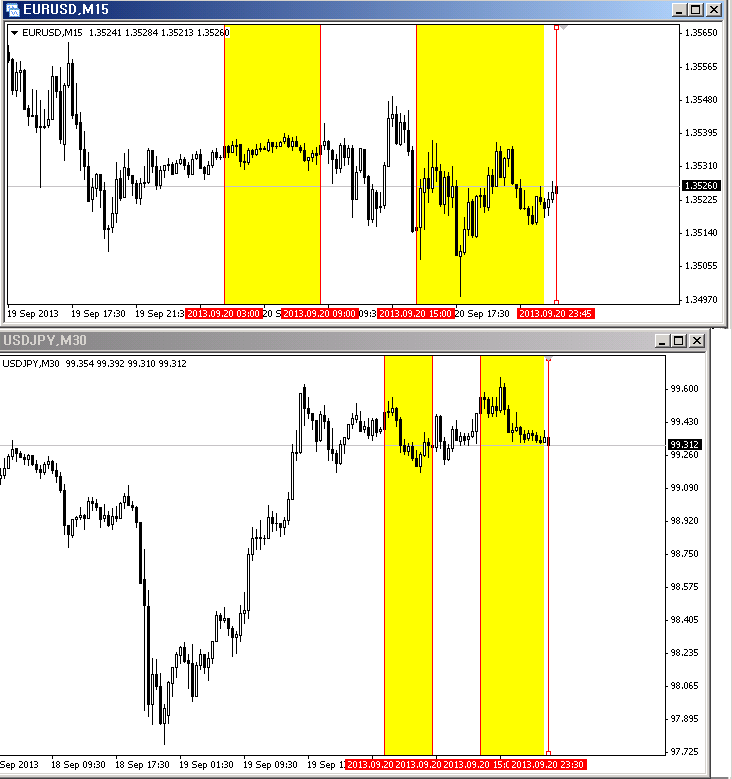
Why? These two are not filled to the end time that I specified.
-------- Later,
I have just changed the time - datetime datetimeUSEnd = D'2013.09.20 24:00:00'; ==> D'2013.09.20 23:59:00';
It works ~
I guess because at the moment you create the rectangle, the latest point it can reach to is that moment.
So then, after time goes on and new bars are created, the rectangle is left at the old time.
If you want to change this, you will need to update the rectangle with each tick... doing this efficiently is the challenge.
If you want an indicator that does a similar function, you can try this code. But it was the first indicator I ever made so it may not be perfect:
London - Green, New York - Orange, Tokyo - Yellow, Sydney - Blue
Daylight saving times should be correct till November 2014
gmt_offset is how many hours your broker is ahead of GMT time (if it's behind GMT, i.e. New York time, then use a minus value)
#property indicator_separate_window
#property indicator_minimum 7.5
#property indicator_maximum 16
#property indicator_buffers 4
#property indicator_color1 Blue
#property indicator_color2 Yellow
#property indicator_color3 Green
#property indicator_color4 Orange

extern int gmt_offset = 3;

//--- buffers
double SydneyHistogram[];
double TokyoHistogram[];
double LondonHistogram[];
double NewYorkHistogram[];

// GMT times without daylight saving
#define SydneyOn   22
#define SydneyOff  7
#define TokyoOn    23
#define TokyoOff   8
#define LondonOn   8
#define LondonOff  17
#define NewYorkOn  13
#define NewYorkOff 22

//1 = daylight saving     0 = no daylight saving
int EUSum = 1;
int NASum = 1;
int AusSum = 0;

//+------------------------------------------------------------------+
//| Custom indicator initialization function                         |
//+------------------------------------------------------------------+
int init()
  {
//---- indicators
   SetIndexStyle(0,DRAW_HISTOGRAM,0,5);
   SetIndexBuffer(0,SydneyHistogram);
   SetIndexLabel(0,NULL);
   SetIndexStyle(1,DRAW_HISTOGRAM,0,5);
   SetIndexBuffer(1,TokyoHistogram);
   SetIndexLabel(1,NULL);
   SetIndexStyle(2,DRAW_HISTOGRAM,0,5);
   SetIndexBuffer(2,LondonHistogram);
   SetIndexLabel(2,NULL);
   SetIndexStyle(3,DRAW_HISTOGRAM,0,5);
   SetIndexBuffer(3,NewYorkHistogram);
   SetIndexLabel(3,NULL);
//----
   int gmt_now = TimeCurrent()-gmt_offset*3600;

   if(gmt_now>=D'2013.10.05 16:00:00') AusSum++;
   if(gmt_now>=D'2014.04.05 15:00:00') AusSum--;
   if(gmt_now>=D'2014.10.04 15:00:00') AusSum++;
   if(gmt_now>=D'2013.10.27 01:00:00') EUSum--;
   if(gmt_now>=D'2014.03.30 01:00:00') EUSum++;
   if(gmt_now>=D'2014.10.26 01:00:00') EUSum--;
   if(gmt_now>=D'2013.11.03 06:00:00') NASum--;
   if(gmt_now>=D'2014.03.09 07:00:00') NASum++;
   if(gmt_now>=D'2014.11.02 06:00:00') NASum--;
   return(0);
  }
//+------------------------------------------------------------------+
//| Custom indicator deinitialization function                       |
//+------------------------------------------------------------------+
int deinit()
  {
//----

//----
   return(0);
  }
//+------------------------------------------------------------------+
//| Custom indicator iteration function                              |
//+------------------------------------------------------------------+
int start()
   {
   int counted_bars=IndicatorCounted();
   if (counted_bars<0) return(-1);      //---- check for possible errors
   if (counted_bars>0) counted_bars--;  //---- last counted bar will be recounted

   int pos=Bars-counted_bars;
   for (int i=pos; i>=0; i--)
      {
      int gmt_hour = TimeHour(Time[i]-gmt_offset*3600);
      if(gmt_hour>=SydneyOn-AusSum) SydneyHistogram[i] = gmt_hour+AusSum-14;
      if(gmt_hour<SydneyOff-AusSum) SydneyHistogram[i] = gmt_hour+AusSum+10;
      if(gmt_hour>=TokyoOn) TokyoHistogram[i] = gmt_hour-15;
      if(gmt_hour<TokyoOff) TokyoHistogram[i] = gmt_hour+9;
      if( (gmt_hour>=LondonOn-EUSum) && (gmt_hour<LondonOff-EUSum) ) LondonHistogram[i] = gmt_hour+EUSum;
      if( (gmt_hour>=NewYorkOn-NASum) && (gmt_hour<NewYorkOff-NASum) ) NewYorkHistogram[i] = gmt_hour+NASum-5;
      }
//----
   return(0);
  }
//+------------------------------------------------------------------+
- Free trading apps
- Over 8,000 signals for copying
- Economic news for exploring financial markets
You agree to website policy and terms of use
Asia-Europe-US session with rectangle filled from top of the chart and the bottom How?
I found https://www.mql5.com/en/code/7753 that shows the session of each with high price and low price of that specific session.
But, that is not what I want. I want just the bottom of the chart as a low, the top of the chart as a high.
How can I implement this? What is the maximum high and minimum low value for this ObjectCreate with obj_rectangle ?
Thanks in advance ~