Conheça o Mercado MQL5 no YouTube, assista aos vídeos tutoriais
Como comprar um robô de negociação ou indicador?
Execute seu EA na
hospedagem virtual
hospedagem virtual
Teste indicadores/robôs de negociação antes de comprá-los
Quer ganhar dinheiro no Mercado?
Como apresentar um produto para o consumidor final?
Expert Advisors e Indicadores para MetaTrader 5 - 157

Orca EA ΜΤ5 é um Expert Advisor totalmente automatizado. Seu algoritmo avançado baseado em ação de preço está tentando prever a direção da próxima vela e abre (ou não) a negociação apropriada. Possui um número único de configurações que o tornam extremamente versátil em todas as condições de mercado. O Orca EA ΜΤ5 vem com arquivos de conjunto fornecidos para 2022, especialmente otimizados para contas ECN Raw Spread ICMarkets (servidores de fuso horário GMT + 3 baseados em Nova York). Outr
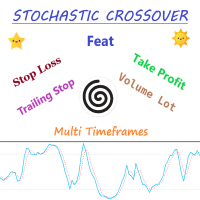
Expert Advisor Description - Basically, EA will open position in case of cross between main line and signal line on stochastic. - Unique to this EA, using the two pre-set stochastic so that the EA can open the trade position. - The first stochastic determines the cross, while the second stochastic determines the overbought or oversold levels.
Parameters Description - Volume_Lot => Number of lots determined from the balance percentage. Example Balance = 1.000 USD, Volume Lot = 100, Then lot

Expert Advisor Description Strategy using two classic indicators in MetaTrader, stochastic oscillator and moving average Accompanied by multi timeframe and parameter that can be changed according to the strategy that suits you
Feature Money Management : Stop Loss, Take Profit, Trailing Stop Trading Option : Stochastic Oscillator, two Moving Average, Multi Timeframes https://youtu.be/3dXAUUnxg1s
youtubeembedcode.com/pl/ http://add-link-exchange.com
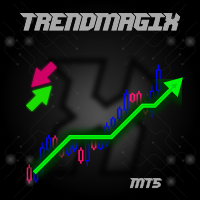
Unique trend trading algorithm with advanced filtering and many features which should become a part of your trading arsenal. This indicator can give you also trading advisors (with take profit target), success rate scanner and much more.
Important information
For additional detailed information you can visit the 747Developments website.
Features Easy to use (just drag and drop to the chart) Possible to use with any trading instrument Possible to use on any time-frame Take profit advisors S

Descrição da estratégia: esta EA é a tendência EA EA idéia é a maneira mais simples de recuperar e diminuir as transações, juntamente com o movimento para parar a perda no tempo e cortar as perdas, para que OS lucros possam ser executados. as principais transações da ea são EURUSD e XAUUSD. Configurações de parâmetros: Transaction: a EA só funcionará se Transaction=true. Lots: número da próxima mão, 10. 000 USD é recomendado para pedidos 1 mão padrão: 0, 1 sob 10000USD. Maxi_point: limite máximo

Just $10 for six months!!! Displays previous days Highs & Lows. You can set the number of days to display levels for, also the line style, color and width. This is very useful for traders using the BTMM and other methods like ICT. I'll be creating more indicators for MT5 for the BTMM. Send me your suggestions to my Telegram: https://t.me/JDelgadoCR Take a look at my other products at: https://www.mql5.com/en/users/jdelgadocr/seller

Just $10 for six months!!! Displays previous weeks Highs & Lows. You can set the number of weeks to display levels for, also the line style, color and width. This is very useful for traders using the BTMM and other methods like ICT. I'll be creating more indicators for MT5 for the BTMM. Send me your suggestions to my Telegram: https://t.me/JDelgadoCR Take a look at my other products at: https://www.mql5.com/en/users/jdelgadocr/seller

Just $10 for six months!!!. This will draw Order Blocks just by clicking on a candle. It will use the body or the wicks. It can also draw the mean threshold of the candle open/close or high/low. As a drawing tool, it is not active all the time after adding it to the chart. Activate by pressing 'b' twice on the keyboard within a second. If activated but then decided not to draw, deactivate by pressing 'b' once. Box color depends if candle is above or below current price. Settings/Inputs: Number

Just $10 for six months!!!. This will draw Order Blocks just by clicking on a candle with different colors for different time frames. It will use the body or the wicks. It can also draw the mean threshold of the candle open/close or high/low.
As a drawing tool, it is not active all the time after adding it to the chart.
Activate by pressing 'b' twice on the keyboard within a second. If activated but then decided not to draw, deactivate by pressing 'b' once. Box color depends if candle is a

Easy start: Everything is already set up. The minimum Deposit is $ 100. Quick result. Convenient interface.
On the stock exchange, you can often hear that averaging, martingale, and other types of progressive money management do not work. The reality is that more than 90% of successful, highly profitable and long-standing signals use this method of money management. The situation is similar with top PAMM accounts. Sparta is a fully automatic multi-currency expert Advisor that uses a uniqu

1. Why did I develop this series of indicators
I found that most traders need to use multiple time frame indicators. They usually switch time frame to see indicators. However, once the timeframe is switched, you cannot see the corresponding relationship between the price in the smaller timeframe and the indicator in the larger timeframe . For example: if your price chart is in H1 timeframe, you can see H4, D1 and W1 indicators in H1 timeframe Chart. This is more helpful for you to find t
The RiseTrading is a unique High quality and easy to use and affordable trading tool because we have incorporated a number of proprietary features and MACD and Stochastic indicators. The main advantages of the trend trading strategy used by the Expert Advisor are opening positions only in the direction of a trend, ability for the long-term retention of profitable positions allowing users to achieve good combinations of profit/loss distributions. That can work on a real account at any broker with

1. Why did I develop this series of indicators
I found that most traders need to use multiple time frame indicators. They usually switch time frame to see indicators. However, once the timeframe is switched, you cannot see the corresponding relationship between the price in the smaller timeframe and the indicator in the larger timeframe . For example: if your price chart is in H1 timeframe, you can see H4, D1 and W1 indicators in H1 timeframe Chart. This is more helpful for you to find t

Just $10 for six months!!!. This will draw Supply & Demand zones just by clicking on a candle. It can also draw a 50% line on the zone. https://youtu.be/XeO_x7cpx8g As a drawing tool, it is not active all the time after adding it to the chart.
Activate by pressing 's' twice on the keyboard within a second. If activated but then decided not to draw, deactivate by pressing 's' once. Box color depends if candle is above or below current price.
Features: Draw the box up to the last current can

Executado em AUDUSD, troca automática de USDCAD e UCDNOK, EA é uma estratégia de tendência de hedge, não duplica, não tem grade e não há muitos parâmetros que precisam ser ajustados de forma simples e prática. Configurações de parâmetros: Transaction: a UN só funciona quando Transaction=true. Lots: pedidos. SL_money: quantia de perdas uma lista uniforme de todas as moedas em um depósito. Less_stop: o líquido é menor que ou menor que não está no depósito. Plataforma recomendada: ECN, outra plataf

Panthers Traders presents the new Expert Advisor "MRK TRADER", a robot for Forex, Indices, Commodities and Cryptocurrencies. This expert advisor works hedge strategies, has different variables to configure each other, works as a work tool or as a 100% automatic expert advisor, if you do not have experience, for your greater profitability, get in touch by private and I will explain your different variables and how to apply them in different assets, I recommend watching the videos of the YouTub

Backtest from 2003-2019 MetaQuotes Data Every Tick Mode
EA created for EURUSD H1
Open transaction based on MA and Volume
Close transaction based on RSI or take profit
One transaction at the time.
No adding position, no martingale, no grid.
My recommendations: For "safe mode" i recommend 0.1 lot per 10000USD
For "risky mode" i recommend 0.5 lot per 10000USD
Personally i use 0.3 lot per 10000 USD
Fell free to increase lot size while you earn.
This EA does not open transaction e

The Rise of Skywalker: It is an advanced trading system. This is a fully automatic Expert Advisor, which allows you to presize the trade according to the preferences of the trader. Is a revolution in the customization of the trading. The Rise of Skywalker is a expert advisor based in the indicator The Rise of Sky walker: ( https://www.mql5.com/es/market/product/44534 ) This system uses only one trade in each operation. Do not use Grip or martingale Low risk system since it h

The indicator for trading on the signals of the harmonic pattern AB=CD. It gives signals and shows the levels of entry into the market, as well as levels for placing stop orders, which allows the trader to make timely decisions on entering the market, as well as effectively manage positions and orders. It supports sending push notifications to a mobile device, e-mail, as well as alerts. This indicator has been ported from the version for MetaTrader 4. For more information, as well as a detailed

Este EA trabalha com uma das melhores estratégias de saída de posição, o grid. Mas não é um grid comum. Nesse EA essa estratégia está otimizada ao extremo para dar a você a melhor performance, com várias opções de configurações para trabalhar de forma mais segura e lucrativa. Além disso, ele gerencia em um único gráfico vários ativos ao mesmo tempo, fazendo-os se complementarem para fazer um gerenciamento único.
Exelente Robô para Mini Indice e Mini Dolar!
No minindice você pode ativar o t
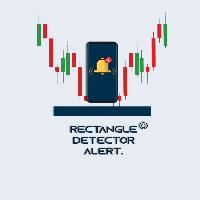
Rectangle Detector Alert
About Rectangle Detector Alert Indicator
Rectangle detector alert detects manually drawn rectangle shapes on charts and sends out push notifications
also auto extending the rectangles at the same time as new candles form.
The concept behind this indicator is based on the manual trading of supply and demand zones. Most traders prefer
to draw their supply (resistance) and demand (support) zones manually instead of depending on indicators to auto draw
the

Panthers Traders presents the new Expert Advisor "MRK TRADER", a robot for Forex, Indices, Commodities and Cryptocurrencies. This expert advisor works hedge strategies, has different variables to configure each other, works as a work tool or as a 100% automatic expert advisor, if you do not have experience, for your greater profitability, get in touch by private and I will explain your different variables and how to apply them in different assets, I recommend watching the videos of the YouTube

Fibonacci Múltiple 12, utiliza la serie fibonacci plasmado en el indicador fibonacci, aumentadolo 12 veces según su secuencia. El indicador fibonacci normalmente muestra una vez, el presente indicador se mostrara 12 veces empezando el numero que le indique siguiendo la secuencia. Se puede utilizar para ver la tendencia en periodos cortos y largos, de minutos a meses, solo aumentado el numero MULTIPLICA.

Esse robô só opera 20 minutos por dia durante a abertura do mercado!
Recomendado para mini Índice e mini dólar!
Parametros:
Volume inicial (recomendado: 1 pra R$300) Ativar volume automático Saldo proporção x volume Volumes seguintes (separar por ,) TakeProfit (gain, 0 ñ usa) MaxOrders Ativar função trailing stop Pontos de lucro p/ acionar trailing Distância do stoploss no trailing
DistCanal
Derrapagem máxima CriarLinhasRompimento = false; CorLinhasRompimen

Este produto é um conjunto de ferramentas que auxiliam o trader a tomar decisões, trazendo informações de diferentes categorias que se complementam: tendência, suporte/ resistência e padrões de candle. Ele possui também um painel com informações sobre o saldo. A tendência possui dois cálculos diferentes e é mostrada em forma de coloração de candles. A estratégia 1 é mais longa, possuindo 3 estados diferentes: tendência de alta, de baixa e neutra. Já a estratégia 2 possui uma resposta mais rápi

A ideia principal desse produto é gerar estatísticas baseadas em sinais de 5 estratégias diferentes para os traders de Opções Binárias, mostrando como seria os resultados e o saldo final baseado em quanto a corretora paga de payout. Estratégia 1: O cálculo é secreto. Estratégia 2: O sinal é baseado em uma sequência de candles do mesmo lado. Estratégia 3: O sinal é baseado em uma sequência de candles intercalada. Estratégia 4: O sinal é composto pelos indicadores bollinger (sendo que temos 3 tip

Parâmetros: Ativar modo EA (robô) se você deixar true ele vai virar um robô, se você deixar false ele vai virar um indicador. Volume inicial VolumeDinamico se você deixar ativado vai ser lote automático Proporção: Exemplo: se você colocar 500 a cada 500$ ele vai abrir um lote de 1.0 Lucro diário se deixar em R$,0 ele não vai ser ativado, se atingir o lucro diário ele para de operar. Stop diário aqui você tem que colocar valor negativo -R$ se você deixar 0 ele não vai ser ativado. % do DOM
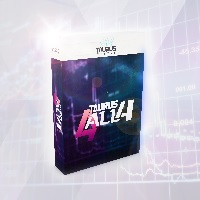
Indicador Taurus All4 Taurus All4
O Taurus All4 é um indicador de alta performance, ele indica a força da tendência, e você pode observar a força da vela.
Nosso indicador possui mais de 4 confirmações de tendência.
Ele é bem simples e fácil de usar.
Modos de confirmação Confirmações de Tendência da Vela: Quando uma vela muda para verde claro a tendência é alta. Quando uma vela muda para vermelho claro a tendência está revertendo para baixo. Quando uma vela muda para verm

Versão Darkray para Bolsa de Valores (Ações, Fundos Imobilirários, contratos futuros, etc.) O Robô DarkrayB3EA usa uma estratégia baseada no retorno a média, conjugada a detecção de zonas de exaustão de compra e de venda. Indicadores disponíveis para configurações de setups: EMA200 à Média móvel de 200 períodos (podem ser usados outros períodos com ótimos resultados também); RSI à Verifica os níveis de sobre venda para abertura das vendas e sobre compra para abertura das compras; ADX à Veri

The Candlestick Patterns indicator for MT5 includes 12 types of candlestick signales in only one indicator. - DoubleTopsAndBottoms - SmallerGettingBars - BiggerGettingBars - ThreeBarsPlay - TwoBarsStrike - Hammers - InsideBars - OutsideBars - LongCandles
- TwoGreenTwoRed Candles - ThreeGreenThreeRed Candles The indicator creats a arrow above or under the signal candle and a little character inside the candle to display the type of the signal. For long candles the indicator can display the exac

Walking Pips es un asesor experto en scalping diseñado para trabajar en un mercado volátil. Adecuado para trabajar con cualquier corredor, incluidos los corredores estadounidenses con un requisito FIFO, en primer lugar, cerrar acuerdos abiertos previamente. Todas las órdenes van acompañadas de un stop loss virtual y take profit en pips, así como una función de punto de equilibrio y trailing stop. El gráfico muestra información sobre la velocidad de ejecución de la orden y el deslizamiento. El E
FuturesBot NQ100 Advisor works only on NETTING accoun ts!
Trading Advisor " FuturesBot NQ100 "is intended solely and exclusively for trading futures on the CME Group exchange
Advisor is adapted for trading futures contracts: - E-mini Nasdaq-100 Futures
- micro E-mini Nasdaq-100 Future
The specification of the E-mini Nasdaq-100 Future contract is available at the following link on the exchange website:
https://www.cmegroup.com/trading/equity-index/us-index/e-mini-nasdaq-100_contract_sp
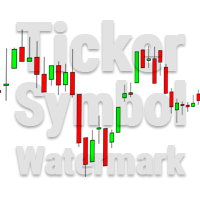
This utility tool draws the ticker symbol and timeframe information as a watermark in the background of the chart. It may come in handy if you have multiple charts on the screen at the same time. Inputs: Font Name: You can change text font by typing in the name of your favorite font installed on your operating system. (e.g.: Verdana, Palatino Linotype, Roboto, etc...) Font Color: You can choose your favorite from the available colors or type in a custom RGB color (values from 0 to 255, e.g.:

mql4 version: https://www.mql5.com/en/market/product/44606 Simple indicator to calculate profit on fibonacci retracement levels with fixed lot size, or calculate lot size on fibonacci levels with fixed profit. Add to chart and move trend line to set the fibonacci retracement levels. Works similar as default fibonacci retracement line study in Metatrader. Inputs Fixed - select what value will be fix, lot or profit Fixed value - value that will be fix on all levels Levels - levels for which
*Non-Repainting Indicator Arrow Indicator with Push Notification based on the Synthethic Savages strategy for synthethic indices on binary broker.
Signals will only fire when the Synthethic Savages Strategy Criteria is met BUT MUST be filtered.
Best Signals on Fresh Alerts after our Savage EMA's Cross. Synthethic Savage Alerts is an indicator that shows entry signals with the trend. A great tool to add to any chart. Best Signals occur on Fresh Alerts after our Savage EMA's Cross + Signal
O Mercado MetaTrader oferece um local conveniente e seguro para comprar aplicativos para a plataforma MetaTrader. Faça download de versões de demonstração gratuitas de Expert Advisors e indicadores a partir do seu terminal para testes no Testador de Estratégia.
Teste os aplicativos em diferentes modos para monitoramento do desempenho e assim fazer um pagamento para o produto que você deseja, usando o sistema de pagamento MQL5.community.
Você está perdendo oportunidades de negociação:
- Aplicativos de negociação gratuitos
- 8 000+ sinais para cópia
- Notícias econômicas para análise dos mercados financeiros
Registro
Login
Se você não tem uma conta, por favor registre-se
Para login e uso do site MQL5.com, você deve ativar o uso de cookies.
Ative esta opção no seu navegador, caso contrário você não poderá fazer login.