YouTubeにあるマーケットチュートリアルビデオをご覧ください
ロボットや指標を購入する
仮想ホスティングで
EAを実行
EAを実行
ロボットや指標を購入前にテストする
マーケットで収入を得る
販売のためにプロダクトをプレゼンテーションする方法
MetaTrader 4のためのテクニカル指標 - 25

Информационная панель, которая выставляет уровни покупки продажи и цели для профита на текущий день. Уровни рисуются согласно движению валюты за вчерашний день. Панель вмещает в себя информацию о валютной паре, тенденции на рынке, время до закрытия бара, управление капиталом, рекомендуемый лот, профит в пунктах, а также уровни для покупки и продажи инструмента. Для заключения сделок использовать только отложенные ордера на пробой. Входные параметры Lots - установить текущий лот Risk - риск в про
FREE

This indicator applies the biquad high pass filter to the price-chart data, and displays the filter output for the OHLC as candlesticks. The candlesticks corresponds to the actual calculations of the filter value during the formation of each price bar (not from all historical highs lows or closes). The shape of the bars therefore corresponds directly to the shape of each price bar. High pass filters are an underappreciated type of oscillator that are seldom used in technical analysis in the st
FREE

This indicator is designed to detect the best divergences between price/MACD and price/RSI. MACD and RSI produce by far the best divergence signals therefore this indicator focus on those two divergences. This is the FREE version of the indicator: https://www.mql5.com/en/market/product/28375
Important Information How you can maximize the potential of the scanner, please read here: www.mql5.com/en/blogs/post/718074
The free version works only on EURUSD and GBPUSD! This indicator scans for you
FREE

BinaryWizardMT4 is a powerful indicator for trading short-term binary options. In fact, this is a ready-made trading system. The indicator calculates the reference point and a short-term support and resistance levels. After the current price crosses the resistance level, a sell signal is formed (SIGNAL: SELL). Similarly, after the price crosses the support line, a buy signal is activated (SIGNAL: BUY).
Parameters x1, y1 - binding coordinates of the indicator window to the upper left chart corn
FREE

Introducing the “Symbol Cost Info MT4” indicator – your ultimate tool for staying ahead in the forex market! This innovative indicator is designed to empower traders with real-time cost information, directly on their charts. Here’s why every trader needs the “Symbol Cost Info MT4” in their arsenal: Real-Time Spread Monitoring : Keep a close eye on the spread for any currency pair, ensuring you enter the market at the most cost-effective times. Pip Value at Your Fingertips : Instantly know t
FREE

The BB Arrows MTF indicator is based on the Bollinger Bands indicator. Represents input signals in the form of arrows. All signals are generated on the current bar. In 2 modes, Signals are not redrawn (Exception of very sharp jumps)! All signals in MTF mode correspond to signals of the period specified in MTF. It is maximally simplified to use both for trading with only one indicator and for using the indicator as part of your trading systems. A feature of the indicator is that the indicator ti
FREE

The gravity line indicator to which the price always returns. This is a kind of center of attraction and a magnet for price. Allows you to trade on the trend and on pullbacks. It works on all timeframes, on any currency pairs, metals and cryptocurrency Can be used when working with binary options
Distinctive features Does not redraw its values; Price always returns to the line of gravity; Based on the laws of balance; It has simple and clear settings; It works on all timeframes and on all symb
FREE

This is first public release of detector code entitled "Enhanced Instantaneous Cycle Period" for PSv4.0 I built many months ago. Be forewarned, this is not an indicator, this is a detector to be used by ADVANCED developers to build futuristic indicators in Pine. The origins of this script come from a document by Dr . John Ehlers entitled "SIGNAL ANALYSIS CONCEPTS". You may find this using the NSA's reverse search engine "goggles", as I call it. John Ehlers' MESA used this measurement to
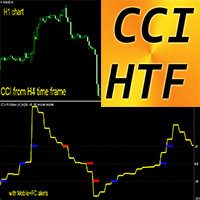
MT4用外国為替インジケーターCCI HTFオシレーター
MT4 用のプロフェッショナルな CCI HTF オシレーターで取引方法をアップグレードしてください。 HTF とは、より高い時間枠を意味します。 コモディティ チャネル インデックス (CCI) は、現在の価格と過去の平均価格の差を測定します。 重要なレベル: +/-200、+/-100 +200ゾーンより上の売りエントリーと-200以下のゾーンからの買いエントリーを取るのは素晴らしいことです このインジケーターは、プライスアクションエントリーまたは他のインジケーターと組み合わせたマルチタイムフレーム取引システムに最適です。 CCI HTF オシレーター インジケーターを使用すると、より高い時間枠から現在のチャートに CCI を接続できます。 インジケーターにはモバイルおよび PC アラートが組み込まれています
// さらに優れたエキスパートアドバイザーとインジケーターはここから入手できます: https://www.mql5.com/en/users/def1380/seller // また、収益性が高く、安定してい

Scanner and Dashboard for Cycle Sniper ATR Fibo Channels Indicator
As users know indicator draws Fibonacci Channels and arrows according to the user's settings.
With CS ATR Fibo Channels Scanner, you will have the ability to watch the market.
- Multi Timeframe - Multi Instrument
Enter your parameters to watch (as explained in Cycle Sniper ATR Fibo Channels Indicator )
- If you cho0se "Arrows by ATR Levels" , you will receive the potential reversal arrrows. - If you choose "Arrows by M

Индикатор рисует уровни Фибоначчи с выделенными Ценовыми метками.При установке индикатора на график необходимо создать трендовую линию с именем указанным в поле" Unique name of trend line to place fib on ". По умолчанию имя=" Unique name of trend line to place fib on" = "+" .В индикаторе можно заменить уровни фибоначчи по своему усмотрению.Также меняются цвет,стиль,толщина линий и т. д.
FREE
最適な逆指値の見つけ方固定ストップロスや過去の高値や安値の下に置くといった通常の人気のあるストップロス手法を使うことは、いくつかの理由で不利になります。1. 1. ブローカーはすでにこれらの領域を知っているので、それを利用するのは簡単です。2. 2. 市場が大きくなったり小さくなったりすることがあるので、常に固定ストップロスを使用することはできません。また、市場からの利益を少なくするか、すぐにストップアウトされるように自分を過剰に露出させることになります。3. 3. すでに人気のあるストップロス手法を使用してストップロスを設定すると、他の多くの人があなたと同じようにストップロスを使用する可能性があります。あるブローカーは、あなたが同じようなストップロス価格を使用しているというだけで、あなたの取引を他のトレーダーからコピーされたものとみなすかもしれません。当社のツールでは、ATRを一部使用したカスタムアルゴリズムを作成し、リアルタイムで市場の幅を計算し、常に最適なポジションを提供します。薄い市場ではストップロスのサイズを小さくし、広がった市場ではストップロスのサイズを大きくして、市場があ
Optimal Trailing TP インジケータは、エントリーツールと利益確定ツールの両方とし て機能します。そのユニークなデザインにより、買いシグナルと売りシグナルを提供することができます。すでにポジションを持っている場合は、シグナルの矢印を無視することができます。ポジションを持っていない場合、矢印は、インジケータが設定されている時間枠または通貨ペアでその方向への動きを警告することができます。したがって、シグナル矢印を利用してエントリーし、反対側の矢印でエグジットすることもできますし、反対側のシグナルを利用して既存の取引を終了することもでき、利益を追うことができます。矢印は素晴らしいエントリーシグナルであり、印刷された後に再描画されたり、薄くなったり、どのような形でも変化することはありません。すべてのタイムフレームで機能し、スキャルパーとスイングトレーダーの両方に効果的です。たとえあなたが初心者トレーダーであっても、"小さな損失と大きな勝利 "というシンプルかつ非常に強力な原則に従うため、利益を上げることができます。それは、市場がトレンドにあるとき、市場の正しい方向にあなたを保つ
MTF Optimal Trailing TP インジケータは、Optimal Trailing Take Profit と全く同様に機能しますが、シグナルを矢印の代わりにバーで表示し、同時に2つの異なるタイムフレームで表示されます。
これは、エントリーツールとテイクプロフィットの両方として機能することができます。私たちは、このツールをエントリーツールとテイクプロフィットツールの両方として使用しています。
最適な使い方は以下の通りです。
アルティメット・スナイパー・ダッシュボードを使い、高い時間枠の動きを探す。
低い時間枠で行って、高い時間枠の方向だけにツールを使ってエントリーする。こうすることで、偽の動きをスキップして、市場から簡単にお金を稼ぐことができます。
このMTFバージョンは2つのタイムフレームを持ち、両方のタイムフレームのシグナルを同時に表示することができます。フルカスタマイズが可能で、入力設定からタイムフレームを設定することができます。
もう一つの使い方は、連続する2つのタイムフレームに同時に設定することです。例えば、1分足と5分足です。
例えば
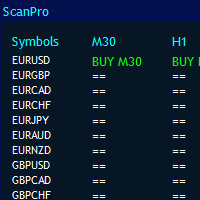
MT4 Universal Panel pro ex4ファイルを含むすべてのインジケーターとタイムフレーム用に設計されています。
それはあなたのコンピュータのパワーと最大10の時間枠に基づいて無制限のペアをスキャンすることができます。パネルのサイズは自動的に配置されます。
バッファによって任意のインジケータを呼び出すことができます。
これは、すべてのデフォルトおよびカスタムインジケーターで機能します。平観足、rsi、放物線、練行足、フラクタル、サポート抵抗、需給、発散、高値と安値の移動平均に簡単に使用できます。
すべての通貨に対して1つのウィンドウから操作できます。設定についてご不明な点がございましたらお問い合わせください。
これはmt4ダッシュボードであり、どのペアでも機能します。ペア名は以下のように入力するだけです。それは任意の外国為替インジケーターを呼び出し、そのシグナルバーをチェックします。
NS。パネル作業を行い、3ペアと複数の時間枠のみをスキャンする場合は、次のように入力します。
記号:EURUSD、GBPUSD、USDJPY
タイム
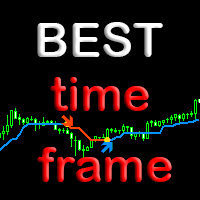
Индикатор BestTF поможет быстро выбрать самый лучший для торговли таймфрейм валютной пары или криптовалюты. Индикатор BestTF рассчитает и покажет в таблице крутизну графика (волатильность) для всех существующих таймфреймов текущего торгового инструмента. Почему важно правильно выбрать таймфрейм
Выбор таймфрейма является ключевым аспектом при торговле на валютном рынке по нескольким причинам:
Торговые стратегии: Различные торговые стратегии эффективны на разных таймфреймах. Например, краткоср
FREE

勝率計算システムが搭載されているインジケーター 【インジケーターの特徴】 このインジケーターは通常のテクニカル分析をサインシグナルで直感的に分かりやすく確認することができます。 また、現在のパラメーターが適切かを勝率を確認することでき、さらには、勝率が低い場合はサインを出さないという自動勝率判定システムが付いています。 これにより無駄なエントリーを減らし、勝率が高い時にだけエントリーすることができます。
【重要説明】 ・リペイント一切しません。1分足~週足まで使用可能です。 ・通貨制限はしていません。全通貨利用可能です。 ・勝率を計算することができます。 ・事前決定した勝率以上の時にだけシグナルを出すことができます。 ・負荷軽減対策済み!長期運用や9通貨同時運用可能です。 ・有名なインジケーターのため、サインを見ながら勉強も可能です。 ・デバッグ対応済み(不具合等デバッカーによる検証済み)
【MACD矢印サインのご説明】 MACD(移動平均収束拡散法)矢印サインインジケーターは、トレーダーにとって非常に有用なツールです。 相場の勢いとトレンド相場の強さを測定し、エントリーポ

株式(CFD)のみのデイトレード。
取引には手間がかかります。 すべてのエントリと終了を通知するショートカットやインジケータはありません。 利益は心の状態から来ます。 指標は、お金の管理と成功の心理学と組み合わせて使用されるツールです。 ボリュームプロファイルの不均衡を見つけます。 取引価格のボリュームの不均衡。
多くの不均衡は、クローズとオープンおよびニュースで発生します。 株の買い手と売り手を参照してください。 5分から1時間使用して、誰が価格を管理できるかを確認し、価格の不均衡を見つけます。 より大きな在庫は15分以上です。
カラーボリュームバーの上にマウスを置くと、過去のバーの数が表示されます。 現在のバーの音量は上隅に書かれています。
ボリュームの不均衡を見つけて、しばらくの間価格がどの方向に進むかを確認します。 最良の結果を得るために支配的な傾向に従ってください トレンドが発生した場合は、トレンドをトレードするようにしてください。 トレーリングストップを使用し、大量の反転の不均衡に注意してください。
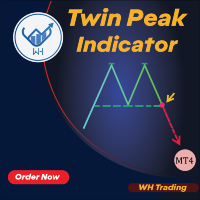
ツインピークインジケーターMT4へようこそ --(ダブルトップ/ボトム)-- ダブルトップアンドボトムインジケーターは、市場の潜在的な反転パターンを特定するために設計されたテクニカル分析ツールです。
これは、価格がほぼ同じ高さの 2 つの連続した山または谷を形成し、その後、反対方向に価格が変動した領域を特定します。
このパターンは、市場が勢いを失いつつあり、トレンド反転の準備ができている可能性があることを示しています。
特徴:
チャートの自動注釈: インディケータはチャート上のダブルトップとボトムのパターンを自動的にマークします。 使いやすさ: このインジケーターはユーザーフレンドリーで、MT5 プラットフォームのどのチャートにも簡単に適用できます。 カスタマイズ可能: インジケーターにはカスタマイズ可能な設定があります。 警報システム。 あらゆる楽器で動作します。 このインジケーターを他のテクニカル分析ツールと組み合わせて使用すると、トレンドの方向と反転パターンの潜在的な強さを確認できます。 全体として、ダブルトップアンドボトムインジケーターは、市場の潜在的
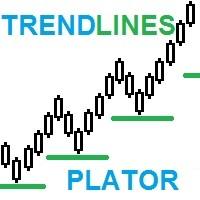
TrendLines Plator: トレンド予測の高度なインジケーターでトレード戦略を最大限に活用しましょう 当社の革新的なインジケーターのポテンシャルを探索しましょう!より広範な時間枠のトレンドラインを直接現在の時間枠に分析・予測できるこのインジケーターは、一般のトレーダーの注目を集める戦略的なサポートを提供します。これらのポイントは、取引において重要なサポートまたはレジスタンスのレベルに変わり、あなたのトレード戦略を強化します。 Price Actionのインジケーターの選択肢にうまく統合することができるこの革新的なインジケーターをイメージしてみてください。ご試用いただき、その精度に驚かれることでしょう。戦略を改善し、成果を向上させるための必須要素になるかもしれません。 この機会を見逃さないでください!ぜひ今すぐこの素晴らしいツールをトレードリソースに取り入れるチャンスをお見逃しなく。その価値とポテンシャルに気づいた場合は、迷わずに今日手に入れて、トレードの正確性を高め、新たな成功の領域に到達しましょう。 最新情報をいち早くご覧ください 当社の独占的なリリース情報を受け取るために

この指標は実際の経験に基づいている。
トップ/ボトムの日付/時刻を入れてください。
トップ/ボトムから現在までの最も訪問されたレベルを計算します。
ローソク足が更新されるたびに自動的に更新されます。 異なるトレンドと時間枠の複数のインディケータを同時に使用することができます。
長さは常にあなたの期間の開始から現在にプロットされます。
便利なPROツール。 この指標は実際の経験に基づいている。
トップ/ボトムの日付/時刻を入れてください。
トップ/ボトムから現在までの最も訪問されたレベルを計算します。
ローソク足が更新されるたびに自動的に更新されます。 異なるトレンドと時間枠の複数のインディケータを同時に使用することができます。
長さは常にあなたの期間の開始から現在にプロットされます。
便利なPROツール。

Description
The base of this indicator is an ZigZag algorithm based on ATR and Fibo retracement. The ZigZag can be drawn like a classic ZigZag or like Arrows or needn't be drawn at all. This indicator is not redrawing in sense that the ZigZag's last shoulder is formed right after the appropriate conditions occur on the market. The shoulder doesn't change its direction afterwards (can only continue). There are some other possibilities to show advanced information in this indicator: Auto Fibo on

Indicator SR levels true in small time frames is very useful for scalping while in bigger ones it is good for day or position trading.
SR levels true can draw 4 support/resistance levels based on defined maximum rebouds from price level. Indicator scans defined number of bars in time axis and defined number of pips in price axis (both sides - up and down) and calculates how much times price was rejected from scanned price levels. At the price levels where maximum rebounds are counted, support
FREE

Double Exponential Moving Average ( DEMA ) is a moving average (MA) that gives the most weight to recent price data.Like exponential moving average (EMA), it is more reactive to all price fluctuations than a simple moving average (SMA) and so DEMA can help traders to spot reversals sooner, because it is faster responding to any changes in market activity. DEMA was developed by Patrick Mulloy in an attempt to reduce the amount of lag time found in traditional MAs. ( TASC_Feb. 1994 ). DEMA can al
FREE

WolfeWaveBuilder インジケーターで取引に参加しましょう! これは、最も成功した収益性の高い投資決定を得るために特別に作成された独自のツールです。 ライブ口座に最適で、徹底的にテストされ、事実上保証された取引戦略から利益を得られます。 チャンスをお見逃しなく! WolfeWaveBuilder インジケーターでお金の取引を始めましょう!
MT5 バージョン https://www.mql5.com/ru/market/product/82360
インジケーターの機能
Wolfe Waves 戦略の合図を出します。 トレンドを表示します。 1980 年から使用されている実績のある効果的な戦略です。 シンプルなエントリーシグナル。 再描画せず、遅れません。 音、メール、電話でのお知らせがあります。
命令
矢印が表示されるか、端末にメッセージが表示されるか、メール、電話に通知されるまで待ちます。 あなたは取引を開きます。 価格がライン 1 ~ 4 を超えたときに終了することをお勧めします。 戦

これは、価格ラベル付きのAdvanced ZigZagDynamic および/または ExtendedFractals インジケーターの極値に基づくサポートおよびレジスタンスレベルのMTFインジケーターです(無効にすることができます)。 MTFモードでは、より高いTFを選択できます。デフォルトでは、レベルはZigZagインジケータードットに基づいて生成されます。フラクタルインジケータードットは、ZigZagと一緒に、またはその代わりに使用することもできます。使用を簡素化し、CPU時間を節約するために、計算はバーの開口部ごとに1回実行されます。 パラメーター: ForcedTF-レベル計算のチャート時間枠(現在の時間枠と等しいか、それを超える場合があります) MinPipsLevelWidth-ポイント単位の最小レベル幅(非常にタイトなレベルに使用) Use ZigZag Extremums points -ZigZagピークを使用してサポート/抵抗レベルを計算することを有効/無効にします Fixed pips range -ジグザグインジケーターを計算するための最小値と最大値の間の距離

真の需給指標 -すべての時間枠で抵抗の場所とサポートレベルをすばやく決定できます。 この指標は、取引でテクニカル分析を使用する人に役立ちます。 インジケーターは使いやすく、チャート上でドラッグアンドドロップするだけで、インジケーターは最も可能性の高いサポートレベルとレジスタンスレベルを表示します。 時間枠を切り替えると、新しく選択した時間枠のレベルが表示されます。
おすすめのロボットスキャルパー - テスト 。
入力パラメータ Use_priceラベル -オン/オフレベルの近くに価格アイコンを表示する 価格レベルの色 -価格アイコンの色を選択します 価格Lebelサイズ -価格アイコンサイズ サポート/耐性レベルの色 -レベルの色を選択します 私の購読 ページ 、私は他の多くの有用な製品を持っています。 この指標が気に入ったら 、レビューを残してください。便利な製品を無料で共有する動機付けになります。
CHART OBJECTS: Blue box : Bullish Order Blocks (OB) Red box : Bearish OB Orange box : Mitigated OB. Price bounce from this area the made a new high/low Light gray box : Price bounced from this area but did not made a new high/low Dark gray box : Broken OB. Filled boxes : TimeFrame 1 Order Blocks
Unfilled boxes : TimeFrame 2 Order Blocks
INDICATOR SETTINGS: Order Block Required Length: Required number of subsequent candles in the same direction to identify Order Block. Default value: 5 Im

The Moving Average Crossover Dashboard indicator is a technical tool that displays the crossovers of 2 selected moving averages on the price chart indicating whether it is a bullish or bearish crossover. In addition, as its name indicates, it shows a signal dashboard that indicates in which market and time frame a crossover of the two moving averages occurs. In the setting window the user can select the markets and time frames that can be displayed on the dashboard. You also have the option

MTF Heiken Ashi MA is a multiple timeframe Heiken Ashi & Moving Average indicator. Fully customizable for advanced & unique Heiken Ashi & Moving Average calculations.
Key Features Modified appearance and appeal from the traditional using only H eiken Ashi MA bodies. MTF Higher or lower timeframes available making this it great for trends and scalping. There are many settings that can be non-repaint for signals at a new bar and at bar 0.
Inputs Timeframe = PERIOD_CURRENT - timeframe of Movin
FREE
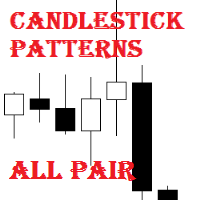
Candlestick Patterns All Pair is a simple and convenient indicator of candlestick pattens. It is able to identify 29 candlestick patterns. It displays the latest patterns for all pairs and timeframes.
The considerable advantages of the indicator It finds and marks 29 candlestick patterns; Displays a table of the last patterns for the 28 major pairs and each timeframe; It has settings for 5 extra pairs; Indicates the classic trade direction; Each candlestick patterns can be disabled in the sett
軍用犬s-軍を識別するスタート地点としてのインド処理します。 彼はすべてのペリドスのために働く。 戦略をダブルクリックすると、設定からADRレベルを開くことができます。 あなたはADR機能をオフにした場合、それはより多くの取引を見つけるでしょう。
特に、独自の戦略に加えて、それはあなたがより良い品質のフィルタを介して処理入力を渡すことができます。
あなたは、ADRレベルは、特定の毎日のボリュームを平均化し、ポイント数がこれらのレベルに近づいたときに取引を通知したいですか? 私たちは50ポイントに設定し、一般的な設定ではADRを制御しました。 オンにするには、strategy1ADR制御設定をtrueに設定する必要があります。 実験を指標に設定します。
指paritatesは、それが異なるすべての期間についてです。 そのような割引の助けは、あなたが勝つための補完的な効果をもたらすでしょう。

This multi time frame and multi symbol indicator identifies when the stochastics signal line (D) crosses the stochastics main line (K) as well as options to scan for main line and signal line level crossovers. As a bonus it can also scan for Bollinger bands and RSI overbought/oversold crosses. Combined with your own rules and techniques, this indicator will allow you to create (or enhance) your own powerful system. Features Can monitor all symbols visible in your Market Watch window at the sam

ADX arrow このインジケーターは、ADXインジケーター(平均方向移動インデックス)の信号をチャート上のポイントとして表示します。
これにより、信号の視覚的識別が容易になります。 インジケータはまた、警告(ポップアップメッセージボックス)プッシュと電子メールに信号を送信する機能します。
パラメータ 期間-期間を平均化します。 計算に使用される価格:終値、始値、高値、安値、中央値(高値+安値)/2、標準値(高値+安値+終値)/3、加重終値(高値+安値+終値)/4。 アラート-アラートを有効/無効にします。 電子メール-電子メールへの信号の送信を有効/無効にします。 Period - averaging period. Apply to - price used for calculations: Close, Open, High, Low, Median (high+low)/2, Typical (high+low+close)/3, Weighted Close (high+low+close+close)/4. Alert - enable/disabl

KFX SMA: Symbol Changer + Moving Average (3x) + ATR + RSI + Candle Timer.
This indicator allows you to create a Symbol list and change between symbols of the current chart or Timeframe by selecting the appropriate button. On Chart there are three(3) multi timeframe Moving Averages shown (selected by you), ATR Value MTF ( selected by you - helps with setting SL and TP), RSI Value MTF (selected by you) and a Candle Timer. Features: - Symbol Changer : Change Symbol and Timeframe of Chart. (
FREE

Defines extremes. This indicator consists of two parts. The first draws lines on the chart indicating low volatility in relative daily market activity. The second is responsible for determining the extremum and gives signals to buy or sell. This system is suitable for all instruments. It is recommended to use a timeframe from m15 to h4. Before using, you need to choose the settings for yourself. Configure lines deviation. Specify volatility coefficient. Advantages The indicator does not repaint
FREE

The ICT Unicorn Model indicator highlights the presence of "unicorn" patterns on the user's chart which is derived from the lectures of "The Inner Circle Trader" (ICT) .
Detected patterns are followed by targets with a distance controlled by the user.
USAGE (image 2) At its core, the ICT Unicorn Model relies on two popular concepts, Fair Value Gaps and Breaker Blocks. This combination highlights a future area of support/resistance.
A Bullish Unicorn Pattern consists ou

Enhance your trading precision with our revolutionary product, Trade Time Master Pro. This indicator provides unique insights into the duration of your active trades, offering a comprehensive view of their time in Days, Hours, Minutes, and Seconds. Indicator Features:
Time Display:
Indicator shows first 3 active trades (buy/sell trades) time duration in Days, Hours, Minutes, Seconds. Time duration means how long the order is active in the market, how long the order is running. Indicator shows
FREE

Ultimate Consecutive Bar Scanner (Multi Pair And Multi Time Frame) : ---LIMITED TIME OFFER: NEXT 25 CLIENTS ONLY ---46% OFF REGULAR PRICE AND 2 FREE BONUSES ---SEE BELOW FOR FULL DETAILS Unlike the equity markets which tend to trend for years at a time, the forex market is a stationary time series.
Therefore, when prices become severely over extended, it is only a matter of time before they make a retracement.
And eventually a reversal. This is a critical market dynamic that the institution

Ultimate Moving Average Scanner (Multi Pair And Multi Time Frame) : ---LIMITED TIME OFFER: NEXT 25 CLIENTS ONLY ---46% OFF REGULAR PRICE AND 2 FREE BONUSES ---SEE BELOW FOR FULL DETAILS Institutional traders use moving averages more than any other indicator. As moving averages offer a quick
and clear indication of the different phases of a trend. Such as expansion, pullback, consolidation and reversal.
And viewing the market through the same lens as the institutions is a critical part

What is ADR? Quite simply, ADR (Average Daily Range) is the average of price movement over a period of time. It can be used as a gauge of how far price may move on any given trading day. This indicator calculates 5, 10, 20 Average Daily Range Features: - Average: Daily Range, Prev 1/5/10/20 days - Calculator maximum stop loss/profit target by Risk/Reward percent of ADR in Pips. - Candle countdown - ... Contact me if you need: https://t.me/Cuongitl
FREE
Highly configurable OBV indicator.
Features: Highly customizable alert functions (at levels, crosses, direction changes via email, push, sound, popup) Multi timeframe ability Color customization (at levels, crosses, direction changes) Linear interpolation and histogram mode options Works on strategy tester in multi timeframe mode (at weekend without ticks also) Adjustable Levels Parameters:
OBV Timeframe: You can set the lower/higher timeframes for OBV. OBV Bar Shift: Y ou can set the offs
FREE

Ultimate Range Trade Scanner (Multi Pair And Multi Time Frame) : ---LIMITED TIME OFFER: NEXT 25 CLIENTS ONLY ---46% OFF REGULAR PRICE AND 2 FREE BONUSES ---SEE BELOW FOR FULL DETAILS The FX market is range bound at least 70% of the time. And many of the largest institutions
in the world focus on range trading. Such as BlackRock and Vanguard , who have a combined
$15 TRILLION under management.
Range trading has several distinct advantages that make it safer and more predictable
than

The indicator based on (Williams` Percent Range) analyzes the signal line touches along the channel walls and forms zones for deciding on the direction of the price movement. For convenience, an alert function is built in. You can also enable and disable the desired zones. Several indicators with different settings can be used on one chart. This will help you choose the best strategy.
FREE

The indicator is designed for displaying the following price levels on the chart: Previous day's high and low. Previous week's high and low. Previous month's high and low. Each of the level types is customizable. In the indicator settings, you set line style, line color, enable or disable separate levels. The version of the exact same indicator but only with sound alerts there - Time Levels with Alerts .
Configurations ----Day------------------------------------------------- DayLevels - enable
FREE
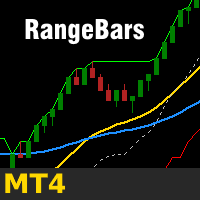
The robust charting solution enables creating custom live range bar charts on the MetaTrader 4 trading platform. You can apply all of the standard and custom indicators and technical studies directly to the range bar charts and you can run EAs directly on these charts as well* (for details see text below the input summary). To create a range bar chart you need to attach the Range Bar indicator to a standard time frame (1 minute is recommended) and use the indicator's settings to generate a live

Algorithmic Signals indicator is not an indicator but a strategy that generates entry/exit signals. The entry arrows are formed after multiple conditions are met. The indicator is using an Adaptive Algorithm which automatically adjust to the symbol and time frame (see the screenshots below) . Signals can be used for scalping or even trend trading. Main features:- Non repainting signals Entry signals Exit signals Alert for price reaching 1 x ATR(14) (could be utilized for initial take prof

The Bolliger Bands On-Off let you control the indicator using the keyboard or a button . You can choose if you want the indicator always shown or always hided while switching among different time frames or financial instruments . ---> This indicator is part of Combo Indicator OnOff
The Bollinger Bands identify the degree of real-time volatility for a financial instruments . A lower amplitude corresponds to a low volatility, conversely a greater bandwidth corresponds to high volatility. N
FREE

このアルゴリズムは、Currency PowerMeterインジケーターのアイデアに基づいています。このバージョンでは、表示される値の数は無制限であり、そのコードはよりコンパクトで高速であり、現在のバーの値はインジケーターバッファーを介して取得できます。 インジケーターが示すもの :細いバンドと通貨の前の上の数字は過去N時間の相対力指数を示し(Nは変数「時間」のパラメーターで設定されます)、広いバンドは日次インデックスを示します。入力パラメーターで指定するこの通貨を使用する通貨ペアが多いほど(ブローカーがペアの見積もりを提供すると仮定)、インデックスの重みが大きくなります(ただし、「非メジャー」通貨またはエキゾチック通貨のペアには注意してください。全体像を歪める)。たとえば、EURUSDのみを指定した場合、ユーロの相対インデックスはこのペアのみに基づいて計算されます。EURGBPを追加すると、ユーロインデックスは2つのペアに基づいて計算され、より重み付けされた値が取得されます。 データの使用方法 :重要なニュースがない場合、インデックス値が低い/高いほど、技術的な修正またはトレンドの継
FREE

Indicator draws Round Number lines by distance of pips. 1. You can enable / disable indicator to show / hide the lines. 2. You can set distance of pips between the lines. 3. You can edit the number of lines. 4. You can edit properties of lines by inputs (style (DASH, DOT, SOLID, ...) , width (1 for DASH, DOT, 2 is not for DASH, DOT, it only SOLID), color). When indicator is deleted from the chart, the lines will be removed.
FREE

This is a multi-currency author strategy, designed for trading on the M1, M5, M15, М30, Н1, Н4. Entry points are calculated using custom formulas and algorithms that allow you to effectively determine current trend in the market, obtain the entry points (buy/sell) and the optimal levels to close orders. The Cosmic Diviner Scalper System indicator can be used on any Forex pairs. The detailed guide on how to use the indicator is provided in the blog: https://www.mql5.com/en/blogs/post/719602 A hug

An indicator for visualizing time ranges of key trading sessions: Asian, European, and American. The indicator features functionality for setting the start and end times of each trading session, as well as an adjustable timezone of the trading server. The main advantages of the indicator include the ability to operate with minimal CPU load and memory usage. Moreover, it offers the option to specify the number of displayed historical days, providing the user with flexible market dynamics analysis
FREE

Индикатор сглаженного Stochastic Oscillator (xStoh)
Входные параметры: xK Period - K период xD Period - D период xSlowing - замедление xMethod - метод усреднения (0-SMA | 1-EMA | 2-SMMA | 3 - LWMA) xPrice field - тип цены (0 - Low/High | 1 - Close/Close) Принцип работы
Индикатор перерассчитывает стандартный технический индикатор Stochastic Oscillator (дважды усредняет получаемые значения iStochastic).
FREE

H I G H - P R O B A B I L I T Y - B R E A K O U T T R E N D L I N E I N D I C A T O R This is no ordinary trendline indicator. It has a highly-probability algorithms incorporated in the script to display only trendlines that may give a very high chance of price breakout. The indicator is not a stand alone indicator. Trader should interpret it together with their very own analysis technique to come up with a more efficient trading strategy. You can use with it other trend indic
FREE

NOTE!: The trend vote and the buy sell option shall match to the same direction before you put a trade!!
Indicator that uses Kalman filters (same as used on autonomous vehicles for data fusion between different sensors / technologies such as RADAR, LIDAR and Camera with Artificial Intelligence for object detection) by using the high and low price in order to identify buy and sell signals as indicated on the graph.
This indicator can be used on any timeframe with any currency or symbol.
Thi
FREE

Behaving in a similar fashion as the price action of a chart, the indicator uses " Trix " to opportune itself to the exposure of divergency, flat/low market volume, and price action expansion . The TRIX indicator nicknamed after the Triple-Exponential-average, is a momentum-based oscillator that filters minor price changes and fluctuations that are considered insignificant for forex trading whilst providing money making opportunities! Overall, TRIX is a leading indicator that shows diverge
FREE
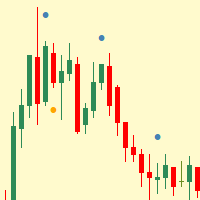
Simple indicator that shows internal (inside) bars.
Internal bars are probably one of the best price action setups to trade Forex with. This is due to the fact that they are a high-chance Forex trading strategy. They provide traders with a nice risk-reward ratio for the simple reason that they require smaller stop-losses compared to other setups. They can also be successfully utilised as reversal signals from key chart levels. Inside bar is a series of bars contained within the range of the c
FREE

The M.O.D.E stands for " Multiple Oscillator Divergence Exit ". It is an indicator which signals a divergence between the price, and multiple oscillators. It is initially an exit indicator because it signals the weakening of a trend, but it could be used as an entry signal if used analytically Key Features: Check many divergences at once Non repainting Sends Alerts and Push Notifications You could load the M.O.D.E onto a single chart, and be able to see the divergences happening on multiple os
FREE

This indicator is designed for binary options. Based on proprietary divergence of the CCI indicator. A sell signal: A down arrow appears on the chart. A buy signal: An up arrow appears on the chart.
Input parameters History - the number of bars in history for calculation Period CCI - period of the CCI technical indicator Up border - overbought limit for calculation of the divergence Down border - oversold limit for calculation of the divergence Price - price for the indicator calculation Alert
FREE

指標はトレンドフォロワー向けです!
3つの移動平均によって構築された取引システム。トレンドに合わせて取引し、利益を上げましょう。 Necessary for traders: tools and indicators Waves automatically calculate indicators, channel trend trading Perfect trend-wave automatic calculation channel calculation , MT4 Perfect trend-wave automatic calculation channel calculation , MT5 Local Trading copying Easy And Fast Copy , MT4 Easy And Fast Copy , MT5 Local Trading copying For DEMO Easy And Fast Copy , MT4 DEMO Easy And Fast Copy , MT5 DEMO
トレンドインジケーター、 波動標準の自動計算 、
FREE

Never miss a trend change again! This indicator uses various calculation methods based on price action to detect changes in the direction of the trend. It can be used on high timeframes (from H1 to D1) and is most suitable for H4 and Daily timeframe. This indicator is compatible with all broker symbols (forex, indices, CFD, commodities, crypto…). It is also possible to open the indicator on several charts to follow several symbols at the same time. In addition, you don't have to stand by your P
FREE

Indicator is converted from another programming language code by programmer " sbtnc ". MQL version is simplified to be more useful by less settings complexity. There is some clues from programmer about indicator: The indicator tracks and reports the percentage of occurrence of daily tops and bottoms by the time of the day. At certain times during the trading day, the market reverses and marks the high or low of the day. Tops and bottoms are vital when entering a trade, as they will decide if y
FREE

The indicator displays crossing zero level by Moving Average of Oscillator (OsMA) in the form of arrows. The indicator notifies about a signal by means of a pop-up Alert window, or sending notification to e-mail.
Parameters Fast EMA Period - fast EMA. This is an exponential moving average from a price with a short period. Slow EMA Period - slow EMA. This is also an exponential moving average of a market price but with a longer period. Signal SMA Period - MACD SMA. This is a signal line which i
FREE

Developed by Etienne Botes and Douglas Siepman, the Vortex Indicator consists of two oscillators that capture positive and negative trend movement. In creating this indicator, Botes and Seipman drew on the work of Welles Wilder and Viktor Schauberger, who is considered the father of implosion technology. Despite a rather involved formula, the indicator is quite straightforward to understand and easy to interpret. A bullish signal triggers when the positive trend indicator (VI+ green line) crosse
FREE
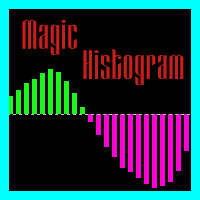
The Magic Histogram indicator is a universal tool, suitable for scalping and medium-term trading. This indicator uses an innovative formula and allows you to determine the direction and strength of the trend. Magic Histogram is not redrawn, so you can evaluate its efficiency using history data. It is most suitable for M5, M15, M30, H1 and H4. Version for the MetaTrader 5 terminal : https://www.mql5.com/en/market/product/58448
Indicator Benefits Excellent indicator signals! Suitable for beginn

Trends are like the "Saint Graal of traders": it can give you an higher win rate, a better risk to reward ration, an easier position management and so on...
But it is really hard to determine the trend with accuracy, avoiding fase signals, and with the right timing, in order to take massive movements. That's why I created the Trend Validator: a new and EASY tool that will make identifying trend and build new strategy a really easier work.
ANATOMY OF THE SOFTWARE
The indicator is composed b
FREE

TPSpro Screenshot is an indicator that screenshots the chart workspace and saves it to a folder you specify on your computer with a specified resolution and at a specified time interval. The following configurable parameters are available: Screenshot Width - Screenshot width Screenshot Height -Screenshot height The name of the folder for screenshots (by pressing "]") - The name of the folder for screenshots Rewritable File Name - Name of the file being rewritten Step in seconds for a photo - Ste
FREE

The indicator works as an extension that recolors the candles and the background in the terminal at the click of a button (Night Theme / Day Theme). The user can also set the display of the watermark of the symbol, and specify its size. The interactive menu allows you to toggle the display of the Ask value. And switch chart scaling from adaptive to fixed with one click.
You can add your favorite color to the settings for switching.
FREE

RaysFX EMA Crossover Scopri i potenziali punti di inversione del mercato con l’indicatore di Crossover EMA di RaysFX. Questo indicatore utilizza una combinazione di due medie mobili esponenziali (EMA) - una più veloce e una più lenta - per identificare i possibili punti di ingresso e uscita. Caratteristiche principali : Due EMA : Utilizza una EMA più veloce e una più lenta per catturare i movimenti di mercato a breve e lungo termine. Segnali di crossover : Genera un segnale quando l’EMA più v
FREE

Mr. Fibonacci は、チャート上でフィボナッチレベルを描画および調整するプロセスを簡素化するように設計された素晴らしいインジケーターです。このインジケーターはプロのトレーダーに優れたカスタマイズ オプションを提供し、あらゆるフィボナッチ レベルを正確に描画できるようにします。さらに、価格がフィボナッチレベルに入ったときにモバイル通知、電子メールアラート、ポップアップアラートを提供し、潜在的な取引機会を決して逃さないようにします。 このインジケーターを使用すると、フィボナッチレベルに達するまで価格変動を常に監視する必要がなくなります。代わりに、モバイル通知や電子メール アラートを利用して最新情報を入手できます。これにより貴重な時間が節約され、取引戦略の他の側面に集中できるようになります。さらに、フィボナッチ氏は、フィボナッチ レベルがポイントツーポイントで正しく描画されることを保証します。これは、正確な分析と意思決定にとって非常に重要です。 ユーザーフレンドリーなインターフェイスとクイックアクセスボタンにより、Mr. Fibonacci は使いやすく、ナビゲートしやすくなります
MetaTraderマーケットが取引戦略とテクニカル指標を販売するための最適な場所である理由をご存じですか?宣伝もソフトウェア保護も必要なく、支払いのトラブルもないことです。これらはすべて、MetaTraderマーケットで提供されます。
取引の機会を逃しています。
- 無料取引アプリ
- 8千を超えるシグナルをコピー
- 金融ニュースで金融マーケットを探索
新規登録
ログイン