YouTubeにあるマーケットチュートリアルビデオをご覧ください
ロボットや指標を購入する
仮想ホスティングで
EAを実行
EAを実行
ロボットや指標を購入前にテストする
マーケットで収入を得る
販売のためにプロダクトをプレゼンテーションする方法
MetaTrader 4のためのテクニカル指標 - 18

新しい指標の検索と試行をやめてください! Winshots Massive FX Profitsインジケーターを入手して、群衆から離れてください。
長年の取引経験により、このすべてを1つの指標で構築することができました。
Winshots Massive FX Profitsでプロのように取引しましょう!
この指標は、以下の方法論を使用して、より一貫した収益性の高いトレーダーになるのに役立ちます。
-マーケットボリュームプロファイル -毎日のピボットレベル -価格サイクル分析
ボリュームプロファイルとは何ですか?
ボリュームプロファイルは、多くのトレーダーが見落としている非常に便利な取引ツールです。重要な価格アクションが発生した実際の価格レベルを見つけることができます。サポートレベルとレジスタンスレベルに似ていますが、ロジックが異なります。ボリュームプロファイリングは、機関投資家の取引が行われた実際のレベルのサポートとレジスタンスの概要を示しています。これ以上の推測作業はありません!あなたはすべての重い取引がたくさんのロットとボリュームでいつ行われたか
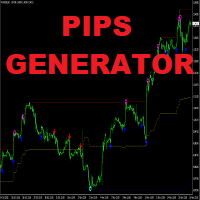
Apollo Pips Generator は、トレンドの方向にシグナルを提供するインジケーターです。インジケーターは複数のエントリーポイントを提供するため、常に利益を得る取引機会を見つけることができます。スクリーンショットに注意してください。 スクリーンショットは、上部と下部を示す星の信号が付いたチャネルで表される他のツールと組み合わせたPipsGeneratorツールを示しています。この組み合わせにより、システムを適用する方法が複数提供されます。 購入後、無料で私の2番目のインジケーターを取得するために私に連絡してください。スクリーンショットで示したものとまったく同じシステムになります。 また、このシステムを使用して最良の結果を得る方法についても説明します。 どちらのツールも、プッシュ通知を含むすべてのタイプのアラートを提供します。 私はあなたに幸せな取引を望みます!

Ichimoku Trend Finder is a multi symbol multi timeframe trend dashboard that helps traders to monitor and identify potential market trends from one chart. This panel scans the Ichimoku Kinko Hyo indicator in 28 configurable instruments and 9 timeframes for classic Ichimoku trend signals with a deep scan feature to scan all market watch symbols (up to 1000 instruments!).
Download Demo here (Scans only M1 and M5) Settings description here MT5 version here
After the purchase, don't fo

SYMBOL POWER based on inputted 5 time frames and Compared to 20 Other Symbols !! Great Indicator YOU DON'T HAVE TO SHIFT ON ALL TIME FRAMES FOR EACH CURRENCY PAIR TO CONCLUDE ITS TREND AND ITS POWER YOU HAVE IT ALL IN ONE TABLE , 20 CURRENCY PAIR WITH 5 TIME FRAMES ALSO , COMPARE BETWEEN CURRENCIES STRENGTH AND ALERTS THE STRONGER /WEAKER PAIR BASED ON 5 TIMEFRAMES CALCULATIONS ALEERTS enable /disable using 5 time frames M5 M30 H1 H4 and D1 ( latest version You SELECT you own 5 timeframes fr

Synchronize objects from one chart to multiple charts. Synchronize objects from one chart to multiple charts. 1. Allows automatic synchronization of new and edited objects to other charts. 2. Allows synchronization of all objects on the chart to other charts at the current time. 3. Allows setting the charts to synchronize based on the position of the chart in the MT4 window. Version 1.2: Allow set list of object names that you don't want to sync (Separated by commas ",")
Allow set 5 types of
FREE

STOCH AND RSI ALERT https://www.mql5.com/en/users/earobotkk/seller#products (I have created a dashboard from this product, please take a look by clicking here ) (I have also created an EA from this product, NOW user can go automation, click here ) P/S: If you like this indicator, please rate it with 5 stars in the review section, this will increase its popularity so that other users will be benefited from using it. This indicator notifies and draws an arrow on the chart whenever the main sto
FREE

The Heikin Ashi indicator is our version of the Heikin Ashi chart. Unlike competitor products, this indicator offers extensive options for calculating Heikin Ashi candles. In addition, it can be displayed as a classic or smoothed version.
The indicator can calculate Heikin Ashi with moving average by four methods: SMA - Simple Moving Average SMMA - Smoothed Moving Average EMA - Exponential Moving Average LWMA - Linear Weighted Moving Average
Main features The indicator shows Heikin
FREE

This indicator displays pivot points in the chart, including historical vales, and supports many calculation modes for Pivot Points and S/R levels. [ Installation Guide | Update Guide | Troubleshooting | FAQ | All Products ] It plots historical levels for backtesting purposes
It allows you to select the reference timeframe It implements different Pivot Point calculation modes It implements different SR calculation modes
It implements customizable colors and sizes
Calculation Modes The indi
FREE

With this system you can spot high-probability trades in direction of strong trends. You can profit from stop hunt moves initiated by the smart money!
Important Information How you can maximize the potential of the scanner, please read here: www.mql5.com/en/blogs/post/718109 Please read also the blog about the usage of the indicator: Professional Trading With Strong Momentum.
With this system you have 3 reliable edges on your side: A strong trend (=high probability of continuation) A deep pu
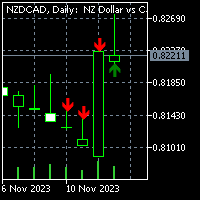
For MT5 version please click here . Introduction Most traders use candle patterns as a confirmation tool before entering a trade. As you know there are lots of candle patterns out there. However I realized most of them can be generalized in simple rules. So I developed my own candle pattern(Although I cannot say for sure this is mine). pattern description The pattern consists of three consecutive candles. This is true for most of the patterns out there (considering there is a confirmation nec
FREE

PLEASE TAKE NOTICE: This indicator is in current development. final version will be free.
This is a simple indicator that uses 3 timeframes in its formula to create Possible buy and sell signals. This indicator is optimized for the M1 timeframe Only. It has 2 types of Alerts: Push Notifications Audio Alerts UPDATES:
3/19/24: Still testing the final code
Troubleshooting: When loading the indicator, if you don't see the arrows on the current chart that means that MT4 has not loaded all the h
FREE
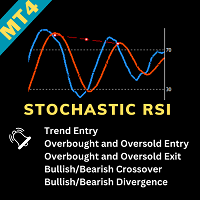
Stochastic RSI Indicator - Master the Art of Timing Elevate your trading game with the "Stochastic RSI Indicator." This powerful tool marries the Stochastic oscillator with the Relative Strength Index (RSI), offering precise insights into market dynamics. It's your key to mastering the art of timing in trading. About the Indicator : The Stochastic RSI Indicator combines two robust indicators - Stochastic and RSI - to provide traders with an exceptional tool for identifying entry and exit points
FREE

RoundNumbers indicator is a simple and powerful psychological price levels. Trader usually use these levels as a Support and Resistance (SnR). Indicator Input: Levels - Numbers of levels drawn on chart. Default 30 levels. BoxSize - Box size drawn on each levels, indicate buffers around levels. Default value 1pips (10point) above and below each levels. ZoneSize - Distance between each levels, default value 10pips (100point). Style & Colours - User inputs customization.
For MT5 version, please r
FREE
WHAT IS NEXT MOVE? SIMPLE ANSWER IS, THIS PROGRAM IS BASED ON PRICE ACTION THEREFORE FINDING NEXT MOVE IS EASY TO IDENTIFY THIS PROGRAM IS USING STANDARD CALCULATIONS FOR SUPPORT RESISTANCE IN SHAPE OF 2 WAYS TREND LINES SELECT HORIZONTAL LINES TREND LINES WILL GUIDE TRADERS TO TRADE IN RANGE WITH PIVOT LEVEL ALSO HORIZONTAL LINES GUIDE YOU ABOUT SUPPORT RESISTANCE OF DIFFERENT TIMEFRAMES FOR EXAMPLE: IF TRADER INTERESTED TO TRADE IN 15 MINUTES TIME FRAME, THEN HE CAN SELECT 15 MINUTES IN PR
FREE

GreenBoxインディケーター とは、 ダウ理論 を用いリアルタイムに 高値・安値を分析 し、 ダウ理論に基づいたトレンドラインを自動描画 したり、 押し安値や戻り高値をブレイク後の到達予測地点をBox形式で自動描画 するインディケーターです。FXやGoldなどの様々な銘柄で機能します。 高値・安値はnBarsパラメーター(初期値=5)で決まりますが、対応する移動平均線(nBarsの4~5倍のSMAやEMA)を同時に表示するとトレンド転換の様子がより分かり易くなります。
(無料のGreenBoxのデモ版をダウンロードして、 いつもトレードで利用している移動平均線 と それに対応するnBars値(=移動平均線÷(4~5))のGreenBox で効果があるか試してみて欲しいです。) nBars=5 -> 20SMA, 21EMA, 25SMA, 25EMA nBars=13 -> 55EMA, 52SMA nBars=34 -> 144EMA, 136SMA
<参考> ver.1.9で大幅に改善した通知機能を活用することで、 音声実況解説(GreenBoxがリアルタイムに各種分析

精度メーターの紹介:
精度メーターは、戦略の勝率を決定する強力なツールであり、メタトレーダー戦略テスターのようなすべてのトレードのエントリーポイントとエグジットポイントを示します。チャート上のインジケーターとしてシンプルなストラテジーテスターを使用し、さまざまなペアとタイムフレームにアタッチして調べることができます。戦略の正確さのパーセンテージ、ストップロスとリスクを報酬要素に変更し、それがトレーディングのアイデアにどのように影響するかを確認します。 Accuracy Meterはシンプルな戦略テスターです。この製品は、戦略テスターと同じチャート上の戦略の入口と出口にアクセスするのに役立ちます。この製品を使用すると、コストを節約し、不利益なEAを構築するためにお金を無駄にすることがありません。
よくある質問 :
どのように私はこの指標に私の戦略を定義できますか?
精度メーターには、カスタムインジケーターのパスと名前を調整できる入力設定があり、買いバッファーと売りバッファーの番号も定義できます。
以下の設定を使用できます。
カスタム指標名
FREE

A trend indicator showing the strength of bulls and bears in a trading range.
Consists of two lines:
The green line is a balanced overbought/oversold condition. The red line is the direction of trading activity. Does not redraw calculations.
Can be used on all Symbols/Instruments/Time Frames.
Easy to use and set up.
How to use the indicator and what it determines.
The basic rule is to follow the direction of the red line:
if it crosses the green line from the bottom up, the market i
FREE

CPR Pivot Lines It Will Draw Pivot Point R1,R2,R3 S1,S2,S3 Tc Bc Best Part Is That You Can Even Add Values Of High,Low,Close Manually Also To Get Your All Levels On Chart. So If Your Broker Data Of High ,Low ,Close Is Incorrect Then You Don’t Have To Depend On Them Anymore. You Can Even Modify All Lines Style. It Will Show Line In Floating Style And Not Continues Mess.
FREE

Time Range Separator is a useful tool to display a separator period on your platform. You could go in the properties of the indicator, select the desired range and that's ALL. We believe it is a useful and necessary that we wish to share with you for free all our followers.
Input Values: TimeFrame Period Separator GMT_Hour (ex. +1 or -1) to move the lines at Period Time +/- tot hours in input Hide_dates to show or hide the datetime on vertical lines VLine_Color = Vertical Color Line VLine_Styl
FREE

Using the indicator you can 1 Identify the trend and follow the large and small trends by drawing lines. When the price leaves the corridor of the lines, then with a high probability the price will go to the next line and reverse on it. 2 Long-line - Lay lines along the centers of fractals, the indicator can detect the fractal of the second point (Number bars analysis). Often the price can approach the line even after a week or a month and you can open a reversal trade. If the wave has passed w
FREE

ボリュームパーセンテージ折れ線グラフは、 ボリュームデータの洞察を提供するために設計されたインジケーターです。各キャンドルの合計ボリューム情報を取得し、それを全体ボリュームのパーセンテージとして表示します。このインジケーターはこのデータを別のウィンドウにグラフ線として表示するため、ユーザーは買い手と売り手の争いを簡単に視覚化できます。 このインジケーターの重要な機能の 1 つは、ボリュームのパーセンテージをグラフ線として表示できることです。売り手と買い手の間のボリューム分布を表すことにより、市場のダイナミクスに関する貴重な洞察が得られます。トレーダーは、表示されたパーセンテージに基づいて、売買圧力の相対的な強さを迅速に評価できます。 このインジケーターは、そのシンプルさとユーザーフレンドリーな性質で際立っています。最小限のパラメータ設定が必要なため、複雑な調整を行わずに取引戦略に簡単に統合できます。パラメーターに関して、ユーザーはボリューム ラインを描画する希望の期間を指定できるため、関心のある特定の間隔に焦点を当てることができます。 全体として、出来高パーセンテージ折れ線グラフは、ト
FREE
Highly configurable Macd indicator.
Features: Highly customizable alert functions (at levels, crosses, direction changes via email, push, sound, popup) Multi timeframe ability Color customization (at levels, crosses, direction changes) Linear interpolation and histogram mode options Works on strategy tester in multi timeframe mode (at weekend without ticks also) Adjustable Levels Parameters:
Stochastic RSI Timeframe: You can set the lower/higher timeframes for Stochastic RSI. Stochastic RSI
FREE
Color Levels - удобный инструмент для тех, кто использует технический анализ с использованием таких инструментов, как Трендовая линия и Прямоугольник. Имеется возможность настройки двух пустых прямоугольников, трех закрашенных и двух трендовых линий. Настройки индикатора крайне просты и делятся на пронумерованные блоки: С цифрами 1 и 2 вначале - настройки пустых прямоугольников (рамок); С цифрами 3, 4 и 5 - настройки закрашенных прямоугольников; С цифрами 6 и 7 - настройки трендовых линий. Объе
FREE

The Keltner Channel is a volatility-based technical indicator composed of three separate lines. The middle line is an exponential moving average (EMA) of the price. Additional lines are placed above and below the EMA. The upper band is typically set two times the Average True Range (ATR) above the EMA, and the lower band is typically set two times the ATR below the EMA. The bands expand and contract as volatility (measured by ATR) expands and contracts. Since most price action will be encompasse
FREE

または「MAC」。 これは、トレンドをキャプチャしてトレードするのに役立つように設計されたインジケーターです。この指標の背後にある考え方は、次のステップで説明できます。
移動の速い平均エンベロープを描画します。 移動の遅い平均エンベロープを描画します。 MACアッパーバンドは、両方のエンベロープの高値の間の最大値です。 MAC下限帯域は、両方のエンベロープの下限間の最小値です。 MACヒストグラムクラウドは、2つのバンド間の距離を埋めて、方向の変化を示します。 青い雲は上昇傾向を示し、赤い雲は下降傾向を示します。 次のブログを読んで、MACバッファーを使用して独自のEAまたはスキャナーを構築する方法を確認してください。
https://www.mql5.com/en/blogs/post/734293
MACの使い方
トレンドの方向性を特定するのに役立つフィルターとしてMACクラウドを使用します。 通常の取引ツールを使用してMACクラウドの方向に取引し、誤ったシグナルを可能な限り排除します。 提案されたエントリ矢印を使用して、開始する強力なトレンドポイントを見つ
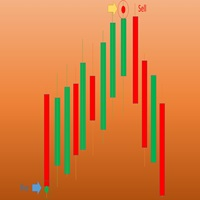
Wave Entry Alerts Oil is a custom indicator developed by Azad Gorgis for MetaTrader 4. This indicator is designed to provide alerts based on ZigZag patterns, specifically tailored for trading on the Oil (XIT/USD) symbol.
Key Features: - Chart Window Indicator: The indicator is designed to be displayed on the main chart window. - Arrow Signals: The indicator generates arrow signals on the chart, indicating potential reversal points based on ZigZag patterns. - Customizable Parameters: Traders c
FREE

ADX Channel is an indicator that plots the channel depending on the values of the ADX (Average Directional Movement Index) indicator. The resulting channel is a little similar to the Envelopes, but its lines depend on the market volatility. The sell trade is usually executed fast when the price touches and bounces from the upper line of the channel, buy - from the lower. It is recommended to trade when there is no significant news. The recommended timeframes: M5 - H1. The indicator is not design
FREE

YOU CAN NOW DOWNLOAD FREE VERSIONS OF OUR PAID INDICATORS . IT'S OUR WAY OF GIVING BACK TO THE COMMUNITY ! >>> GO HERE TO DOWNLOAD
Camarilla Pivots Historical plots the historical data of the camarilla pivot point levels on the chart. The Camarilla Pivot levels was originated in 1989 by Nick Scott. The levels are used as primary support and resistance levels by Intraday traders. The levels are calculated with the following formula: R4 = C + RANGE * 1.1/2 R3 = C + RANGE * 1.1/4 R2 = C + RAN
FREE
The MACD 2 Line Indicator is a powerful, upgraded version of the classic Moving Average Convergence Divergence (MACD) indicator.
This tool is the embodiment of versatility and functionality, capable of delivering comprehensive market insights to both beginner and advanced traders. The MACD 2 Line Indicator for MQL4 offers a dynamic perspective of market momentum and direction, through clear, visually compelling charts and real-time analysis.
Metatrader5 Version | All Products | Contac
FREE

The indicator looks for buying and selling zones, where a deal can be opened with a minimal stop loss and a better Risk Reward Ratio. The indicator is based on qualitative search of the Double top/Double bottom pattern. This version works only on USDCAD! The full version of the indicator can be purchased here - https://www.mql5.com/en/market/product/29820
Indicator operation principle Looks for local tops/bottoms which can potentially become a Reversal zone It waits for an impulse movement tha
FREE

このインジケーターは 1 つのチャートに 2 つの異なるペアを表示し、表示される情報を簡素化するように設計されています。 ターミナルで利用可能なほぼすべての商品(通貨ペアだけでなく、金属や原材料も)を扱うことができます。 あらゆる通貨ペアに対して視覚的な相関手法を使用する機能 サブシンボル。 通貨ペアは色付きのキャンドルで画面に表示されます。 これは同じ相関ペアです。 ミラーリング。 補助通貨。 このインジケーターは 2 種類の相関関係を反映します。
設定
サブシンボル = "USDCHF";
BullBarColor = オレンジレッド;
BearBarColor = 黄色; color GridColor = 白; ミラーリング = false;
The indicator displays two different pairs on one chart, designed to simplify the displayed information, Capable of working with almost all instru
FREE
トレード矢印付きの Macd 2 ライン インジケーター。
含まれるもの:
MACDシグナルとMACDライン 2色のヒストグラム 0レベル 可能性のあるトレードの矢 読み方 :
クロスが発生するとインジケーターに矢印が表示され、ファストラインがゼロラインの上または下に移動します。 適切なリスク管理を行い、ボラティリティの高いニュースに基づいて取引しないでください。
他の製品をチェックしてください: https://www.mql5.com/en/users/gabedk/seller Torēdo yajirushi-tsuki no Macd 2 rain injikētā. Fukuma reru mono: MACD shigunaru to MACD rain 2-shoku no hisutoguramu 0 reberu kanōsei no aru torēdo no ya yomikata: Kurosu ga hassei suru to injikētā ni yajirushi ga hyōji sa re, fasutorain ga zero
FREE

A simple indicator algorithm with the highest accuracy generates input signals by intersecting lines. Strategy for trading by trend, filtering and all the necessary functions built into one tool! The principle of the indicator is to automatically determine the current state of the market when it is placed on a chart, analyze historical data, based on historical data and display instructions to the trader for further actions. The system itself shows in the form of intersection of lines when to bu

Super Channels indicator is a channel indicator created by calculating support and resistance levels. It calculates by taking the average of support and resistance levels. After determining the number of candles, it takes the levels of the number of candles and creates an autonomous channel according to these levels. If you want to calculate how many candles, you must enter the number in the parameter section. Also, there are two types of modes in the indicator. The first is to calculate based o
FREE

This trend scanner indicator is using two main indicators to identify trends. Frist the EMAs to provide a view on Bullish / Bearish momentum. When the shorter EMA (calculated off more recent price action) crosses, or is above, the slower moving EMA (calculated off a longer period of price action), it suggests that the market is in an uptrend. Second the Stochastic RSI, When RSI is < 20 it is considered oversold, and when > 80 it is overbought. These conditions suggests that momentum is very str
FREE

これは無料の製品ですので、ニーズに合わせてご使用ください。
また、肯定的なフィードバックをいただき、大変感謝しております。 どうもありがとう!
// さらに優れたエキスパートアドバイザーとインジケーターはここから入手できます: https://www.mql5.com/en/users/def1380/seller // また、収益性が高く、安定していて信頼性の高いシグナル https://www.mql5.com/en/signals/1887493 に参加することも歓迎します。
MT4用FXインジケータースプレッド表示、取引サポート。
スプレッド表示インジケーターは、それが接続されている外国為替ペアの現在のスプレッドを示します。 スプレッド表示値はチャートのどの隅でも見つけることができます。 0 - 左上隅、1 - 右上、2 - 左下、3 - 右下 色や文字サイズなども設定可能です。 当MQL5サイトのみで提供しているオリジナル商品です
FREE

この指標は、W.D。Gannが書いた「市場予測の数式」の記事に基づく市場分析手法であり、9の2乗と144の2乗に依存しています。
ユーザーマニュアル: Add Your review And contact us to get it
MT5のフルバージョンは次の場所から購入できます。
https://www.mql5.com/en/market/product/28669
あなたは無料でMT4でテストすることができます:
https://www.mql5.com/en/market/product/15316
この製品は、レベル/スター/グリッド/ガンファン/として9の正方形を描くことができます。
ガンスクエアも描画します:52/90/144。
チャート上で直接移動可能なフリーガンスターを描画します。
また、ガンダイヤモンドを描画します。
それはあなたがあなたのエントリーのために最高のロットを計算することができるようにするロット計算機を持っています。
インジケーターにはパネルがあり、次のことができます。 144/90/5
FREE

この指標は、他のチャート指標に関連するチャネルを作成します: 指標 + ATR および指標 - ATR .価格がベースラインから上がりすぎていないかどうかを知るのに役立ちます。 ATR レベルは乗数で調整できます。 このバージョンは、MT4 の制限の一部を回避するために、対応する MT5 よりも複雑です。ベースラインの name 、 パラメーター (コンマで区切られた文字列)、および buffer を導入する必要があります。ベースラインに必要なすべての値が 1 つ のバッファーのみに含まれていることを確認してください (または、複数のインスタンスを配置する必要がある場合があります)。
ベースラインの文字列パラメータ はサポート されていません。導入された値に関係なく、デフォルト値が常に使用されます。 列挙子の場合は、その位置を使用します (ほとんどの場合、0 から始まります)。たとえば、MA モードの場合: sma=0;絵馬=1;スマ=2; lwma=3
利点として、このインジケーターは元のベースラインも表示するため、3 つの線すべてが同じインジケーターに表示されます。特別
FREE

O indicador TRIX, conforme o utilizado pelo grafista Didi Aguiar.
Este indicador é composto pela Triple Exponencial Average (TRIX), que neste setup é utilizada com o período 9, e um sinal de média simples do próprio indicador que é utilizado com o período 4.
Parâmetros: Período: 9 Sinal: 4
Os demais indicadores do sistema operacional de Didi Aguiar são:
Bollinger: período 8, desvio 2 ADX: período 8 DidiIndex com médias simples, períodos: 3, 8 e 20 Estocástico: 8, 3 3
FREE

Trend Filter Pro
Trend filter indicator.
Very good filter for your trading system, I recommend to use it together with - System Trend Pro and Professional Trade Arrow
The indicator no repaint!!!
Settings:
Change the Period parameter for better filtering ( default is 90)
Any questions? Need help?, I am always happy to help, write me in private messages or
In Telegram: https://t.me/Trader35_Admin
FREE
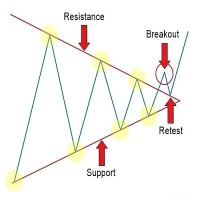
The indicator automatically plots significant trend lines and displays buy and sell signals. Signals are generated for reflection and breakdown from support and resistance lines. When a signal appears, the indicator displays it as an arrow of the specified color and also sends the message type specified in the input parameters. In the indicator settings, you can set the signal type, the maximum distance to the trend line, the type of notifications, as well as the settings for lines and arr

This indicator tool provides mini charts, with adjustable symbol/tf that can be dragged into place. Lightweight operation with multiple mini charts are supported.
Chart features: adjustable symbol and tf draggable multiple mini charts color styling and font sizing, foreground/background colors candle coloring candle styles; candles, bars, line, high-low channel
zoom in/out
FREE

親愛なる友人、ご清聴ありがとうございました。 異なる通貨ペアの動きが相互に関連していることを観察したい場合は、インジケーター Visual Correlation に注目してください。 異なる通貨ペアの動きは相互に関連しています。 Visual Correlation インジケーターを使用すると、スケールを維持しながら 1 つのチャート上にさまざまな金融商品を表示できます。 正の相関、負の相関、または相関なしを定義できます。
親愛なる友人、あなたは、いくつかの楽器が他の楽器よりも先に動くことをご存知でしょう。 このような瞬間は、グラフを重ね合わせることで判断できます。
親愛なる友人へ、チャート上に商品を表示するには、Symbol フィールドに商品名を入力する必要があります。 Version for MT5 https://www.mql5.com/ja/market/product/109155
FREE
GENERAL DESCRIPTION
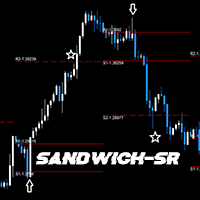
Simple SR Projection based on selected instrument's historical data. Best used in conjunction with current market sentiment, and fundamental analysis. Currently limited to selected pairs due to of historical data to project accurate levels.
Generally, for support and resistance, 2 levels are drawn, respectively. The inner levels (R1,S1) project the highs and lows during the opening stages of selected time frame. The outer levels, represent the targets to reach during the c
FREE
Download the free version here.
A Full Concept of BUY/SELL Scalping Strategy Trend detection is one of the basic challenges of every trader. Finding a way to tell when to enter a trade is very important, timing is a game changer, not too early and not too late. Sometimes, due to not knowing the market conditions, the trader closes his positions with a small profit or allows the losses to grow, these are the mistakes that novice traders make. Indicator Trend Whipper is a complete trading st
FREE
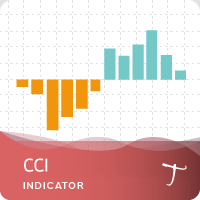
28 symbols, multi-time frame powerful Dashboard for the full market view Customizable Buy/Sell alerts, push alerts, email alerts, and visual on-screen alerts. Marked buy/sell signals Two color trend histogram. The commodity channel index (CCI) is an oscillator originally introduced by Donald Lambert in 1980. CCI measures current price level relative to an average price level over a given period of time. CCI is high when prices are above the average price, and low when the prices are below the a
FREE

To download MT5 version please click here . This is the exact conversion from TradingView: "B-Xtrender" By "QuantTherapy". - It is an oscillator based on RSI and multiple layers of moving averages. - It is a two in one indicator to calculate overbought and oversold zones for different RSI settings. - This indicator lets you read the buffers for all data on the window. - This is a non-repaint and light processing load indicator. - You can message in private chat for further changes you need.
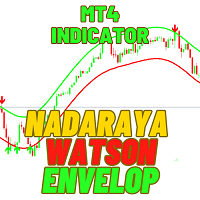
The Nadaraya Watson Envelope is a technical indicator available in the MetaTrader 4 (MT4) platform. It uses a non-parametric method to estimate the underlying trend of a financial asset based on its past price movements. The envelope is created by calculating a weighted average of the asset's past prices, with more recent prices being given greater weight. This produces a smooth curve that represents the estimated trend of the asset. The envelope is then drawn around this curve, with upper and l

Pattern Trader No Repaint Indicator
MT5 Version of the indicator: https://www.mql5.com/en/market/product/57462 Advanced Chart Patterns Tracker MT4: https://www.mql5.com/en/market/product/68550
I ndicator searches for 123 Pattern, 1234 Pattern, Double Top, Double Bottom Patterns , Head and Shoulders, Inverse Head and Shoulders and ZigZag 1.618 Pattern.
Pattern Trader indicator uses Zig Zag Indicator and Improved Fractals to determine the patterns. Targets and Stop Loss Levels are defined

Mean Reversion Supply Demand Indicator Mean Reversion Supply Demand is the indicator to detect the important supply demand zone in your chart. The concept of supply demand trading relies on the quantity mismatching between buying and selling volumes in the financial market. Typically, supply demand zone serves to predict the turning point. The wave pattern, for any supply demand zone to work as an successful trade, looks like the price must touch the base zone, move away and then return to zone

Introduction This indicator detects volume spread patterns for buy and sell opportunity. The patterns include demand and supply patterns. You might use each pattern for trading. However, these patterns are best used to detect the demand zone (=accumulation area) and supply zone (=distribution area). Demand pattern indicates generally potential buying opportunity. Supply pattern indicates generally potential selling opportunity. These are the underlying patterns rather than direct price action. T

Having to check constantly if your RSI has reached a specific level can be tedious and draining at times, especially if you have to monitor different asset classes at a time. The Alert RSI indicator will assist in this task, ensuring that you get the most with little effort. When the RSI values get to a specified level, the alerts will go off, on the chart, on the MT4 phone app or via email (You can receive text messages to your phone if you activate texts on your Gmail account). The indicator d
FREE

RSI Signal Scanner The primary trend of the stock or asset is an important tool in making sure the indicator's readings are properly understood. For example, some of the technical analysts, have promoted the idea that an oversold reading on the RSI in an uptrend is likely much higher than 30%, and an overbought reading on the RSI during a downtrend is much lower than the 70% level. This indicator notifies you of RSI important levels breakouts (30% and 70%) by searching among the symbols and chec
FREE

This indicator identifies No Demand –No Supply candles to your chart and plots volume bars colored according to the signal. It can be applied to all timeframes or to a specific one only. It can also be used as regular volume indicator but with exceptional future of WEIGHTED VOLUME. Furthermore is has an alert notification, sound and email when a signals occurs. The indicator does not repaint but the alert will come on two candles back due to the definition of No Demand No Supply. The VSA (Volum
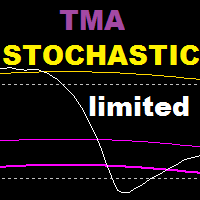
TMA Stochastic is an indicator based on stochastic oscillator and tma bands indicator , this indicator is based on a reversal strategy . Recommended time frame : 15 and above Recommended settings : lower values for scalping , higher values for swing trading WORKS ONLY ON EURUSD , GET THE FULL VERSION : https://www.mql5.com/en/market/product/108378 ======================================================================= Parameters : tma history : how many bars back to show tma bands on stochas
FREE

Bagaimana Cara membaca market melalui FMCBR-W - Didalam dunia trading ini pelbagai cara digunakan oleh trader dan penganalisa market membaca dan memahami trend. - Dari sudut FMCBR permulaan trend atau permulaan pullback dikenali melalui CB1. Apa pun dari sudut FMCBR-W trend didefinasikan melalui 3 combinasi yang saya akan kupas di muka surat seterusnya nanti. - Saya amat berharap agar pengunaan FMCBR-W nanti amat perlu terlebih dahulu memahami basic FMCBR…. Ini kerana kebanyakan entry FMCBR-W a
FREE

Flow Trend BLACK FRIDAY: 50% DISCONT > OLD PRICE 100$ > NOW 50$
Flow trend is designed to detect the market trend with special calculation and a combination of Bolinger band and statistical moving period
to detect the market trend without frequency change and fault.
This indicator is designed with simple parameters to use fast and easy and helpful tools to trade in a pure direction and set your SL/TP with this indicator cloud system.
FREE
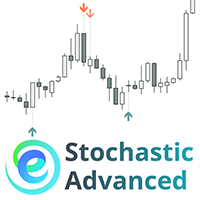
The " Stochastic Advanced " indicator displays the signals of the 'Stochastic" indicator directly on the chart without the presence of the indicator itself at the bottom of the screen. The indicator signals can be displayed not only on the current timeframe, but also on a timeframe one level higher. In addition, we have implemented a filter system based on the Moving Average indicator.
Manual (Be sure to read before purchasing) | Version for MT5 Advantages
1. Displaying the signals of the "Sto

This Currency Meter Calculates Strength Using a currency basket of 28 pairs? This Currency Meter uses a basket of 28 currency pair to define strength. This is very important because it gives an wholesome view of the strength of a currency by considering its reaction to all major currencies paired with it.
This Currency Meter is Multi-timeframe!!! Majority of the currency strength indicators around the market today only has a single time frame view. Even with the so called multi-timeframe ver

I present an indicator for professionals. ProfitMACD is very similar to classic MACD in appearance and its functions . However, ProfitMACD is based on completely new algorithms (for example, it has only one averaging period) and is more robust, especially on small timeframes, since it filters random price walks. The classic MACD indicator (Moving Average Convergence / Divergence) is a very good indicator following the trend, based on the ratio between two moving averages, namely the EM

Lisek Stochastic oscillator indicator with Alarm, Push Notifications and e-mail Notifications. The Stochastic indicator is a momentum indicator that shows you how strong or weak the current trend is. It helps you identify overbought and oversold market conditions within a trend. The Stochastic indicator is lagging indicator, which means it don't predict where price is going, it is only providing data on where price has been !!!
How to trade with Stochastic indicator: Trend following: As lon
FREE

MonsterDash Harmonic Indicator is a harmonic pattern dashboard. It recognizes all major patterns. MonsterDash is a dashboard that displays all detected patterns for all symbols and (almost) all timeframes in sortable and scrollable format. Users can add their own user defined patterns . MonsterDash can open and update charts with the pattern found.
Settings MonsterDash's default settings are good enough most of the time. Feel free to fine tune them to your needs. The color settings are for tho
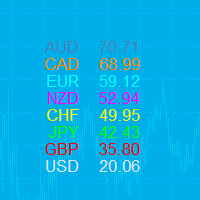
この指標は、8 つの主要通貨 (USD、EUR、GBP、AUD、NZD、CAD、CHF、JPY) の相対的な強さを示します。 力の値は 0 ~ 100 の範囲で正規化されます。 60 を超える値は強いことを意味します。 40未満の測定値は衰弱を示します。 購入する前に、無料のアドバイザー (ペア パワー インデックス) を試すことができます。 このアドバイザーは、28 ペアの評価、手動取引、自動ネットワーク取引、トレーリング ストップを使用した注文管理、および利益保護を提供します。 Pair Power Index Helper
チケット Only Show Current Pair - true の場合、現在のチャート ペアのみが表示されます。それ以外の場合は、8 つの曲線すべてが表示されます。 Bars To Show - フォース カーブを表示するバーの数。 Ma Periods To Smooth Curves : 強度曲線を平滑化するための移動平均期間 Suffix - 文字の接尾辞。今すぐインストールする必要はありません。 F

The indicator " ZigZag on Trend " is an assistant in determining the direction of price movement, as well as a calculator of bars and points. It consists of a trend indicator, which follows the price direction by the trend line presented in the form of a zigzag and a counter calculating the number of bars traversed in the direction of the trend and the number of points on the vertical scale. (calculations are carried out by the opening of the bar) The indicator does not redraw. For convenience,

This indicator is the basis for an Expert Advisor that can be categorized as "almost Grail". See details below. This indicator displays the projection of the Renko chart on the price chart. This projection is displayed as a stepped line, not as "bricks" (rectangles). See slides 1 and 2. Abbreviated name of the indicator: LRC – L ine of R enko on the price C hart. The principle of its construction is very simple. First, a grid of horizontal lines (levels) is bu
FREE
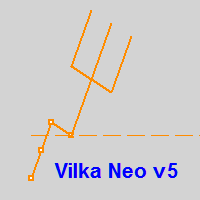
Вилка Нео v5, разрабатывалась для торговой системы "Оракул", но постепенно дополнялась, например - углами Ганна и другими опциями...
Можно создавать графические объекты с заданным цветом, стилем и толщиной, такие как: прямоугольники с заливкой и без, отрезки трендлиний и нестандартный инструмент - "вилка Нео" в виде трезубца, так же есть возможность интерактивно настраивать цветовую палитру прямо с графика, настраивать видимость объектов для разных ТФ, толщину и стили... Панель переключается кл
FREE

Consolidation is when price is moving inside a clear trading range. When prices are consolidated it shows the market maker placing orders on both sides of the market. This is mainly due to manipulate the un informed money. This indicator automatically identifies consolidation zones and plots them on the chart. The method of determining consolidation zones is based on pivot points and ATR, ensuring precise identification. The indicator also sends alert notifications to users when a new consolida

The "Dagangduit Spread Indicator" is a versatile tool designed to provide traders with essential information about the current spread in the chart window. This indicator offers customizable features, including font parameters, display location on the chart, spread normalization, and alerts to enhance your trading experience. Key Features: Real-time Spread Display : The indicator displays the current spread in real-time on your trading chart, allowing you to stay informed about the cost of execut
FREE

This multicurrency strategy simultaneously determines the strength of the trends, entry points and the take profit levels for each trade. The indicator can determine entry points on any trading period from M1 to D1. For the convenience of users, the indicator renders the entry point (in the form of an arrow), recommended take profit levels (TP1, TP2, TP3) and the recommended stop loss level (SL1, SL2). The options for using the strategy are described below. Full description of the indicator Cosm

ON Trade マルボーゾキャンドルパターンインジケーター マルボーゾキャンドルパターンは、市場のセンチメントや潜在的なトレンドの反転に関する貴重な洞察を提供できる強力でわかりやすいローソク足パターンです。このパターンは、一方向の優勢なトレンドに沿って延びる長い実体を持ち、片方の端に非常に小さなまたは存在しない影(ヒゲ)を持つローソクで特徴付けられます。このパターンは、買い手と売り手の間に強力なバランスの乱れがあることを示し、市場の勢いが強く片寄っていることを意味しています。 特徴と利点: クリアな市場センチメント: マルボーゾキャンドルは、市場の主なセンチメントを明確に表現しています。上昇(白)のマルボーゾは、始値から終値までの間に強力な買い圧力を示し、下降(黒)のマルボーゾは強力な売り圧力を示しています。 トレンドの継続または反転: コンテキストによって、マルボーゾパターンはトレンドの継続または潜在的なトレンドの反転を示すことがあります。長期のトレンドの後に現れる場合、そのトレンドの継続を示す可能性があります。逆に、サポートまたはレジスタンスの領域近くで現れるマルボーゾキャンドル
FREE
MetaTraderマーケットが取引戦略とテクニカル指標を販売するための最適な場所である理由をご存じですか?宣伝もソフトウェア保護も必要なく、支払いのトラブルもないことです。これらはすべて、MetaTraderマーケットで提供されます。
取引の機会を逃しています。
- 無料取引アプリ
- 8千を超えるシグナルをコピー
- 金融ニュースで金融マーケットを探索
新規登録
ログイン