YouTubeにあるマーケットチュートリアルビデオをご覧ください
ロボットや指標を購入する
仮想ホスティングで
EAを実行
EAを実行
ロボットや指標を購入前にテストする
マーケットで収入を得る
販売のためにプロダクトをプレゼンテーションする方法
MetaTrader 4のためのテクニカル指標 - 32

The indicator informs when the current bar closes and a new bar opens. TIME is an important element of trading systems. BarTimerPro indicator helps you CONTROL THE TIME . Easy to use: place on the chart and set “alarms” if it necessary. In the tester, the indicator does not work. See the Lite version BarTimerPro-Lite
Key Features
4 operating modes: Shows the time elapsed since the opening of the current bar (11) Shows the time remaining until the current bar closes (11) Indicator Updates Ever
FREE
Signal Trend Super
Indicator of accurate market entry.
Very good entry indicator for your trading system, I recommend to use it together with - System Trend Pro and Professional Trade Arrow
The indicator does not redraw and does not change its data. Wait until the candle closes.
Any questions? Need help?, I am always happy to help, write me in private messages or
In Telegram

The Hull Moving Average (HMA), developed by Alan Hull from 2005, one of the most fast-moving Average, reduce lag and easy to use to identify Trend for both Short & Long term. This Indicator is built based on exact formula of Hull Moving Average with 3 phases of calculation: Calculate Weighted Moving Average (WMA_01) with period n/2 & (WMA_02) with period n Calculate RAW-HMA: RAW-HMA = 2 * WMA_01(n/2) - WMA_02(n)
Weighted Moving Average with period sqrt(n) of RAW HMA HMA = WMA (RAW-HMA, sqrt(n
FREE

A Swing Failure Pattern ( SFP ) is a trade setup in which big traders hunt stop-losses above a key swing high or below a key swing low for the purpose of generating the liquidity needed to push price in the opposite direction. When price 1) pierces above a key swing high but then 2) closes back below that swing high, we have a potential bearish SFP . Bearish SFPs offer opportunities for short trades. When price 1) dumps below a key swing low but then 2) closes back above that swing low, we have

"Wouldn't we all love to reliably know when a stock is starting to trend, and when it is in flat territory? An indicator that would somehow tell you to ignore the head fakes and shakeouts, and focus only on the move that counts?" The Choppiness Index is a non-directional indicator designed to determine if the market is choppy (trading sideways) or not choppy (trading within a trend in either direction). It is an oscillating indicator between -50 (very trendy) and +50 (very choppy). There are man

Robin Scalper indicator is calculated based on advanced algorithm of several indicators.
The algorithm provides highly reliable entry points, and its simple settings allow using it for all symbols, time frames and trading styles.
Signals are generated at the closing of a bar and are not repaint .
Setting Parameters : Indicator Name - Indicator Name. Trend Period - Trend Period of the indicator. Filter - Signal smoothness. EMA fast Filter - Fast EMA filter. EMA slow Filter - Slow EMA

With the Trend and News indicator you will always be up to date!
Tells you in which direction it is safer to open positions 3 in 1: trends + news + news influence index
news for the selected period actual trends for five timeframes (M5, M15, H1, H4, D1 by default)
news impact index calculated by assessing the actual values of published news
News Displayed on the chart as vertical lines with a description in the form of a tooltip The text displays two news: the previous published and the ne

Small free indicator to detect certain chart patterns, shoulder head shoulder / reverse, triple top / bottom, cup, flags and others... I designed it a while ago, it detects figures in m1, m5, m15, m30 and h1.
I hope it will be useful to you because I don't trade much with this indicator, I have a few others that I will try to put online quickly maybe you will find it useful, good Trade friends.
FREE

Currency Correlation Plus is an expensive version of the indicator. It is equipped with the signal and is more equipped than its cheaper brother. The indicator helps us understand and see a correlation. Second chart makes it easy to analyze and trade multiple currencies. On the chart, you can post multiple pairs. Type in the selected currency pair in the settings and add it to the chart.
If you want to have another tool, see another product: https://www.mql5.com/en/market/product/13392
Inputs

This indicator triggers an alert for one of the most popular methods used in Stochastic Oscillator. This is as follow: a buying alert when the Oscillator (either MAIN [%K] or SIGNAL [%D]) falls below a specific level (e.g., 20) and then rises above that level. a selling alert when the Oscillator rises above a specific level (e.g., 80) and then falls below that level. Note: this tool was developed based on the code of Stochastic Oscillator indicator included by default in MetaTrader 4 terminal

APriceChannel is a modification of the standard Price_Channel indicator. The EA draws 2 levels - the upper level shows the price High for the specified period of time, the lower level shows the price Low for the same period. In addition to the period, you can set vertical offset in points to widen the channel up and down. This prevents false breakouts of current support/resistance levels.
Inputs Period - time period in bars - the number of bars to calculate the price High/Low. Offset up and do
FREE

It is an algorithm to detect trend changes early. You should try multiple values for the Multiplier parameter (1 <value <10 recommended). At first glance you can see effective entries. This is, in fact, one of the rows that Geleg Faktor initially had. But it was removed because it was no longer needed. The other rows were sufficient for G.Faktor's effectiveness, but I still wanted to share this one.
Always test before using it on your live account so that you fully understand how it works and
FREE

This indicator provides the analysis of tick volume deltas. It calculates tick volumes for buys and sells separately, and their delta on every bar, and displays volumes by price clusters (cells) within a specified bar (usually the latest one). This is a limited substitution of market delta analysis based on real volumes, which are not available on Forex. The indicator displays the following data in its sub-window: light-blue histogram - buy (long) volumes; orange histogram - sell (short) volumes

Rua Pinbar This is an indicator to help you quickly identify pinbar candles in the chart. Can be used on any currency pair and any time frame you want. This indicator is often used to determine entry points. You can refer to the product here: https://www.mql5.com/en/users/phamruacoder/seller
A product of Ruacoder Get code indicator and robot (EA) as required.
FREE
D1 Free Fibo Channels with support and resistences...
Become a constantly profitable 5-star forex trader!
We offer a few indicators to support you understand and analyse the market! With our strategies you will improve your trading system and bacome an expert...
We have indicators for trend direction, market direction and others.. for multi-time frames and that covers all majors or your favorite trading symbols! Some of them offer a customizable calculation parameters... or Graph features
FREE

Sends price alerts conveniently to your Android/IOS device. Make sure push notifications are enabled in Metatrader settings and the PC/VPS is online 24/7. Price levels are updated automatically, but you can modify them in global variables, if needed. Suitable for any market instrument, but if notifications are too frequent, increase point value of the indicator parameter.
FREE

Whether you are a scalper or daily trader, you will always look for bullish / bearish engulfing candles. This can be a bit tricky and stressful when you try to visually identify the engulfing candles on the chart. Not only that, you might be trading on the M15 time frame but the engulfing candle is forming or has already formed in the H4 time frame. This indicator is made to do that on your behalf. You can trade on any time frame and see Engulfing candles of another time frame, this means that y
FREE

Combined indicators, based on moving averages and price momentum, help you to know when to break out your profit timely. It lets you to ride on major trend as long as possible but knowing when to break out smart and timely. The indicator displays major trend, volatile, reversal signals and last lowest and highest price. It's status updated on top right of your chart keeps you informed about pip-changes involved.
Parameters: FAST Period
Period of the fast moving average
SLOW Period
Period
FREE
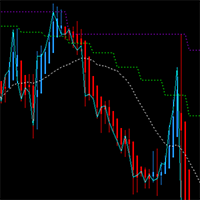
This MT4 chart trend checker cuts through the noise of market volatility to provide a clearer picture of trends and price movements. It includes the following features that can provide more clarity during market assessments: 1 customizable multi-period moving average Optional Heikin-Ashi candles 3 switchable focus modes Distinct colors for easy analysis
Link to MT5 version: https://www.mql5.com/en/market/product/106707/
This indicator shows your preferred moving average from multiple time fr
FREE

The Currency Strength Breakout indicator monitors eight currencies across M1, M5, M15, M30 & H1 time frames all in the same window.
Trade the strongest currency against the weakest with alerts for pullbacks giving you the opertunity to enter the trend. Please note: I have made the decision to give this Indicator away and many more for free with limited support so that I can concentrate on Custom EA.
View More Products - https://www.mql5.com/en/users/robots4forex/seller#!category=1
Monitoring
FREE

This indicator identifies pinbar candlesticks on the chart and displays an arrow as a trade signal based on the candlestick pattern. It offers user-friendly features, including push notifications and other types of alerts. It is most effective for identifying entry points or potential reversals at premium or discount prices. Additionally, it works on any time frame.
FREE
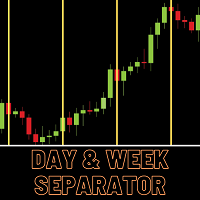
Day and Week separator is a very simple tool to show day and week separator lines from a specific time mentioned in the input. This is specially helpful for the trades who has time zone differences in their broker terminal. Let us take an example If user know that at 7:00 in the chart his local time 00:00 then he will simply put 7:00 in the input . Separator lines will starts drawing from current day's 7:00 There is also a bold line for weekly separator
FREE

ローソク足ギャップ インジケーターは、曜日ごとのローソク足ギャップを自動的に識別するため、 ギャップ取引戦略を 利用するトレーダーにとって不可欠なツールです。ギャップとは、連続する 2 日間の終値と始値の間の価格レベルの差を指します。このインジケーターは、共通、離脱、継続、枯渇の 4 種類のギャップ パターンを認識します。このインジケーターをチャートに組み込むことで、トレーダーはシグナルを検証し、取引の意思決定を強化できます。 ローソク足 GAP インジケーターの重要な特徴の 1 つは、D1 (日次) の下の任意の時間枠および任意のシンボルまたは商品に対して使用できる多用途性です。使いやすいパラメータを提供し、あらゆる経験レベルのトレーダーが利用できるようになります。このインジケーターはチャート上にギャップ パターンを迅速に描画し、迅速な分析と意思決定を可能にします。そのシンプルさにより使いやすさが向上し、簡単で効率的な取引体験が保証されます。 インジケーターのデータ表示パラメーターを使用すると、トレーダーはギャップ情報の外観をカスタマイズできます。ユーザーは、各曜日に関連付けられたテ
FREE

There are time periods in the market, when trading is highly likely to be unprofitable. This indicator warns you about such non-trading situations and helps you preserve your money and time.
Parameters Remind about non-trading periods: Expiration week - remind about the expiration week Consumer index day - remind a day before the release of Consumer index day NON FARM - remind a day before the release of NON FARM Christmas - remind a day before Christmas New Year Days 25.12 - 15.01 - remind ab
FREE
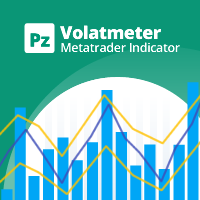
This indicator measures volatility in a multi-timeframe fashion aiming at identifying flat markets, volatility spikes and price movement cycles in the market. [ Installation Guide | Update Guide | Troubleshooting | FAQ | All Products ] Trade when volatility is on your side Identify short-term volatility and price spikes Find volatility cycles at a glance The indicator is non-repainting The ingredients of the indicator are the following... The green histogram is the current bar volatility The blu
FREE

GoldTrend MT4 - is a leading indicator for Gold on MetaTrader 4
- In Update version has been added new ability on USD pairs
( AUDUSD, EURUSD, GBPUSD, NZDUSD, USDCAD, USDCHF, USDJPY )
- very easy to use , even for beginners
- Stoploss and Take Profit provided - no repaint, no redraw and no lagging
When you decide to enter the global market , then there is a technical skill you absolutely must have, - which is all about trends .
Why - GoldTrend is different from others :
Not onl
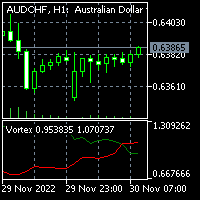
To download MT5 version please click here . - This is vortex indicator. - It is used to detect trend strength and direction. - It consists of two line(buffers). ==> VIM and VIP - There are three types of signals related to this indicator: 1. crossing VIM and VIP 2. threshold on distance between VIP and VIM 3. VIP above VIM vice versa. - This is a non-repaint indicator with light processing.
FREE
This indicator draws lines based on the standard Fractals indicator. Once a fractal is broken up or down, the indicator generates an alert, sends an email notification and a push message to your mobile phone.
User Inputs History - the number of bars in history for calculation. Color Up Fractal - the color of the upper fractal line. Color Down Fractal - the color of the lower fractal line. Width - the line width. Alerts - alert. EmailAlerts - email notification. NotificationAlert - push notific
FREE
With Symbol Switch you can easily change the symbol of all open charts without losing your analysis or template. Easily monitor many symbols with only one monitor. Auto save\load analysis separately for each symbol (including all graphical analysis and attached indicators). The indicator shows the symbols which are visible in your MT4 "Market Watch" window. To add\remove a symbol just add\remove it from MT4 "Market Watch" window. Monitoring all symbols profit with the panel. Works with all broke
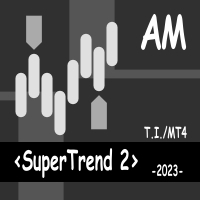
This indicator is a new version of the SuperTrend AM indicator. The indicator allows to open a position at the very beginning of the price movement. Another important feature of the indicator is the ability to follow the trend as long as possible to obtain all the potential profit while minimizing the potential losses. This indicator does not repaint or not recalculate. Signal of the indicator dot appearing above the price graph - possible start of a downtrend; dot appearing below the price grap
FREE

TIL Currency Performance Meter is an intuitive technical indicator for quantifying and visualizing the current momentum and relative strength of the eight major currencies, namely: USD, EUR, GBP, CHF, JPY, CAD, AUD, and NZD, on all timeframes. This is achieved by calculating and consolidating the price percent changes of 28 currency pairs from a certain point in time. The indicator generates a chart wherein each currency is represented by a color-coordinated bar that either shoots up or drops do

TIL Multi RSI indicator applies RSI to 28 currency pairs all at once and displays the most current signal of each one in a two-column list. The currency pairs involved are the combinations of the eight major currencies (USD, EUR, GBP, CHF, JPY, CAD, AUD, and NZD). All the currency pairs are sorted automatically from the one with the highest signal down to the one with the lowest signal in a two-column list starting from the top left to the bottom right. Just a quick recap on what the Relative St

Channel Builder(CB) または Ivanov Bands 指標は、 Bollinger Bands 指標を広く一般化したものです。これらの一般化は以下の通りです。まず、CBにおいて、平均線<X>が様々な平均化アルゴリズムを用いて計算される。次に、CBでは、平均偏差の計算に異なるコルモゴロフ平均化が使用されます。 標準のSMA、EMA、SMMA、およびLWMAの平均化アルゴリズムに加えて、中央の線<X>は、中央値=(最大+最小)/ 2スライディング中央値(既定値)になります。さらに、著者が開発した特別な<XF>(高速)および<XS>(低速)のスライディング平均アルゴリズムを使用して<X>を計算します。これらのアルゴリズムは、変動の激しい通貨市場に存在する貿易集約的な大きなノイズをフィルタリングします。つまり、フィルタリングアルゴリズム<XF>を使用すると、トレンドの始まりをすばやく判断できます。また、フィルタリングアルゴリズム<XS>を使用すると、フラット状態への出力をより適切に決定できます。最後に、CBでは、取引
FREE
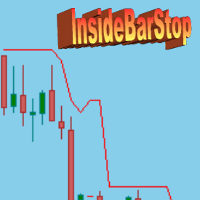
This indicator can be used to show and evaluate the trailing stop algorithm "Trailing Stop with Inside Bars" that was proposed by the famous German trader and author Michael Voigt ("Das grosse Buch der Markttechnik") to capture robust gains when trading strong price moves. The trailing stop price is shown as a red line. You can start the trailing stop anywhere on your chart (bars or candles) by setting the "initialBarDateTime" input parameter to the open time of an arbitrary candle You can speci
FREE
Recognizing trends is one of the most important analytical skills in trading. Not only technical traders, those who are fundamentally leaning to make the forex trend as the basis of analysis to determine entry trading. However, learning how to look at forex trends is not as simple as it seems. If you want signal accuracy to estimate the direction of the next price, then there are advanced methods in learning how to look at forex trends that you need to know. Strategy SIMPLE HOw to read trend mar
FREE

Forex trading support timer: - This is an indicator that supports a trader's trading process. - Before placing a BUY or SELL order, it is advisable to observe what the current time is like, to get the best position when trading. Function of indicator: - Display information about candle closing time of different timeframes (M1,M5,M15,H1), best used when Scalping. - Show market spreads. - Show TimeZone Trading. - Displays the remaining time of a session.
FREE

Индикатор для синхронизации и позиционировании графиков на одном и более терминалах одновременно. Выполняет ряд часто необходимых при анализе графиков функций: 1. Синхронизация графиков локально - в пределах одного терминала при прокрутке, изменении масштаба, переключении периодов графиков, все графики делают это одновременно. 2. Синхронизация графиков глобально - тоже самое, но на двух и более терминалах, как МТ4, так и МТ5. 3. Позиционирование графика на заданном месте при переключении периодо
FREE

移動平均は移動中に変化します。 インジケータは、移動平均を計算する期間を自動的に選択します。 動きの方向性が高いほど、平均化期間は長くなります。 トレンドが遅くなると、移動平均の期間が減少し、より速くなります。 これは傾向の変更により速く反応することを可能にする。
この指標は、トレンドまたはトレンド反転ポイントでうまく機能します。 横方向では、速い動きのあるものが遅いものを上に横切るときなど、インジケータは逆の方法で使用することができます-これは売りシグナルです。 または、チャネルを使用しておおよその購入ゾーンまたは販売ゾーンを決定することもできます。 チャンネル表示は、設定で有効にすることができます。
パラメータ:
自動計算のためのバー-このバー数について、インジケータは極端を検出し、最後の極端な時間に応じて移動平均の期間を計算します。
乗数-移動平均の差を設定します。
速度-ある期間から別の期間への移動平均の移行率を変更します。
channel-チャンネル表示を有効または無効にします。
インターフェイスの利便性のために他の設定もあります。
移動
FREE
As we know, МТ4 and МТ5 do not store tick history, which may be necessary to develop trading strategies and market analysis. I have developed a method allowing you to receive tick history very easily. The indicator gathers tick history in real time and writes it to XXXXXX2.hst file, where XXXXXX is a symbol name. This file can be used to create an offline chart or something else. If you use a trading robot, then launch the indicator and control your broker by examining the spread and quotes. All
FREE

MCTC is the most advanced multicurrency strength indicator for day trading, that does NOT use moving averages. This versatile strength meter has many settings that can be customized to suit the day traders needs. With up to 12 customization time periods, automatic calculation and graph plotting of previous period high/low values, 2 side meters showing currency strength, pair strength, points movement, points movement from previous periods, percentage, and pressure. Clickable chart for fast switc

The BuySellAlert free arrow indicator is developed based on the use of HMA, Laguerre, CCI, and ATR. The BuySellAlert free arrow indicator: generates possible entry points for BUY and SELL ; displays current profit ; displays current spread. The profitability of the indicator is shown in the screenshot on the example of the GBPUSD pair Does not redraw and works on opening bar. Timeframes - M1-H1. Recommended TimeFrame-M15. The BuySellAlert free works only with AUDUSD . Version without restric
FREE

The Sextet Scalper Pro is an MT4 indicator that gives signals when new waves are starting in a trend. The trends are calculated using the original " The Sextet " indicator method. You get a free EA to trade with The Sextet Scalper Pro: Free EA . Default settings were optimized on GBPUSD H1 from 2017.
EA could be tested on free demo version of The Sextet Scalper Pro, before purchase. Key Features: Uses The Sextet Trend Detection Method which is already a good strategy in itself for detecting l

Check out other great products from https://www.mql5.com/en/users/augustinekamatu/seller
This indicator finds the entry points based on divergences of common indicators and does not repaint . The principles used ensure that it can be used on CFDs, Commodities and Stock with incredibly great results. With proper money management and portfolio balancing the Indicator can be applied to any trading strategy to generate consistent profits. A Winning Trading Strategy This article describes the co
FREE
A quick indicator with simple settings that does not take up much space in the working window and is displayed as simply as possible. The indicator analyzes the divergence of the current closing price and the data obtained by smoothing the price series with two different (fast/slow) digital filters. The indicator allows you to clearly determine the medium/short-term trend and support/resistance levels at points where the trend direction changes. Indicator: does not redraw; has the ability to sen
FREE

This indicator identifies short-term, medium-term and long-term highs and lows of the market according to the method described by Larry Williams in the book "Long-term secrets to short-term trading".
Brief description of the principle of identifying the market highs and lows A short-term high is a high of a bar with lower highs on either side of it, and, conversely, a short-term low of a bar is a low with higher lows on either side of it. Medium-term highs and lows are determined similarly: a
FREE

VTrende Pro MT4 - MTF indicator for trend trading with a display panel for MT5 *** Videos can be translated into any language using subtitles (video language - Russian)
Although the signals of the VTrende Pro indicator can be used as signals of a full-fledged trading system,
it is recommended to use them in conjunction with the Bill Williams TS.
VTrende Pro MT4 is an extended version of the VTrende indicator. Difference between Pro version and VTrende:
- Time zones
- Signal V - signal 1-

3 strategies with RSI! Alerts! Signal freshness check! The indicator is based on the classic RSI. I recommend watching my advisor - Night Zen EA It includes 3 strategies: Entry of the RSI indicator into the overbought zone (for buy trades) / oversold (for sell trades) Exit of the RSI indicator from the overbought zone (for sell trades) / oversold (for buy trades) Touching the overbought limit (for sell trades) / oversold (for buy trades) The indicator provides alerts. To enable them in the s
FREE

Property of Vertical Capital Edition: Gugol_Quants About USA INDEXES QUANT_INDICATOR: This is a indicator created by math modulation to be used as a trading tool, which was developed in MQL. (MT4) This indicator is for use only with US500(S&P500), NAS100(Nasdaq Composite) and US30(Dow Jones). Signals are activated on "Open" Candle. It’s based on Intraday/Swing Trades whose main timeframe is H1, H2, H3 and H4. However you can use it with other assets by testing with the appropriate settings. *
FREE

The Icarus Reversals(TM) FREE Indicator is a powerful tool to identify high-probability reversal points, across all instruments. The Reversals Indicator provides traders and investors with a simple-to-use and highly dynamic insight into points of likely price-action reversals. Generated by a unique proprietary code-set, the Reversals Indicator (FREE version) generates long and short trade signals, which can be customised for key inputs and colourisation. Settings of the Icarus Reversals FREE h
FREE

Description This is an indicator that colors market moods on a linear chart in the window of the main financial instrument. It is useful for determining support and resistance levels. Purpose The indicator can be used for manual or automated trading as part of an Expert Advisor. For automated trading, you can use values of indicator buffers of the double type: rising line - buffer 0, must not be equal to EMPTY_VALUE. falling line - buffer 1, must not be equal to EMPTY_VALUE.
FREE
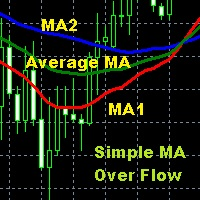
Moving Average is one of the indicators that is widely used in technical analysis which can help to smooth price movements by eliminating some price fluctuations that are less relevant based on past price calculations, so that an average line of price movements is formed within a certain time period. Simple Moving Average Over Flow is an indicator writen by MQL$ language that is given a special additional moving average line based on certain calculations so as to make this moving average better
FREE

Rainbow MT4 is a technical indicator based on Moving average with period 34 and very easy to use. When price crosses above MA and MA changes color to green, it’s a signal to buy. When price crosses below MA and MA changes color to red, it’s a signal to sell. The Expert advisor ( Rainbow EA MT4) based on Rainbow MT4 indicator, as you can see in the short video below is now available here .
FREE

This indicator can display 1 or 2 MACD indicator on different time-frames and settings. Uses EMA for calculation. The active indicators can give visual and sound alert on zero-level-cross if the user choose that option. Alert can be set on one or both active indicator, even if the time-frame, and the period different on each. When alert set to both, the two MACD histogram must be on the same size of the 0 level to get an arrow. There is a display panel with buttons on the main chart, what is sho
FREE

Fractal Divergence Channel is based on the fractal divergence patterns , representing them in the form of a channel with the borders changing the moment the next pattern appears. The upper border of the channel corresponds to the upper part of the last found bearish fractal divergence pattern. The lower border of the channel is the lower part of the last found bullish pattern (see screenshot 1). Compared to the FractalDivergence_Patterns indicator, the channel version has the same parameters wit
FREE

The "Pyramids trend line" is a trading and a Filtering tool too, it is based on a combination of important indicators in one tool. We programmed a dashboard that helps you know the current direction for each time frame, to avoid wasting time searching for it. We also put a percentage of the trend to know its current strength (using all time frames).
The advantages of this indicator: It is easy to know the trend in all time frame. It is easy to know the strength of the trend. It gives you th

Multi Timeframe Indicator includes a lot of functions and can be considered as a universal helper for a trader. It's main objective is to display up to 10 indicators at a time using just one small brick per each of them. These indicators involve Awesome Oscillator, CCI, DeMarker, MACD, RSI, RVI, Stochastic, Larry Williams' Percent Range, Bulls Power and Bears Power. An important function of the indicator is an ability to monitor signals from different timeframes. You can choose different combina

Nermal Round Levels is an indicator of round numbers in the form of a grid drawing horizontal lines. You can use it in many ways ... as it could be activating for an expert advisor to enter the market, confirmation of entry for your strategy, entrance area, mark areas of important levels, possible rebounds and others. Place it in your chart and verify as the price respects those round levels.
Inputs GridSpace linecolor lineStyle
FREE

Supertrend Moving Average A combination of Supertrend and Moving Average to create a converging trade setup Input parameters: signal mode: set it to true if you want to plug it into STAT (Signal Tester and Trader) arrow shift: distance between fast EMA line to arrow on chart turn on moving average signal for converging setup supertrend period ATR multiplier Moving average period Averaging method Pricing You can find the best setting for 4 hour EURUSD on this video
FREE

Cross Trend Lines indicator trend indicator of find. This indicator, an array of works by using a series of indicator and algorithm. Uses two lines to find trends. The intersection of this line means that the start of the trend. These lines are green, tend to rise. Red lines indicate the downward trend. Use of this indicator is easy to understand. This indicator on its own or you can use other indicators that are appropriate for the strategy.
Suggestions and Features Starts a new trend at th
FREE

A simple information indicator showing the time left before the opening of the next candlestick or bar.
About the concept of a timeframe A timeframe is the time interval considered in the technical analysis of free financial markets (the same applies to the global currency market), during which the price and other market data change. The smallest timeframe is the so-called tick. A timeframe is the time interval used to group quotes when drawing elements of a price chart (bars, Japanese candles
FREE

Smart Trend Line Alert Demo is a unique professional Trend Line, Support Line and Resistance Line Touch and Break out Alert with awesome Alert History feature, designed to help traders easily manage many charts and symbols without staring at the monitor. Note: This a Demo version operating only on USDCHF . Full version link: https://www.mql5.com/en/market/product/3085
Features Candle Break Out Alert, Price Touch Alert and Time Line Alert; 1 click for converting any drawn line into an alert lin
FREE

The ICT Concepts indicator regroups core concepts highlighted by trader and educator "The Inner Circle Trader" (ICT) into an all-in-one toolkit. Features include Market Structure (MSS & BOS), Order Blocks, Imbalances, Buyside/Sellside Liquidity, Displacements, ICT Killzones, and New Week/Day Opening Gaps. It’s one kind of Smart money concepts. USAGE: Please read this document ! DETAILS Market Structure Market structure labels are constructed from price breaking a prior extreme

A flexible 2-Line MACD indicator The default MACD indicator inside MT4, limits you to using the MACD with a fast-EMA, slow-EMA, and signal-SMA. This MACD indicator allows you to set your own MA-Method choices for these 3 components, separately! You can select from SMA-EMA-SMMA-LWMA, and can even use a separate method for each 3 fast-slow-signal periods. A more featured version is available with colored candles+conditions, full alerts+conditions, line coloring, DEMA and TEMA options; MACD MAX
FREE

The indicator finds candlestick patterns based on Gregory L.' Morris "Candlestick Charting Explained: Timeless Techniques for Trading Stocks and Futures". If a pattern is detected, the indicator displays a message at a bar closure. If you trade using the MetaTrader 5 terminal, then you can download the full analogue of the " Candle Pattern Finder for MT5 " indicator It recognizes the following patterns: Bullish/Bearish (possible settings in brackets) : Hammer / Shooting Star (with or without con

Resistance and Support is an easy to use indicator to apply horizontal lines of resistance and support. There are two windows for adding levels. When you press the button, a line appears on the price chart. It is possible to double-click this line with the mouse to activate and move it, thereby changing the indicator readings. In the indicator menu there is a choice of possible alerts - no alert, alert on touching the level an alert for closing the candle after the level.
FREE
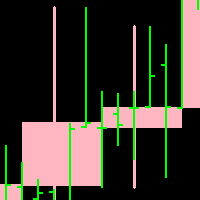
Candleline: candleline indicator. According to the specified period, draw the candle line of the specified period on the current chart. In addition, the new candlelight line is superimposed with the candlelight line of the current chart.
Note: the period of the current chart must be less than the period of the candle line to be drawn.
For the specific effect of self drawing candle line, please see the attached picture below. Parameter: 1.TimeFrame; 2. NumberOfBar; 3.Up candle
FREE

This indicator will monitor all open trades in the account, no matter how many Symbols there are. It will also show the total lotsize for all open trades, and total Profit & Loss for all open trades. It's a very handy tool when you have multiple open trades for multiple symbols. It's mostly to give you a list view of all your open trades in real time, with real time P&L. It will also give you an idea the total lot size that's used in comparison to the account balance.
FREE

The Visual Result Calculator Indicator is a powerful tool designed to enhance your trading experience on the MetaTrader platform. This intuitive and user-friendly indicator allows you to visualize potential profits or losses on a trading chart, helping you make better-informed decisions and manage your trades with precision. The Indicator displays a dynamic line on the trading chart, representing the potential profit or loss of a trade based on the start and end of the line. Simply click and
FREE

The MP Andean Oscillator is used to estimate the direction and also the degree of variations of trends. It contains 3 components: Bull component, Bear component and Signal component. A rising Bull component indicates that the market is up-trending while a rising Bear component indicates the presence of down-trending market. Settings: Oscillator period: Specifies the importance of the trends degree of variations measured by the indicator. Signal line per: Moving average period of the Signal line
FREE

The purpose of this new version of the MT4 standard indicator provided in your platform is to display in a sub-window multiple timeframes of the same indicator. See the example shown in the picture below. But the display isn’t like a simple MTF indicator. This is the real display of the indicator on its timeframe. Here's the options available in the FFx indicator: Select the timeframes to be displayed (M1 to Monthly) Define the width (number of bars) for each timeframe box Alert pop up/sound/ema
FREE
MetaTraderマーケットは自動売買ロボットとテクニカル指標を販売するための最もいい場所です。
魅力的なデザインと説明を備えたMetaTraderプラットフォーム用アプリを開発するだけでいいのです。マーケットでプロダクトをパブリッシュして何百万ものMetaTraderユーザーに提供する方法をご覧ください。
取引の機会を逃しています。
- 無料取引アプリ
- 8千を超えるシグナルをコピー
- 金融ニュースで金融マーケットを探索
新規登録
ログイン