Trying to find the cause of thinness...
Interesting
1st thing that comes to mind is that there are more bars with "next to each otherness" ( 😋 ) , i'll whip up a formula with coffee .
Will yo analyze it on mt4 or mt5 ?There is nothing special to evaluate. AUCAD simply has larger bar ranges (is more volatile) in comparison to the overall price movement.
In other words, it has a larger ATR in relation to the average close-to-close price range.
@Gtrade i played around with it a bit and i got a higher baldness index for usdjpy .
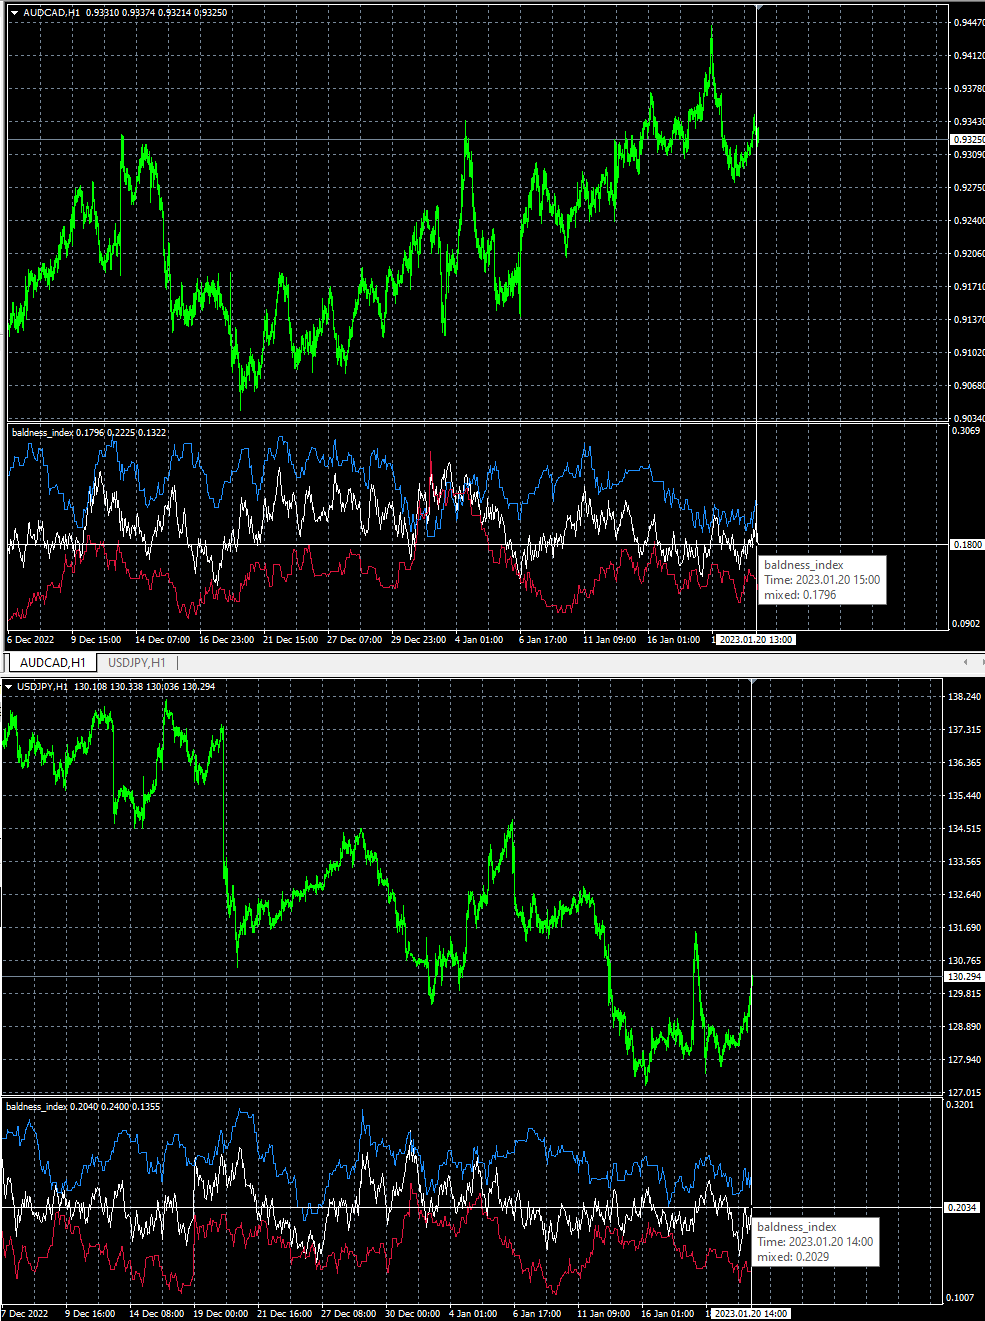
Here is the code i used . The blue line indicates the "baldness" when the bars are the same direction and
the red the "baldness" when the bars are of opposite direction. White is the mixed
This would be problematic in gap scenarios.
#property copyright "Read the discussion"
#property link      "https://www.mql5.com/en/forum/440175"
#property version   "1.00"
#property strict
#property indicator_separate_window
#property indicator_buffers 3
#property indicator_plots   3
//--- plot mixed
#property indicator_label1  "mixed"
#property indicator_type1   DRAW_LINE
#property indicator_color1  clrWhite
#property indicator_style1  STYLE_SOLID
#property indicator_width1  1
//--- plot similar
#property indicator_label2  "similar"
#property indicator_type2   DRAW_LINE
#property indicator_color2  clrDodgerBlue
#property indicator_style2  STYLE_SOLID
#property indicator_width2  1
//--- plot opposite
#property indicator_label3  "opposite"
#property indicator_type3   DRAW_LINE
#property indicator_color3  clrCrimson
#property indicator_style3  STYLE_SOLID
#property indicator_width3  1
input bool measure_wicks=true;//measure wicks ?
input int period=14;//period

//--- indicator buffers
double         mixed[];
double         similar[];
double         opposite[];
//+------------------------------------------------------------------+
//| Custom indicator initialization function                         |
//+------------------------------------------------------------------+
int OnInit()
  {
//--- indicator buffers mapping
   SetIndexBuffer(0,mixed);
   SetIndexBuffer(1,similar);
   SetIndexBuffer(2,opposite);
   reset();
//---
   return(INIT_SUCCEEDED);
  }

void reset(){
ArrayFill(mixed,0,ArraySize(mixed),0.0);
ArrayFill(similar,0,ArraySize(similar),0.0);
ArrayFill(opposite,0,ArraySize(opposite),0.0);
}
//+------------------------------------------------------------------+
//| Custom indicator iteration function                              |
//+------------------------------------------------------------------+
int OnCalculate(const int rates_total,
                const int prev_calculated,
                const datetime &time[],
                const double &open[],
                const double &high[],
                const double &low[],
                const double &close[],
                const long &tick_volume[],
                const long &volume[],
                const int &spread[])
  {
//---
  int from=MathMin(rates_total-prev_calculated,rates_total-period-2);
  for(int i=from;i>=0;i--)
  {
  mixed[i]=mixed[i+1];
  similar[i]=similar[i+1];
  opposite[i]=opposite[i+1];
  double prev_high=High[i+1];
  double prev_low=Low[i+1];
  double this_high=High[i];
  double this_low=Low[i];
  //if we ignore wicks
    if(!measure_wicks){
    prev_high=MathMax(Open[i+1],Close[i+1]);
    prev_low=MathMin(Open[i+1],Close[i+1]);
    this_high=MathMax(Open[i],Close[i]);
    this_low=MathMin(Open[i],Close[i]);
    }
  //ranges
    //previous range
      double previous_range=prev_high-prev_low;
    //this range
      double this_range=this_high-this_low;
    //and how much they intersect
      double intersect=0.0;
      //we define two points
      //A is the minimum of the 2 highs
        double a=MathMin(prev_high,this_high);
      //B is the maximum of the 2 lows
        double b=MathMax(prev_low,this_low);
      //the intersection is a - b
        intersect=a-b;//this is in points
      //we divide by the previous range if non zero
        if(previous_range>0.0){
        intersect/=previous_range;
        //and we get a value from - infinity to 1.0
          intersect=MathMax(intersect,-1.0);
        //now -1.0 to 1.0 but we adjusted it , so mental note there
          intersect+=1.0;
          intersect/=2.0;
          //and flip so that moving up indicates thinning
            intersect=1.0-intersect;
          //this is the mixed
            mixed[i]=mixed[i+1]-(mixed[i+1]/((double)period))+(intersect/((double)period));
          //if this is similar
            if((Open[i+1]>=Close[i+1]&&Open[i]>=Close[i])||(Open[i+1]<Close[i+1]&&Open[i]<Close[i])){
            similar[i]=similar[i+1]-(similar[i+1]/((double)period))+(intersect/((double)period));
            }
          //if this is opposite
            else{
            opposite[i]=opposite[i+1]-(opposite[i+1]/((double)period))+(intersect/((double)period));
            }
        }

  }
//--- return value of prev_calculated for next call
   return(rates_total);
  }
@Gtrade i played around with it a bit and i got a higher baldness index for usdjpy .
Here is the code i used . The blue line indicates the "baldness" when the bars are the same direction and
the red the "baldness" when the bars are of opposite direction. White is the mixed
This would be problematic in gap scenarios.
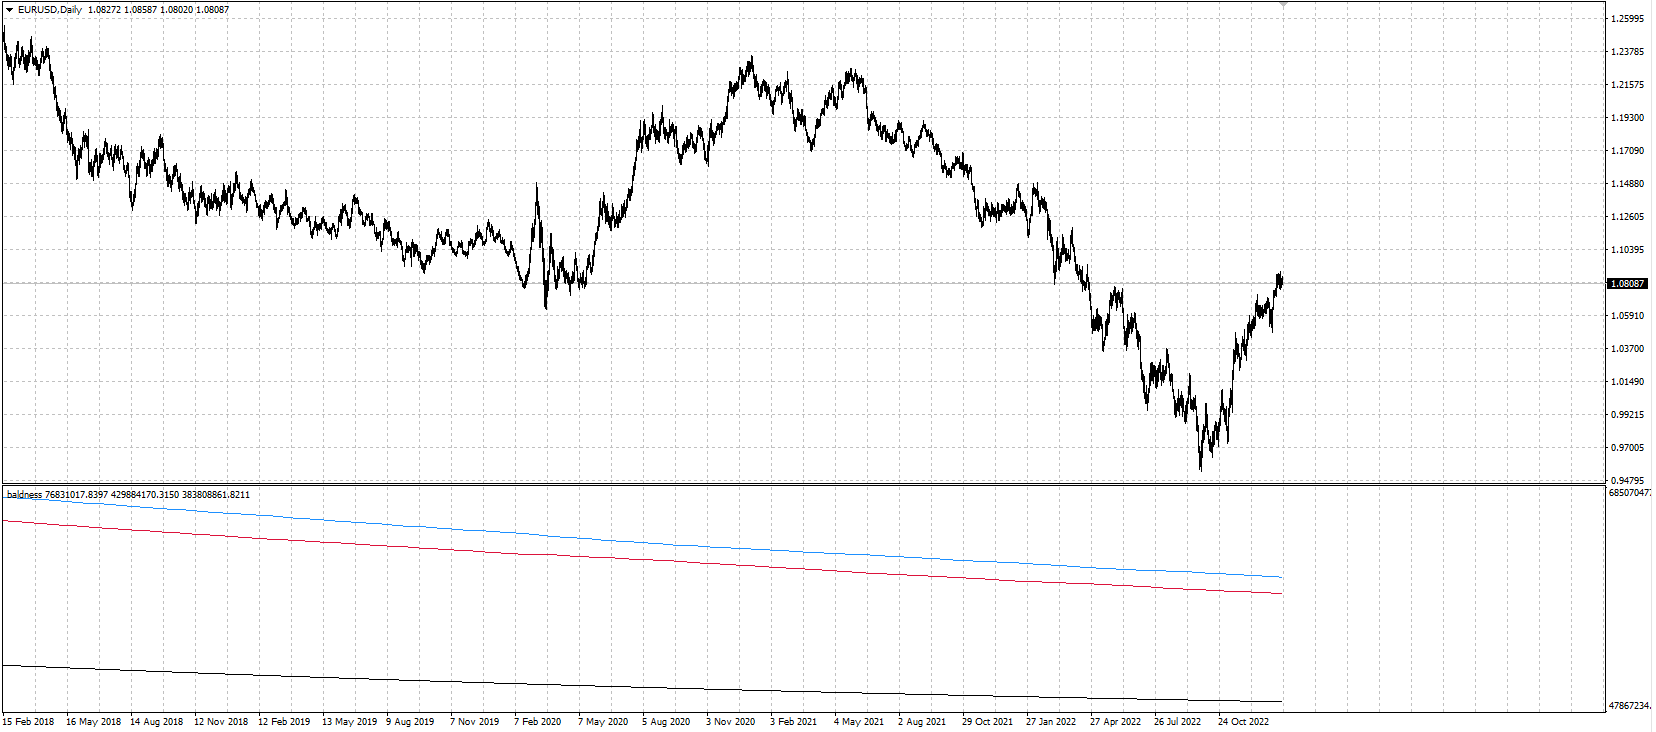
This is awesome, thank you very much, however I'm not sure that it states properly the thinness because it's difficult to say with a period of 14, and if I set 1500 (I have data), it looks like this:
could you fix it? we could do a proper evaluation on longer periods...
This is awesome, thank you very much, however I'm not sure that it states properly the thinness because it's difficult to say with a period of 14, and if I set 1500 (I have data), it looks like this:
could you fix it? we could do a proper evaluation on longer periods...
This is a rolling average so setting it to 1500 will be the average of 1500 at each bar , which means :
It will average the intersection ratios of the 1500 bars including the current one . If we were looking for a be-all-end-all intersection indication it would not be just a higher period we would need to tune it further .
In theory one would need to see how it fares after an event , but that event must be defined , or via comparison of a small period to a big period to get a relative
idea of whether or not the baldness increases or drops . Again within the scope of these two periods .
So what would such an event be ? what did you notice with the thinning ? If we reset when that happens maybe it could be closer to what you have in mind
@Lorentzos Roussos, you are overcomplicating the matter ... just plot the average ratio between [true range] and and the [close-to-close range].
Forum on trading, automated trading systems and testing trading strategies
Trying to find the cause of thinness...
Fernando Carreiro, 2023.01.20 13:57
There is nothing special to evaluate. AUCAD simply has larger bar ranges (is more volatile) in comparison to the overall price movement.
In other words, it has a larger ATR in relation to the average close-to-close price range.
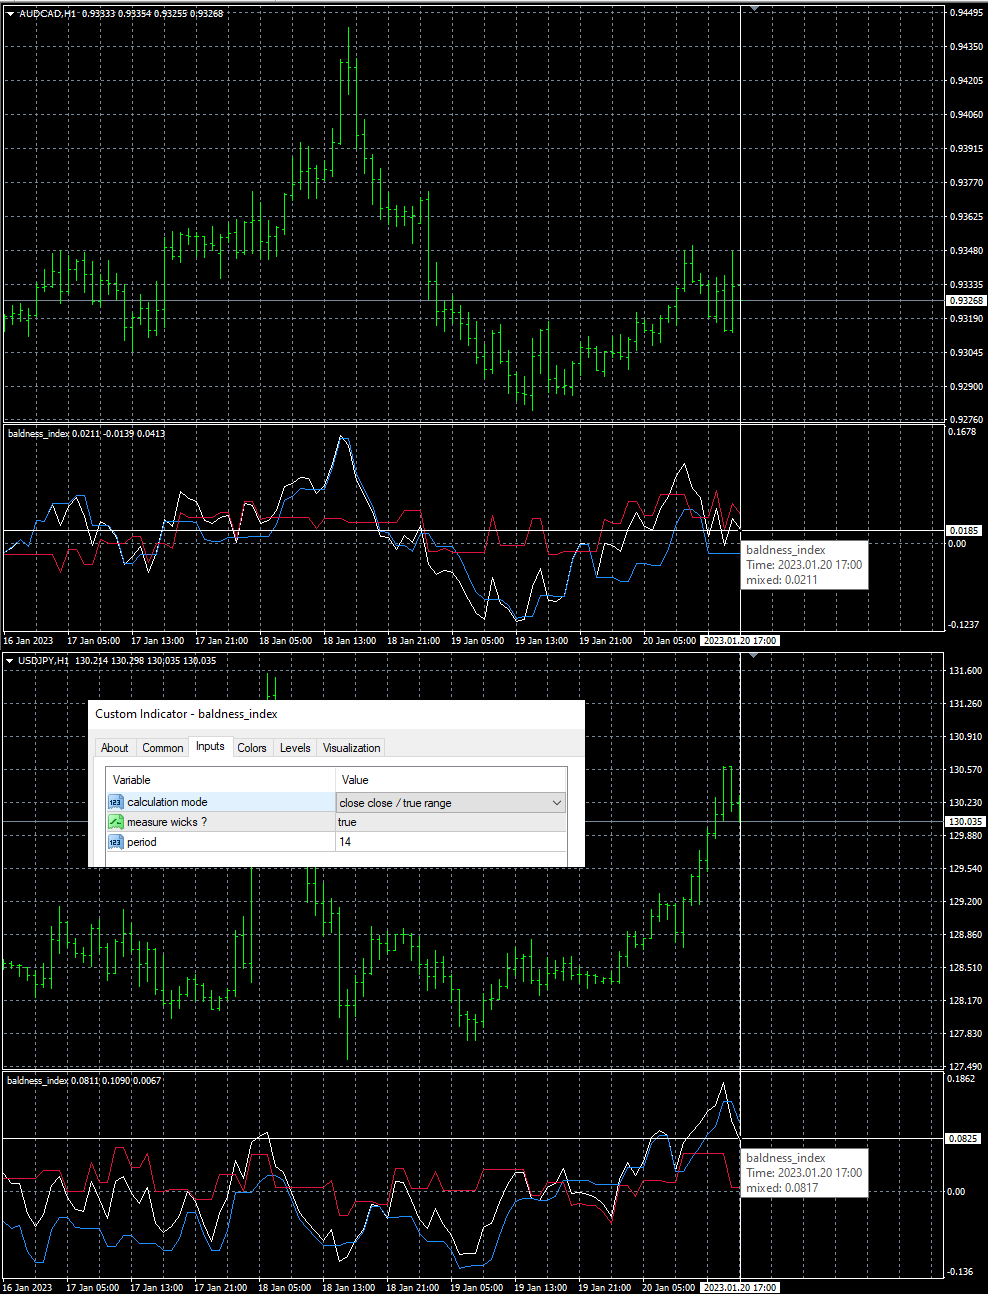
No! It should be " tr / ccr " so that the ratio gets higher as it gets "thicker".
If you use " ccr / tr ", the ratio will become lower as it gets "thicker".
No! It should be " tr / ccr " so that the ratio gets higher as it gets "thicker".
If you use " ccr / tr ", the ratio will become lower as it gets "thicker".
Yeah it measures thinness , up = thinner
This way when the similars is above the opposites and close to the mixed it shows trend picking up , i think- Free trading apps
- Over 8,000 signals for copying
- Economic news for exploring financial markets
You agree to website policy and terms of use
Watch these 2 charts, notice that the USDJPY line (second chart) is thinner than AUDCAD, that is "more black" because it's thicker...I would like to express this feature into a value, but I don't understand what causes this behaviour... I tried many ratios and calculations using volatility, volumes, choppiness formula...nothing, it's difficult to establish a value that states how much a line is thinner. Does someone know what it could be, with relative calculation?