Aussenstab Markttechnik
- 指标
- Alexander Josef Zeidler
- 版本: 1.10
- 更新: 17 二月 2023
- 激活: 5
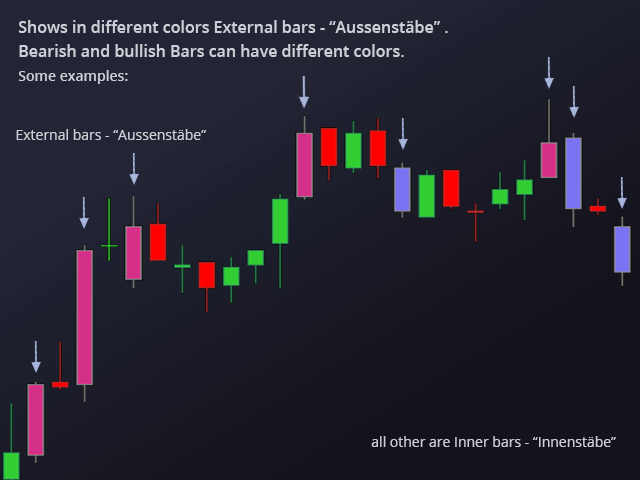
This indicator shows external bars ("Aussenstäbe") in the chart in candle form.
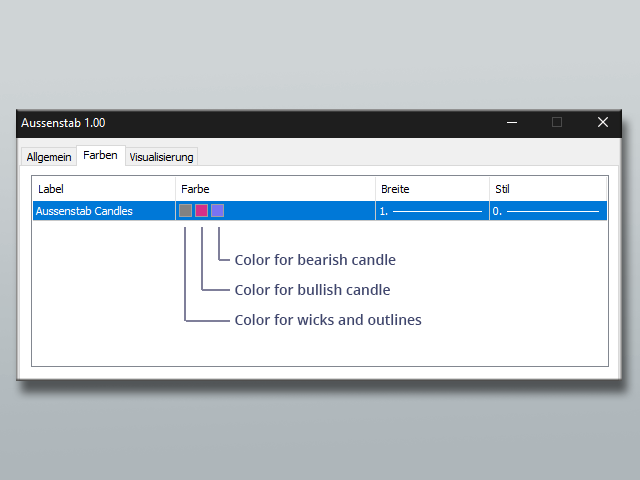
The colors of the candles can be set individually.
Also different colors for bearish and bullish bars are possible.
In addition, the color of the wicks or outlines is also adjustable.
Outside bars are mentioned e.g. by Michael Voigt in the book "Das große Buch der Markttechnik".
All other candles are inner bars.