Aussenstab Markttechnik
- Indikatoren
- Alexander Josef Zeidler
- Version: 1.10
- Aktualisiert: 17 Februar 2023
- Aktivierungen: 5
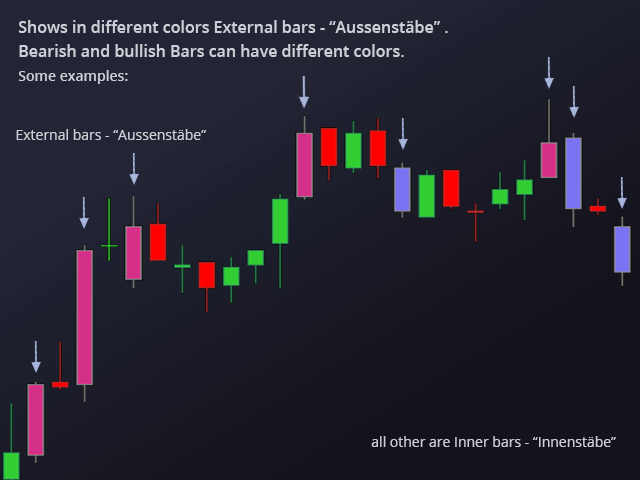
Dieser Indikator zeigt Aussenstäbe (AS) im Chart in Kerzenform.
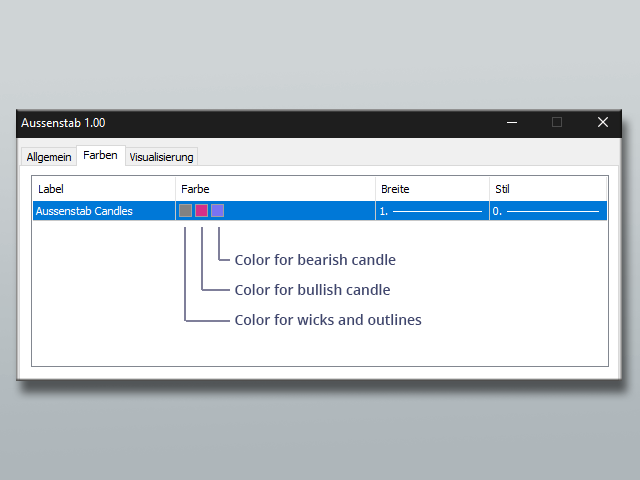
Die Farben der Kerzen können individuell eingestellt werden.
Auch unterschiedliche Farben für bärische und bullische Aussentäbe sind möglich.
Zusätzlich ist auch die Farbe der Dochte bzw. Umrandung einstellbar.
Aussenstäbe werden z.B. von Michael Voigt im Buch "Das große Buch der Markttechnik" erwähnt.
Alle anderen Kerzen sind Innenstäbe.