• 概述
  • 评论 (19)
  • 评论 (4)
  • 新特性

Time Scale for MT5

4.88

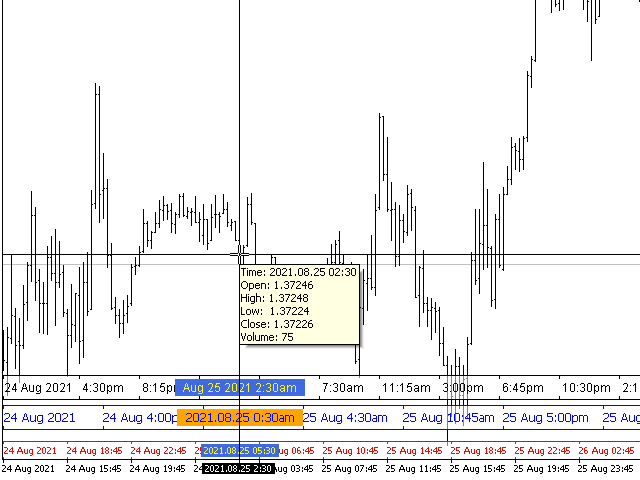
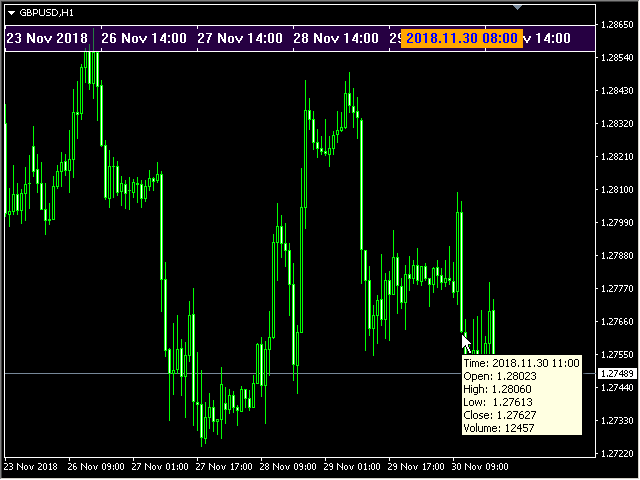
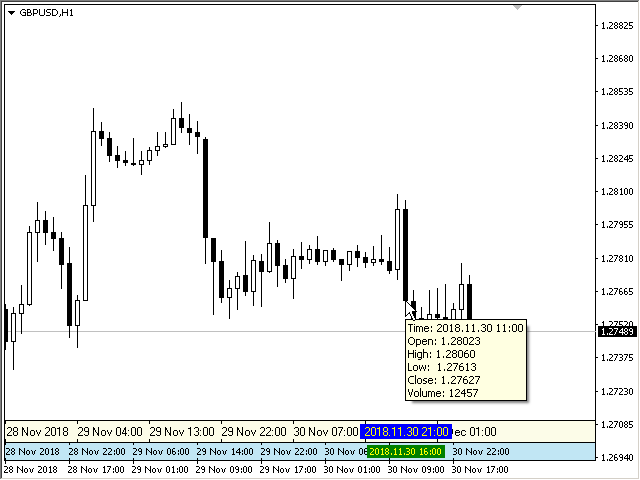
The indicator draws the time scale on the chart. You can specify the time offset, adjust the size and font to display on the chart (it is displaying your local time on your chart instead of MT time). You can also select the desired format for displaying the date and time.

You may be interested in my other product, which contains a more advanced version of the Time Scale.

Parameters

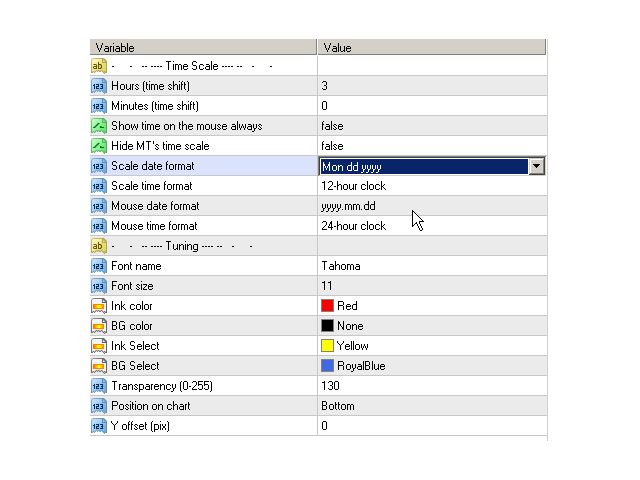
  • Hours (time shift) — time shift (hours);
  • Minutes (time shift) — time shift (minutes);
  • Show time on mouse — show time under the pointer;
  • Precise time scale  — calculate the time between bars;
  • Hide MT's time scale — hide the standard scale;
  • Scale date format — format for the date on the scale;
  • Scale time format — format for time on the scale;
  • Mouse date format — format for the date under the mouse pointer;
  • Mouse time format — format for the time under the mouse pointer;
  • Font name — choose a font;
  • Font size — font size;
  • Ink color — color of the ink of scale;
  • BG color — color of the background of scale;
  • Ink Select — font color for the selected date;
  • BG Select — background color for the selected date;
  • Transparency (0-255) — transparency of the background of the scale;
  • Position on chart — position on the chart;
  • Y offset (pix) — scale shift on the chart vertically.


评论 19
spot007
93
spot007 2024.05.02 06:01 
 

Fantastic product. I really love this. Easy to set up, easy to use. So simple and does exactly what I need. Thank you!

Darvero
97
Darvero 2024.03.26 21:46 
 

Отличный индикатор, спасибо.

nestor jose
28
nestor jose 2024.03.16 17:47 
 

Excelente

推荐产品
This indicator will mirror the assets in use in another metatrader, being able to choose the timeframe and a template. This is the Metatrader 5 Client, it needs the Metatrader 4 or 5 Server versions: Metatrader 4 Mirror Chart Server:   https://www.mql5.com/en/market/product/88644 Metatrader 5 Mirror Chart Server: https://www.mql5.com/en/market/product/88652 Details of how it works in the video.
FREE
DBS Time
Dmitriy Burlachenko
5 (3)
A small utility displays the time in five time zones. You can customize the display of one to five time zones. For each time it is configured: show or not; name; time offset from GMT; color; In general settings, you can change: date / time format ("hh: mi", "hh: mi: ss", "yyyy.mm.dd hh: mi", "yyyy.mm.dd hh: mi: ss") font name; font size; offset from the left edge of the chart; offset from the top edge of the chart;
FREE
Tick Bars
Henrique Helmuth Kreutz Pfeifer
Indicator that show candlestick bars with an different sampling method than time fixed. Real time data is sourced to the indicator and it may be used as substitute of the default graph. Each bar is formed when a predefined amount of ticks is received, showing in the graph the OHLC of this clusteri of ticks. The input variable is the amount of ticks of each bar. It's a different approach of sampling, the amount of bars is proportional to the amount of negotiations insted of a sample in a fixed am
FREE
Timer Countdown
Makarii Gubaydullin
5 (2)
Countdown timer till the bar closure, + % Progress status:  My   #1 Utility :   includes 65+ functions  |   Contact me  if you have any questions In the settings of the indicator, you can configure: Timeframe for Calulculation; true / false:   Higher TimeFrame option (next from the currently used: M15->M30, H4->D1...) Position: 1 = Bottom Left corner; 2 = Bottom Right corner; 3 = Top Left corner; 4 = Top Right corner; Font Size; Color; Font Style;
FREE
外汇计算器是每个交易者必备的程序。 此脚本允许您根据设置的止损点计算存款的百分比风险。 脚本的优点: 在每笔交易中,您始终清楚地知道自己在冒什么风险。 计算器考虑了合同的规格 数据输入风险和止损大小(以点为单位)只有 2 列 Robot Scalper -   https://www.mql5.com/en/market/product/77108 选项 Risk_in_% - 您希望在交易中使用的风险百分比。 Stop_Loss_in_Pips - 以点为单位的估计止损大小。 使用外汇计算器,您可以在开仓前轻松计算风险,信息将显示为一个弹出窗口,指示开仓所需的手数。 这使您可以节省计算时间,并在打开最终交易时确保其打开结果。 您可以将热键附加到脚本,通过按下键盘上的按钮帮助您快速运行脚本。 如果您对脚本有任何疑问,请写在评论或个人消息中。 祝您交易成功且有利可图。
FREE
Introducing a powerful MetaTrader 5 Expert Advisor designed to enhance your trading strategy – the Auto Breakeven EA! This feature-rich EA is tailored to bring your stop-loss to breakeven, ensuring a risk-free trade once the market moves in your favor up to a specified price. Explore the full potential of the Auto Breakeven EA. Download it for free now, and find the download link at the bottom of our page. Elevate your trading experience and take control of your risk management strategy. Happy
FREE
FourierExtrapolationMAFree
Dimitr Trifonov
5 (3)
This is a free version and is forecasting only 5 bars The FourierExtrapolationMAFree indicator transforms and extrapolates the Moving Average function by the Fast Fourier Transformation method. 1. The transformation period is set by two vertical lines, by default the first blue line and the second pink. 2. By default, the Moving Average (MA) line is drawn in red. 3. By Fourier Transform, the indicator builds a model of N harmonics, which is as close as possible to the MA values. The model
FREE
Panda Fractal Symbols
Brian P Cusack
5 (1)
This indicator displays fractal symbols and bars Use this indicator to show different symbols for bearish and bullish fractals: Choose from 144 symbols (refer to table below) Colors, size and offset of fractals can be modified Fractal price bar or candle color can be changed Hide fractals and show fractal price bar only Frequency in fractal calculation can be changed How to use 1. Select which symbols to use for bearish and bullish fractals; 2. Select which colors to use for bearish and bulli
FREE
Indicador de Volume
Edilson Domingos
4.5 (2)
This indicator is a volume indicator it changes the color of the candles according to a certain number of ticks, and this number of ticks can be informed by the user both the number of ticks and the color of the candles, this indicator works in any graphical time or any asset, provided that the asset has a ticker number to be informed. This indicator seeks to facilitate user viewing when analyzing candles with a certain number of ticks.
FREE
Institucional Color Candle
Jean Jacques Huve Ribeiro
4.88 (8)
Idea extracted from the books by Anna Coulling and Gavin Holmes using Volume and Spread Analysis (VSA) techniques coupled with Al Brooks' expertise with Price Action these candles are magical, identify the exact moment   of the performance of the big players are acting in the market represented by the colors: 1) Red Candles we have an Ultra High activity, 2) Candles Orange we have a Very High Activity 3) Candles Yellow we have one High Activity 4) White Candles represent normal activ
FREE
Show Pips for MT5
Roman Podpora
4.61 (18)
This information indicator will be useful for those who always want to be aware of the current situation on the account. - More useful indicators The indicator displays data such as profit in points, percentage and currency, as well as the spread for the current pair and the time until the bar closes on the current timeframe. There are several options for placing the information line on the chart: - To the right of the price (runs behind the price); - As a comment (in the upper left corner
FREE
Gann Swing Chart
Nguyen Duy Trung
This indicator show Gann Swing Chart (One Bar) with multi layer wave. 1. Wave layer   F1: Gann waves are drawn based on candles. SGann wave(Swing of Gann) is drawn based on Gann wave of wave layer   F1. 2. Wave layer F2: Is a Gann wave drawn based on the SGann wave of wave layer F1. SGann waves are drawn based on Gann waves of wave layer   F2. 3. Wave layer F3: Is a Gann wave drawn based on the SGann wave of wave layer F2. SGann waves are drawn based on Gann waves of wave layer   F3. ---------Vi
FREE
The indicator highlights in color the places on the chart where the price moves in one direction continuously from the selected number of candles. You can specify the number of points from the beginning of the movement to select only movements from this amount. It can be useful for looking for reversals or sharp impulses. I also recommend purchasing this utility to determine local weekly / monthly trends and support and resistance lines. https://www.mql5.com/en/market/product/61401
FREE
Volume Candlestick Bars
Henrique Helmuth Kreutz Pfeifer
Indicator that show candlestick bars with an different sampling method than time fixed. Real time data is sourced to the indicator and it may be used as substitute of the default graph. Each bar is formed when a predefined volume of assets was dealt, showing in the graph the OHLC of this clustering. The amount of bars is proportional to the amount of negotiations instead of a sample in a fixed amount of time. If the broker doesn't show the real volume of the trades, this indicator won't work. Th
FREE
Important Lines
Terence Gronowski
4.88 (26)
This indicator displays Pivot-Lines, preday high and low, preday close and the minimum and maximum of the previous hour. You just have to put this single indicator to the chart to have all these important lines, no need to setup many single indicators. Why certain lines are important Preday high and low : These are watched by traders who trade in a daily chart. Very often, if price climbs over or falls under a preday low/high there is an acceleration in buying/selling. It is a breakout out of
FREE
Prop Edge Heartbeat
Nuno Madeira Amaro Pire Costa
5 (1)
EA to prevent inactivity violations on prop firms. This EA will scout for your most recent trade and if it is older than the number of days defined, will enter a micro lot position size 0.01 on the pair defined. It is recommended to use a tight spread pair like EURUSD. This EA will not act as long as you have at least one trade in the last X days (defined on config). This EA will not place other trades or modify existing position.
FREE
MT5 AccountInfoEA
Nikolaos Pantzos
3 (1)
Account Info EA It is a tool that presents on the graph all the positions of the account, and specific information concerning the positions, but also the account. It enables the user to have an image of his account at a glance. Use like any expert advisor. You can't attach it in the same chart with other expert advisor. It does not have the ability to open or manage positions. You can attach it on any chart and any timeframe.
FREE
Expansoes M
Marcus Vinicius Da Silva Miranda
The M Extensions are variations of the Golden Ratio (Fibonacci Sequence). It is the World's first technique developed for Candle Projections. Advantages: Easy to plot. Candle anchoring; High and accurate precision as support and resistance; Excellent Risk x Return ratio; Works in any timeframe; Works in any asset / market.   The M Extensions are classified into: M0: Zero point (starting candle) RC: Initial candle control region M1: Extension region 1 M2: Extension region 2 M3: Extension r
FREE
Period separators
Mykola Demko
4.56 (9)
The Period separators indicator separates time periods, specified by user. It supports all timeframes, greater or aliquot to current timeframe. In case of the incorect timeframe, the indicator modifies it to closest correct value. Additional bonus - the separation of non-standard time periods - MOON, MOON/2, MOON/4 (moon phases). The separators are plotted using the indicator's buffers. The indicator uses one graphic object for information about the progress and current bar properties. The grap
FREE
Gm Volumes
Antonio Augusto Barreto De Melo
4.2 (5)
A simple volume indicator according to the color of the candle! - Custom background! - Supports Volume by Ticks or Real Volume. The original Metatrader Volume indicator does not show the colors of the bar according to the color of the Candle, it only changes color when the volume of a candle is greater than the previous one, this sometimes creates confusion for beginners and does not know the real reason for the color change. Free indicator, support may take a while to respond!
FREE
Understanding the levels of the previous day or week is very important information for your trading. This indicateur allow to draw Previous day High/Low Previous week High/Low Congifuration High & Low for: Previous day, week Line Style, color Label position, size, color Any questions or comments, send me a direct message here  https://www.mql5.com/en/users/mvonline
FREE
神速EA跟单(TradeMirror)是一款MT4/MT5平台的订单复制软件。 为什么选择神速EA跟单 我们深知对于金融软件而言安全、稳定和隐私的重要性,因此我们在细节处对这三大要素进行了额外的加固: 提供用户友好的图形界面,操作简单易用 注重隐私安全,适合对订单分发有隐私要求各种金融场景 精准复制订单,毫秒级分发 支持全平台,MT4/MT5全面覆盖 智能感知系统状态,邮件通知守护交易安全 核心功能列表 对于跟单软件而言,功能并不是越多越好的,因此经过严谨的需求分析,我们对程序进行了精简,并最终保留了如下核心功能: 多重连接 邮件通知 手数缩放 信号过滤 反向跟单 重置止盈/止损 免费演示 在购买Trademirror之前,你总是可以尝试免费演示。 点击本页面上的免费演示按钮 点击是的,我有Metatrader 4/5 允许浏览器打开Mt4/5 在Mt4/5中,找到专家顾问/市场/TradeMirror,打开它并点击测试 启用复盘显示(否则你将看不到GUI界面)。 点击开始 现在你可以在可视化图表上看到TradeMirror的GUI界面 使用建议 感谢您愿意关注并使用神速,针对常见问
FREE
Know the Candle Close Time
Benbyaanda Silvere Henri Sedric Kabore
This indicator allows to know the remaining time before the closing of the candle. It works on every timeframe. It is very usefull when your trading strategy depend of the close or the open of a specific candle. So use it like you want. Don't forget to leave a comment or a request for a EA or an indicator. Also spread it to your friends and don't hesitate to visit my profile to see others tools.
FREE
Introducing the Moving average crossing template which is an Expert advisor template utility for two moving averages for the the cross over strategy where it enters trades based on the crossing of your specified  moving moving averages. You can select the fast moving average and the slow moving average values of your choice. you can choose your preferred trade volume.  you can  choose your preferred number of trades to execute. you can add your stop loss and take profit join my channel for free
FREE
The indicator draws a normal chart by coloring it in colors based on prices calculated by the Heiken Ashi indicator algorithm. That is, the shape of the candles does not change. In fact, this is the same Heiken Ashi that does not distort the price chart. Then there will be a drawing of a cat, because there is nothing more to write about the indicator. .                                                       
FREE
主要城市的时间。北京时间、东京时间、悉尼时间、惠灵顿时间、纽约时间、法兰克福时间、伦敦时间、迪拜时间。 城市时间可选择开启或者关闭。 点差变色提醒。设置点差提醒点数,例如,设置100点,点差大于100点,文字会变红色。 Time in major cities. Beijing time, Tokyo time, Sydney time, Wellington time, New York time, Frankfurt time, London time, Dubai time. City time can be turned on or off. Dot difference color change reminder. Set the point difference reminder points. For example, set 100 points. If the point difference is greater than 100 points, the text will turn red.
FREE
Manual Assistant MT5
Igor Kotlyarov
4.67 (3)
Bonus when buying an indicator or an advisor from my list. Write to me in private messages to receive a bonus. Manual Assistant MT5 is a professional manual trading tool that will make your trading fast and comfortable. It is equipped with all the necessary functions that will allow you to open, maintain and close orders and positions with one click. It has a simple and intuitive interface and is suitable for both professionals and beginners. The panel allows you to place buy and sell orders
FREE
Virtual Targets MT5
Hoang Van Dien
4.71 (7)
This indicator is very useful for day traders or short term traders. (MT5 version) No need to calculate the number of pips manually, just look at the chart and you will see the Virtual Take Profit / Virtual Stop Loss target line and evaluate whether the entry point is feasible to reach the intended target or not. Enter the intended   Take Profit / Stop Loss   pips for your trade. The indicator will display   Virtual Take Profit / Virtual Stop Loss   lines for you to easily see if the target i
FREE
DeHistoryView
Ebdallh Aljlwaxh
The DeHistoryView tool is designed to visualize the trades history and its information, such as the entry and exit points, sizes of the trades, Reward to risk ratio, Risk percent, Profit, Target and stop-loss on the chart. it makes showing trades history on the chart more informative and easier to use. it's a strategic tool that enhances your trading experience on MT5 platforms. By providing a clear visual representation of your trading history and customizable settings, it empowers traders to m
FREE
HMA Color with Alerts MT5
Pavel Zamoshnikov
4.73 (51)
Hull Moving Average (HMA) is well-deservedly popular among traders because of the effective averaging of market noise and a relatively small delay. The current MetaTrader 5 version changes its color when the movement direction changes. Sound and text signals are available. It also supports sending email and push messages. It is possible to trigger a signal on the current incomplete bar, although such a signal may be canceled before completion if conditions are no longer appropriate. One of the p
FREE
该产品的买家也购买
Atomic Analyst MT5
Issam Kassas
5 (13)
首先值得强调的是,该交易指标是非重绘、非延迟的指标,这使其成为手动和机器人交易的理想选择。 用户手册:设置、输入和策略。 Atomic Analyst是一种PA价格行动指标,利用价格的力量和动量来寻找市场上更好的机会。配备了高级过滤器,可帮助去除噪音和假信号,并提高交易潜力。使用多层复杂的指标,Atomic Analyst扫描图表,并将复杂的数学计算转化为任何初学者都能理解并用来做出一致交易决策的简单信号和颜色。 “Atomic Analyst”是专为新手和经验丰富的交易者量身定制的综合交易解决方案。它将高级指标和一流功能融合为一体的交易策略,使其成为所有类型交易者的多功能选择。 日内交易和剥头皮策略:专为快速准确的日内交易和短期交易而设计。 日内和摆动交易策略:可用作追求价格大幅波动的日内和摆动交易者的可靠工具。 多货币和市场:凭借其可靠的精度,在不同的工具和市场上运作。 多个时间框架:可在多个时间框架上使用,性能良好。 稳定性:所有指标均不重绘、不重绘和不滞后,确保可靠的信号。 信号清晰度:提供箭头信号,用于清晰的入场和出场点。 实时警报:通过交易入场、SL和TP警报通知交
首先,值得强调的是,这个交易系统是一个非重绘、非重画和非滞后的指标,这使得它非常适合手动和机器人交易。 在线课程,手册和下载预设。 “智能趋势交易系统 MT5”是专为新手和经验丰富的交易者量身定制的综合交易解决方案。它结合了超过 10 个优质指标,具有 7 多个强大的交易策略,使其成为适用于各种市场条件的多功能选择。 趋势跟随策略:提供精确的入场和止损管理,以有效地跟随趋势。 反转策略:识别潜在的趋势反转,使交易者能够利用区域市场的机会。 剃头策略:专为快速准确的日内交易和短期交易而设计。 稳定性:所有指标都不会重绘、不会重画和不会滞后,确保可靠的信号。 定制:支持自定义策略,以满足个人交易偏好。超过 7 种策略和组合可帮助您找到最佳策略。 信号清晰度:提供箭头信号,以指示清晰的入场和退出点。 实时警报:通过交易进出警报使交易者保持了解。 深入分析:提供更高时间框架的趋势分析和实时交易监控。 自适应颜色编码:利用蜡烛颜色编码来显示成交量、趋势和反转蜡烛信号。通过蜡烛颜色分析市场方向。 “智能趋势交易系统 MT5”赋予交易者必要的工具,以便在各种市场条件下做出明智和战略性的交易决策。无论
TPSpro RFI Levels MT5
Roman Podpora
5 (9)
Reversal First Impulse levels (RFI)      INSTRUCTIONS        RUS       -       ENG              R ecommended to use with an indicator   -   TREND PRO -  Version MT4                 A key element in trading is zones or levels from which decisions to buy or sell a trading instrument are made. Despite attempts by major players to conceal their presence in the market, they inevitably leave traces. Our task was to learn how to identify these traces and interpret them correctly. Main functions:: Di
Gold Stuff mt5
Vasiliy Strukov
4.89 (173)
Gold Stuff mt5 是专为黄金设计的趋势指标,也可用于任何金融工具。 该指标不会重绘,也不会滞后。 推荐时间框架 H1。 购买后立即联系我以获得设置和个人奖励!   设置 绘制箭头 - 打开关闭。 在图表上绘制箭头。 警报 - 打开关闭声音警报。 电子邮件通知 - 打开关闭。 电子邮件通知。 Puch-notification - 打开关闭。 推送通知。 接下来,调整色域。 Gold Stuff mt5 是专为黄金设计的趋势指标,也可用于任何金融工具。 该指标不会重绘,也不会滞后。 推荐时间框架 H1。 购买后立即联系我以获得设置和个人奖励!   设置 绘制箭头 - 打开关闭。 在图表上绘制箭头。 警报 - 打开关闭声音警报。 电子邮件通知 - 打开关闭。 电子邮件通知。 Puch-notification - 打开关闭。 推送通知。 接下来,调整色域。
Quantum Trend Sniper
Bogdan Ion Puscasu
5 (39)
介绍   量子趋势狙击指标 ,突破性的 MQL5 指标,正在改变您识别和交易趋势反转的方式!由拥有超过13年交易经验的资深交易员团队开发,     量子趋势狙击指标   旨在通过其创新的方式以极高的准确度识别趋势反转,将您的交易之旅推向新的高度。 ***购买量子趋势狙击指标,即可免费获得量子突破指标!*** 当量子突破指标识别出趋势反转时,它会向您发出警报和信号箭头,并建议您三个止盈水平。 它既适合新手交易者,也适合专业交易者。 量子 EA 通道:       点击这里 MT4版本:       点击这里 建议: 时间范围: 所有时间范围。为了获得最佳结果,我们建议在 M15、M30 和 H1 时间范围内使用它。 货币对:欧元兑美元、英镑兑美元、澳元兑美元、欧元兑英镑、, EURAUD,  XAUUSD 账户类型:ECN、Raw 或 Razor,点差极低 经纪时间:任意 经纪商:IC Markets、Pepperstone with Raw 和 Razor 的点差最低 建议止损:50 点 建议止盈水平:20 点、50 点和
Trend Screener Pro MT5
STE S.S.COMPANY
4.87 (62)
使用趋势筛选指标释放趋势交易的力量:由模糊逻辑和多货币系统提供支持的终极趋势交易解决方案! 使用趋势筛选器(由模糊逻辑提供支持的革命性趋势指标)提升您的趋势交易。 它是一个强大的趋势跟踪指标,结合了超过 13 种高级工具和功能以及 3 种交易策略,使其成为使您的 Metatrader 成为趋势分析器的多功能选择。 限时优惠:趋势筛选指标终身仅需 50 美元。 ( 原价 125$ ) (优惠延长) 体验趋势筛选器 100% 无需重新绘制的准确性,确保您的交易决策不受过去价格变化的影响。 释放多时间框架和多货币功能的多功能性,使您能够以无与伦比的信心在外汇、商品、加密货币和指数领域进行交易。 利用 Trend Screener 的综合策略套件增强您的交易: - 趋势跟踪策略和趋势延续策略 :趋势筛选器的趋势跟踪策略提供清晰的趋势延续信号,让您有效捕捉趋势走势并管理风险。 - 反转策略和早期入场点策略 :趋势筛选器的反转策略可检测市场方向的潜在变化,使您能够预测趋势反转并利用疲弱的市场趋势。通过早期入场点,您可以在潜在的趋势变化之前定位自己 获取可观的利润。 - 倒卖策略: 趋势筛选器的倒卖
RelicusRoad Pro MT5
Relicus LLC
4.82 (22)
现在$ 147(更新后增加到$ 499) - 无限帐户(PC或Mac) RelicusRoad 用户手册 + 培训视频 + 访问 Private Discord Group + VIP 身份 一种看待市场的新方式 RelicusRoad 是世界上最强大的外汇、期货、加密货币、股票和指数交易指标,为交易者提供保持盈利所需的所有信息和工具。我们提供技术分析和交易计划,帮助每一位交易者取得成功,从初学者到高级。它是一个关键的交易指标,可以提供足够的信息来预测未来的市场。我们相信一个完整的解决方案,而不是图表上几个没有意义的不同指标。这是一个多合一指标,显示无与伦比且非常准确的信号、箭头 + 价格行为信息。 RelicusRoad 基于强大的人工智能,提供缺失的信息和工具来教育您并使您成为交易专家,成为成功的交易者。 几乎所有技术指标都滞后,这意味着它们只能报告已经发生的事情。因此,他们只确认您过去可以看到的价格已经在哪里。我们相信领先指标可以预测未来价格,而无需重新绘制,也不要过度依赖可能改变并导致重新绘制的滞后指标。如果您根据滞后指标进行交易并建立头寸,您就知道您已
IVISTscalp5
Vadym Zhukovskyi
5 (3)
我们向您介绍iVISTscalp5指标,它不仅独特,而且在交易操作中也非常有效。该指标基于时间数据,是多年金融市场经验和深入分析的结果。iVISTscalp5指标是手动交易的优秀工具。便利性、简单性和可视化 - 所有的复杂性都隐藏在内部。我们将iVISTscalp5指标的设置和使用简化到了最大程度。该指标适用于MT5终端中您所拥有的所有金融工具。 操作时间为UTC+3的早上4点到晚上8点。 iVISTscalp5指标菜单(见截图1): History - 计算行情的周数 dT_min - 选择时间间隔的时间(分钟) TFline - 绘制水平成交量(时间帧) BARSline - 绘制水平成交量(条数) TFtrend1 - 绘制日线通道(时间帧) BARStrend1 - 绘制日线通道(条数) TFtrend2 - 绘制周线通道(时间帧) BARStrend2 - 绘制周线通道(条数) ALERT_TIMER - 设置闹钟 ALERT - 开启/关闭闹钟 Save - 开启/关闭将时间记录到文本文件。 图表上的红色和蓝色旗帜表示时间(VIST智能剃须系统的信号)。卖出信号为红旗,买入
FX Volume MT5
Daniel Stein
4.94 (17)
通过 mql5 和 Telegram 上 的 " 晨间简报 "获取每日市场更新,包括详细信息和屏幕截图 ! 外汇交易量(FX Volume)是第一个也是唯一一个从经纪商角度真正洞察市场情绪的交易量指标。 直接在您的图表上看到这些信息是真正改变游戏规则和突破性的交易解决方案。 受益于独特的市场数据洞察,如 比率(Ratios )显示货币多头和空头头寸的比率(百分比 比率变化 显示所选时间段内的多头比率及其百分比变化 总交易量 显示货币的总交易量(多头和空头),以手为单位 多头 交易量显示货币所有多头头寸的交易量 空头 交易量显示所有货币空头头寸的交易量 净多头 显示净多头交易量,即所有多头头寸减去所有空头头寸(以手为单位)。 净多头百分比 显示货币净多头交易量的变化 请阅读我们的基本教程 -> "如何使用外汇交易量进行交易 " 获取更多信息,如常见问题、交易技巧和教程视频,请访问我们的 外汇交易量公共信息频道 请 安装并运行 SI Connect 以建立与我们数据中心的持续连接 背景信息 我们都知道,外汇是一个分散的市场。这就是为什么我们必须打破常规思维,开发一个独
Bill Williams Advanced
Siarhei Vashchylka
5 (5)
Bill Williams Advanced is designed for automatic chart analysis using Bill Williams' "Profitunity" system. The indicator analyzes four timeframes at once. Manual (Be sure to read before purchasing) Advantages 1. Automatically analyzes the chart using the "Profitunity" system of Bill Williams. The found signals are placed in a table in the corner of the screen. 2. Equipped with a trend filter based on the Alligator indicator. Most of the system signals are recommended to be used only accordi
首先,值得强调的是,这个交易工具是非重绘、非重画和非滞后的指标,非常适合专业交易。 在线课程,用户手册和演示。 智能价格行动概念指标是一个非常强大的工具,既适用于新手,也适用于经验丰富的交易者。它将超过20个有用的指标合并到一个指标中,结合了高级交易思想,如内圈交易员分析和智能资金概念交易策略。该指标侧重于智能资金概念,提供有关大型机构交易方式的见解,帮助预测它们的动向。 它在流动性分析方面尤其擅长,有助于理解机构的交易方式。它擅长预测市场趋势,并仔细分析价格波动。通过将您的交易与机构策略对齐,您可以更准确地预测市场走向。该指标多才多艺,擅长分析市场结构,识别重要的订单区块,并识别各种模式。 它擅长识别BOS和CHoCH等模式,理解动量的转变,并突出显示供需强劲的关键区域。它还擅长发现强大的不平衡,并分析价格创造更高高点或更低低点的模式。如果您使用斐波那契回撤工具,该指标可以满足您的需求。它还可以识别相等的高点和低点,分析不同的时间框架,并通过仪表板显示数据。 对于使用更高级策略的交易者,该指标提供了工具,如公平价值差指标和优惠和折扣区域的识别。它特别关注高时间框架订单
ICT, SMC, SMART MONEY CONCEPTS, SMART MONEY, Smart Money Concept, Support and Resistance, Trend Analysis, Price Action, Market Structure, Order Blocks, BOS/CHoCH,   Breaker Blocks ,  Momentum Shift,   Supply&Demand Zone/Order Blocks , Strong Imbalance,   HH/LL/HL/LH,    Fair Value Gap, FVG,  Premium  &   Discount   Zones, Fibonacci Retracement, OTE, Buy Side Liquidity, Sell Side Liquidity, BSL/SSL Taken, Equal Highs & Lows, MTF Dashboard, Multiple Time Frame, BigBar, HTF OB, HTF Market Structure
Dragon Multi Indicator MT5
Mansour Babasafary
5 (3)
74% discount for the next 10 buyers (original price $605): 1 left Get a 50% bonus by buying (or even renting) any of our products. After buying (or renting), send a message for more information. 3 Indicators in 1 indicator Strategy based on price action Made specifically for the best forex currency pairs Can be used in the best time frame of the market at a very reasonable price This indicator is basically 3 different indicatos . But we have combined these 3 indicators in 1 indicator so th
AW Trend Predictor MT5
AW Trading Software Limited
4.77 (56)
一个系统中趋势和故障水平的组合。先进的指标算法过滤市场噪音,确定趋势、进入点以及可能的退出水平。指标信号记录在统计模块中,您可以选择最合适的工具,显示信号历史的有效性。该指标计算获利和止损标记。 手册和说明 ->   这里 / MT4 版本 ->   这里 如何使用指标进行交易: 使用趋势预测器进行交易只需三个简单的步骤: 第 1 步 - 开仓 收到买入信号,成功率超过 70% 第 2 步 - 确定止损 通过相反的信号选择中继线 第 3 步 - 定义止盈策略 策略一:达到 TP1 时平仓 策略 2:达到 TP1 时平仓 50%,达到 TP2 时平仓剩余 50% 策略三:在趋势反转时平仓 好处: 从不重绘结果,信号严格位于蜡烛收盘时 它可以在顾问中使用 获利和止损标记 对交易策略或独立策略的重要补充 市场噪音过滤算法 适用于任何工具 统计模块: 为了更好地选择配对,请使用内置的统计计算。 计算交易 - 给出统计数据的信号总数 成功评级 - 达到 TP1 的信号百分比,或反转那些正获利的信号时的百分比 TakeProfit1 Hit - 达到 TP1 的信号百分比 TakeProfit2
Blahtech Market Profile MT5
Blahtech Limited
5 (8)
Was: $249  Now: $99   Market Profile defines a number of day types that can help the trader to determine market behaviour. A key feature is the Value Area, representing the range of price action where 70% of trading took place. Understanding the Value Area can give traders valuable insight into market direction and establish the higher odds trade. It is an excellent addition to any system you may be using. Inspired by Jim Dalton’s book “Mind Over Markets”, this indicator is designed to suit the
Advanced Supply Demand MT5
Bernhard Schweigert
4.53 (15)
任何新手或专业交易者的最佳解决方案! 该指标是一款独特、高质量、且价格合理的交易工具,因为我们已经整合了许多专有功能和新公式。 依据此更新,您将能够显示双重时间帧区域。 您不仅可以显示一个较高的时间帧,还可以同时显示图表时间帧,加上更高的时间帧:显示嵌套时区。 供需双方所有交易者都会喜欢它。 :) 重要信息披露 高级供需的最大潜力,请访问 https://www.mql5.com/zh/blogs/post/720245   想象您的交易如何得以改善,是因为您能够精准定位入场或目标位吗? 构建于新的底层算法,它可以更轻松地识别出买卖双方之间的潜在失衡。 这是因为它以图形方式展示供需最强劲区域,及其过去的表现(显示旧区域)。 这些功能旨在帮助您更轻松地发现最佳入场区域和价位。 现在您可以针对您的交易品种和时间帧来优化和编辑区域强度! 高级供需指标适用于所有产品和时间帧。 它是一个新的公式,非常新的功能是两个区域强度函数可由用户输入进行调整! 这在交易中是一大优势。 当您学习如何使用专有功能,例如带有价格游离最小 X 因子的区域强度时,您能够判断该区域强劲与否。 供需区域用作警报触发器
FxaccurateLS
Shiv Raj Kumawat
WHY IS OUR FXACCCURATE LS MT5 THE PROFITABLE ? PROTECT YOUR CAPITAL WITH RISK MANAGEMENT Gives entry, stop and target levels from time to time. It finds Trading opportunities by analyzing what the price is doing during established trends. POWERFUL INDICATOR FOR A RELIABLE STRATEGIES We have made these indicators with a lot of years of hard work. It is made at a very advanced level. Established trends provide dozens of trading opportunities, but most trend indicators completely ignore them!
介绍     Quantum Breakout PRO   ,突破性的 MQL5 指标,正在改变您交易突破区域的方式!由拥有超过13年交易经验的资深交易员团队开发,     量子突破 PRO     旨在通过其创新和动态的突破区域策略将您的交易之旅推向新的高度。 量子突破指标将为您提供带有 5 个利润目标区域的突破区域的信号箭头,以及基于突破框的止损建议。 它既适合新手交易者,也适合专业交易者。 量子 EA 通道:       点击这里 重要的!购买后请私信我领取安装手册。 建议: 时间范围:M15 货币对:GBPJPY、EURJPY、USDJPY、NZDUSD、XAUUSD 账户类型:ECN、Raw 或 Razor,点差极低 经纪商时间:GMT +3 经纪商:IC Markets、Pepperstone with Raw 和 Razor 的点差最低 规格: 不重漆! 最多 5 个建议利润目标区域 建议止损水平 可定制的盒子。您可以设置自己的 Box Time Start 和 Box Time End。 接触 如果您有任何疑问或需要帮
IX Power MT5
Daniel Stein
5 (3)
IX Power 终于将 FX Power 的无与伦比的精确性带到了非外汇交易符号中。 它能准确判断您喜爱的指数、股票、商品、ETF 甚至加密货币的短期、中期和长期趋势强度。 您可以 分析 终端提供的 一切 。试试吧,体验一下您在交易时如何把握 时机 。 IX Power 主要功能 100% 精确的非重绘计算结果 - 适用于您终端中的所有交易符号 下拉式选择预配置以及可单独配置的强度分析周期 通过电子邮件、消息和手机通知的无数种通知选项 可访问的 EA 请求缓冲区 可自定义计算限制,以获得更好的性能 为希望查看更多信息的用户提供特殊的多实例设置 无尽的图形设置,让您在每个图表中都能找到最喜欢的颜色 采用 Windows 11 和 macOS 风格的圆角新面板设计 神奇的移动指标面板,可在子窗口和主图表之间无缝移动 适用于高分辨率 QHD、UHD 和 4K 显示器,并针对平板电脑和触摸屏进行了优化 IX Power 参数 最重要的参数不言自明,但我们很快会在另一篇文章中为您提供所有 IX Power 参数的完整说明。 使用别名 "参数可为技术交易符号
Gartley Hunter Multi
Siarhei Vashchylka
5 (6)
Gartley Hunter Multi - An indicator for searching for harmonic patterns simultaneously on dozens of trading instruments and on all classic timeframes: (m1, m5, m15, m30, H1, H4, D1, Wk, Mn). Manual (Be sure to read before purchasing) | Version for MT4 Advantages 1. Patterns: Gartley, Butterfly, Shark, Crab. Bat, Alternate Bat, Deep Crab, Cypher 2. Simultaneous search for patterns on dozens of trading instruments and on all classic timeframes 3. Search for patterns of all possible sizes. Fr
Black Dragon indicator mt5
Ramil Minniakhmetov
4.83 (58)
趋势检测指标将补充任何策略,也可用作独立工具。   好处 易于使用,不会因不必要的信息而使图表过载; 可用作任何策略的过滤器; 具有内置的动态支撑和阻力水平,可用于获利和设置止损; 指标在烛台关闭后不会改变颜色;  适用于股票市场、指数、石油、黄金和所有时间范围; 具有吐司通知、邮件通知、推送通知和声音提醒功能。 我的其他开发可以在这里找到: https://www.mql5.com/zh/users/mechanic/seller 输入参数 Alert - 开/关。警报; Push Notification - 开/关。推送通知; Mail - 开/关电子邮件通知; Fibo 1,2,3,4,5,6,7,11,21,31,41,51,61,71 - 动态支撑和阻力位的设置。
ADR 反轉指標一目了然地顯示當前價格相對於其正常平均每日範圍的交易位置。當價格超過您選擇的平均範圍和高於它的水平時,您將通過彈出窗口、電子郵件或推送獲得即時警報,以便您可以快速跳入回調和反轉。該指標在圖表上在平均每日範圍極值處繪製水平線,並在這些水平之上延伸,這些水平附加了價格超過它們的數學概率。下面的更多細節...... ADR 警報儀表板補充指標並監控所有配對也可在此處獲得: https://www.mql5.com/en/market/product/66316 MT4 版本也可在此處獲得: https://www.mql5.com/en/market/product/62757 大約 60% 的時間價格在其正常的平均每日範圍 (ADR) 內交易並推高這些水平通常是價格急劇波動的指標,通常會出現回調(獲利了結)走勢。您可以通過交易從每日範圍的頂部或底部回落到最近的支撐位或阻力位來利用這些急劇波動。 收集了超過 20 年的歷史數據,以找出主要外匯對和一系列交叉盤的價格超出特定 ADR 水平的平均百分比。該數據表明價格僅在 3% 的時間內超過其 ADR 的 200%,
Blahtech Supply Demand MT5
Blahtech Limited
4.57 (14)
Was: $299  Now: $99   Supply Demand uses previous price action to identify potential imbalances between buyers and sellers. The key is to identify the better odds zones, not just the untouched ones. Blahtech Supply Demand indicator delivers functionality previously unavailable on any trading platform. This 4-in-1 indicator not only highlights the higher probability zones using a multi-criteria strength engine, but also combines it with multi-timeframe trend analysis, previously confirmed swings
Golden Gate Algo MT5
James David Lane
4 (6)
40% 圣诞优惠!价格将于1月1日涨至$250! 推出GoldenGate Entries:前沿交易解决方案! 发现与GoldenGate Entries(GGE)一同进行交易的革命性方法,这是一款设计用于提升您交易体验的先进指标。GGE提供了一套全面的功能,以赋予用户在交易决策中的精准和信心。 交易对:任意(外汇 - 商品 - 股票 - 股票 - 加密货币) 时间框架:15分钟至H1 主要特点: 买入和卖出箭头指示:接收伴随弹出警报的买入和卖出箭头指示,确保您随时保持了解。 GoldenGate_Algo:通过GoldenGate_Algo深入了解市场状况,这是一款强大的工具,用于评估市场是否处于“超卖”或“超买”状态。 当前趋势分析:通过访问您正在查看的时间框架上的当前趋势,保持领先地位,使您能够将交易与市场当前方向对齐。 内置枢轴点:使用内置的枢轴点轻松识别关键市场点,提供有价值的支撑和阻力水平。 蜡烛扫描器:分析蜡烛形态和图案,找到最佳的入场点并过滤掉低概率的入场。 完全定制:通过完整的定制选项,完全掌控您的交易体验,允许您个性化从
Auto Order Block with break of structure based on ICT and Smart Money Concepts (SMC) Futures Break of Structure ( BoS )             Order block ( OB )            Higher time frame Order block / Point of Interest ( POI )    shown on current chart           Fair value Gap ( FVG ) / Imbalance   -  MTF      ( Multi Time Frame )    HH/LL/HL/LH  -  MTF      ( Multi Time Frame )  Choch  MTF      ( Multi Time Frame )  Volume Imbalance     ,  MTF          vIMB Gap’s Equal High / Low’s     ,
Quantum Heiken Ashi PRO MT5
Bogdan Ion Puscasu
4.5 (8)
Quantum Heiken Ashi PRO 简介 Heiken Ashi 蜡烛旨在提供对市场趋势的清晰洞察,以其过滤噪音和消除虚假信号的能力而闻名。告别令人困惑的价格波动,迎接更流畅、更可靠的图表表示。 Quantum Heiken Ashi PRO 的真正独特之处在于其创新公式,它将传统烛台数据转换为易于阅读的彩色条。红色和绿色条分别优雅地突出了看跌和看涨趋势,让您能够以非凡的精度发现潜在的进入和退出点。 量子 EA 通道:       点击这里 MT4版本:       点击这里 这一卓越的指标具有以下几个关键优势: 增强清晰度:通过平滑价格波动,Heiken Ashi 金条可以更清晰地反映市场趋势,使您更容易识别有利的交易机会。 减少噪音:告别经常导致错误信号的不稳定价格变动。 Quantum Heiken Ashi 指标可过滤噪音,使您能够做出更明智的交易决策 无缝集成:Heiken Ashi 指标专为 MetaTrader 开发,可无缝集成到您的交易平台中。它用户友好、高度可定制,并且与您的其他交易指标和过滤器兼容 无论您是寻求新优势的经验丰富的交易者,
自动在你的图表上画出支撑位和阻力位以及推动性蜡烛缺口,这样你就可以看到价格接下来可能会走向哪里和/或可能会逆转。 该指标旨在作为我的网站(The Market Structure Trader)上教授的头寸交易方法的一部分,并显示目标和潜在入场的关键信息。 MT4 Version:  https://www.mql5.com/en/market/product/97246/ 该指标有两个核心功能和四个附加功能: 核心功能1 - 日线、周线和月线的自动支持和阻力线 该指标为你自动绘制过去2天以及6周和数月前的最新支撑和阻力水平。你可以完全自定义这些水平的外观以适合你,并显示多少个。这些关键水平通常作为主要的支持和阻力区,价格将从这里转向并回撤或逆转。它们也是价格将走向的目标,因此你可以迅速看到在价格可能转向之前交易的潜在距离。 核心特征2--推进型蜡烛缺口目标 推进性缺口蜡烛是银行和机构通过在任何市场上执行大额头寸而创造的强劲、快速的移动。这些大阳线一旦形成,有两个关键作用。 1. 1.它们作为一个方向性信号,因为大型市场参与者已经选择了一个方向,一旦发生,价格往往会在一段
Trend Line Map Pro MT5
STE S.S.COMPANY
4.67 (9)
趋势线图指标是趋势筛选器指标的插件。它用作趋势筛选器(趋势线信号)生成的所有信号的扫描仪。 它是基于趋势筛选器指标的趋势线扫描仪。如果您没有 Trend Screener Pro Indicator,Trend Line Map Pro 将无法使用。 It's a Trend Line Scanner based on Trend Screener Indicator. If you don't have Trend Screener Pro Indicator,     the Trend Line Map Pro will not work . 通过访问我们的 MQL5 博客,您可以下载趋势线图指标的免费版本。购买前试用,不受 Metatrader Tester 限制。 :  点击这里 1. 容易获得的优势 根据货币和时间范围显示买入和卖出信号。 评估自图表中出现箭头以来价格上涨或下跌的点数。 (趋势筛选指标箭头) 显示信号的时序。 获取多时间范围和多货币警报以购买和出售警报。 2. 如何使用趋势线图 如何显示买卖信号仪表板? 如果您有任何问题或需
FX Power MT5 NG
Daniel Stein
5 (5)
通过 mql5 和 Telegram 上 的晨间简报获取每日市场更新,包括详细信息和屏幕截图 ! FX Power MT5 NG 是我们长期以来非常受欢迎的货币强度计算器 FX Power 的下一代产品。 这款下一代强度计算器能提供什么?您所喜爱的原版 FX Power 的所有功能 附加功能 黄金/XAU 强度分析 更精确的计算结果 可单独配置的分析周期 可自定义计算限制,以获得更好的性能 为希望查看更多信息的用户提供特殊的多实例设置 无尽的图形设置,可在每个图表中设置您最喜欢的颜色 无数的通知选项,让您再也不会错过任何重要信息 采用 Windows 11 和 macOS 风格的全新圆角设计 神奇的移动指标面板 FX Power 主要功能 所有主要货币的完整强势历史 所有时间框架内的货币强弱历史 所有经纪商和图表的计算结果完全相同 100% 可靠的实时计算 -> 无重绘 可通过下拉列表选择分析时段 通过自定义模式单独配置分析时段 可在一个图表中使用多个实例 可移动 FX Power 显示屏(通过拖放) 适用于高分辨率 QHD、UHD 和 4K 显示器 自动终端配置 针对平板电脑
作者的更多信息
ZigZag Lines MTF for MT5
Taras Slobodyanik
5 (7)
多时间框架锯齿形调整浪指标。 它显示支撑/阻力水平线及其突破,并绘制当前的市场目标。 它还可以显示分形指标的线条和其他时期(最多季度)的蜡烛。 该指标重新绘制最后一个(当前)点,并且在某些情况下可以更改最后 2-3 个点。 所有线条均绘制为对象(不是指标缓冲区,但有可能接收 EA 的数据)。 在 Expert Advisor 中使用时,您可以使用 iCustom 读取 ZigZag 点。 设置 Mode — 根据以下因素绘制支撑位和阻力位: —  Zig Zag — ZigZag 指标; —  ZigZag Close — 之字折线收盘指标; —  Fractals — 分形指标; —  High-Low of the period — 通过高低水平构建指标。 时间范围在Period参数中指定; —  Candles only — 仅绘制蜡烛; Depth — 如果最后一根蜡烛的偏差小于(或大于)前一根,则 Zigzag 将不会绘制第二个最大值(或最小值)的烛台的最小数量; Deviation — 锯齿形形成局部顶部/底部的两个相邻烛台的最高点/最低点之间的最小点数; B
Symbol Manager for MT5
Taras Slobodyanik
5 (1)
Symbol Manager or Grid Manager, designed to group orders into one position (by symbol and by direction). This utility will be useful to multi-currency traders, who can have multiple orders on several pairs. You will be able to see the total number of lots, the total profit, and set virtual stop loss and virtual take profit. To set a real TP (or SL), you must first set the virtual value, and then enter the command in this cell: "set". If you want to set real TP/SL for all orders at once, then en
该仪表板显示来自三个来源的当前新闻:来自 ForexFactory.com 网站(FFC 日历)、来自 Investing.com 网站和来自 mql5.com 的经济日历。 您可以按影响力和国家对新闻进行排序,并一键将其显示在图表上。 通过按住“Ctrl”键,您可以选择几种不同的“货币”或“影响”进行排序。 此外,该实用程序不仅显示预测,还显示它们出现在网站上后的实际值。 您可以为每条新闻设置单独的通知。 来自 mql5.com 的新闻,采用您的 MT5 语言。 您可以使用 EA 或指标来阅读新闻。 更多详情请参阅评论中的描述。 EA 可以在新闻发布前关闭市场头寸和挂单,将止损移至盈亏平衡点并在当天结束时平仓。 另外,在评论中,您可以找到一个脚本,该脚本可以从仪表板读取新闻,并通过单击“Algo Trading”按钮停止所有 EA 的交易。 该程序从互联网获取信息,因此您需要在终端设置中启用对 ForexFactory 和 Investing.com 网站的访问。 按“ctrl+O”、“Expert Advisors”、“Allow WebRequest”,然后将链接复
随机振荡器的多货币和多时间框架修改。 您可以在参数中指定任何所需的货币和时间范围。 该面板显示当前值和线的交点 - 信号线和主线(随机交叉)。 此外,该指标还可以在跨越超买和超卖水平时发送通知。 通过单击带有句点的单元格,将打开该符号和句点。 这是 MTF 扫描仪。 默认情况下,从图表中隐藏仪表板的键是“D”。 参数 %K Period — K 线的周期。 %D Period — D 线的周期。 Slowing — 放慢; Method — 平均法; Price field — 价格类型。 Line of indicator — 线索引。 Clear the chart at startup — 启动时清除图表。 Set of Pairs — 符号集: — Market Watch — 来自“市场观察”的配对。 — Specified manually — 在参数“Pairs”中手动指定对。 — Current pair  — 仅显示当前对。 Pairs (separated by a space or semicolon) — 由空格或分号分隔的符号列表。 货币名称的书
MA Dashboard
Taras Slobodyanik
4.5 (2)
移动平均线 (MA) 指标的多货币和多时间范围修改。 在仪表板上,您可以看到指标的当前状态 - 快速 MA 和慢速 MA 的突破和触及(按价格),以及 MA 线彼此之间的交叉点(移动平均线交叉)。 在参数中,您可以指定任何所需的货币和时间范围。 此外,该指标还可以发送有关价格触及线及其交叉的通知。 通过单击带有句点的单元格,将打开该符号和句点。 这是 MTF 扫描仪。您可以在图表上运行多个仪表板。 该指标在当前图表上显示快速 MA 线和慢速 MA 线。 您可以为图表选择 MA 时间范围并从其他时间范围观察 MA (MTF MA)。 两组MA的热键默认为“1”和“2”。 默认情况下,从图表中隐藏仪表板的键是“D”。 参数 Fast MA — 快速MA Averaging period — 平均周期。 Shift — 转移。 Averaging method — 平均法。 Applied price — 适用价格。 Slow MA — 慢MA Averaging period — 平均周期。 Shift — 转移。 Averaging method — 平均法。 Ap
ZigZag Dashboard for MT5
Taras Slobodyanik
5 (3)
ZigZag 指标的多货币和多时间框架修改。 显示市场的当前方向、上次走势的高度、本次走势中的柱数以及锯齿形调整浪(水平线)的前一个点的突破。 这是 MTF 扫描仪。 您可以在参数中指定任何所需的货币和时间范围。 此外,当之字折线改变方向或突破前一点时,面板可以发送通知。 通过单击带有句点的单元格,将打开该符号和句点。 参数 Depth — 如果最后一根蜡烛的偏差小于(或大于)前一根,则 Zigzag 将不会绘制第二个最大值(或最小值)的烛台的最小数量; Deviation — 锯齿形形成局部顶部/底部的两个相邻烛台的最高点/最低点之间的最小点数; Backstep — 局部高点/低点之间的最小烛台数量; Bars to calculate ZZ — 历史中用于查找 ZigZag 点的柱的数量; ZZ-wave info — 表格中显示有关波形的哪些信息 — 仅当前波形或当前波形 + 上一个波形; Highlight the symbol when all periods are in the same direction — 方向时突出显示该符号; Symbol highl
随机振荡器的多货币和多时间框架修改。 您可以在参数中指定任何所需的货币和时间范围。 该面板显示当前值和线的交点 - 信号线和主线(随机交叉)。 此外,该指标还可以在跨越超买和超卖水平时发送通知。 通过单击带有句点的单元格,将打开该符号和句点。 这是 MTF 扫描仪。 默认情况下,从图表中隐藏仪表板的键是“D”。 参数 %K Period — K 线的周期。 %D Period — D 线的周期。 Slowing — 放慢; Method — 平均法; Price field — 价格类型。 Line of indicator — 线索引。 Clear the chart at startup — 启动时清除图表。 Set of Pairs — 符号集: — Market Watch — 来自“市场观察”的配对。 — Specified manually — 在参数“Pairs”中手动指定对。 — Current pair  — 仅显示当前对。 Pairs (separated by a space or semicolon) — 由空格或分号分隔的符号列表。 货币名称的书
MA Dashboard MT5
Taras Slobodyanik
5 (4)
移动平均线 (MA) 指标的多货币和多时间范围修改。 在仪表板上,您可以看到指标的当前状态 - 快速 MA 和慢速 MA 的突破和触及(按价格),以及 MA 线彼此之间的交叉点(移动平均线交叉)。 在参数中,您可以指定任何所需的货币和时间范围。 此外,该指标还可以发送有关价格触及线及其交叉的通知。 通过单击带有句点的单元格,将打开该符号和句点。 这是 MTF 扫描仪。您可以在图表上运行多个仪表板。 该指标在当前图表上显示快速 MA 线和慢速 MA 线。 您可以为图表选择 MA 时间范围并从其他时间范围观察 MA (MTF MA)。 两组MA的热键默认为“1”和“2”。 默认情况下,从图表中隐藏仪表板的键是“D”。 参数 Fast MA — 快速MA Averaging period — 平均周期。 Shift — 转移。 Averaging method — 平均法。 Applied price — 适用价格。 Slow MA — 慢MA Averaging period — 平均周期。 Shift — 转移。 Averaging method — 平均法。 Ap
Fibo Candle Previous
Taras Slobodyanik
该指标根据 ZigZag 指标、交易时段、分形或蜡烛(包括非标准时间范围:年、6 个月、4 个月、3 个月、2 个月)自动绘制斐波那契水平(自动斐波那契回撤)。 您可以选择任何更高的时间范围进行斐波纳奇计算。 每次当前柱关闭时都会重新绘制级别。 当超过指定级别时可以启用警报。 您还可以分析历史水平。 为此,需要在“过去的斐波纳奇数”参数中指定斐波纳奇位的数量。 参数 Calculate Fibo according to — 根据斐波那契搜索模式计算斐波那契: Candles (High-Low) — 根据最高价-最低价构建斐波那契; Candles (Close-Close) — 基于收盘价-收盘价构建斐波那契; ZigZags — 通过 ZigZag 点构建斐波那契; Sessions — 通过交易会话构建斐波那契; Fractals — 通过分形点构建斐波那契。 Minimum fibo size, points (0-any) — 最小斐波那契尺寸,以点为单位。 如果斐波那契尺寸小于此大小,则忽略它。 TF for Candle — 用于构建斐波那契水平的
Bollinger Bands Dashboard MT5
Taras Slobodyanik
5 (1)
布林带指标的多货币和多时间框架修改。 在仪表板上,您可以看到布林带的突破和触及。 在参数中,您可以指定任何所需的货币和时间范围。 当价格触及布林线、当前波动率发生变化(扩大或下跌)以及价格触及所有布林线时,该指标还可以发送通知。 通过单击带有句点的单元格,将打开该符号和句点。 这是 MTF 扫描仪。 默认情况下,从图表中隐藏仪表板的键是“D”。 参数 Bollinger Bands Settings Averaging period — 计算指标的平均周期。 Standard deviations — 与主线的标准差数。 Bands shift — 指标相对于价格图表的移动。 Applied price — 用于计算的价格。 Show BB on the current chart — 在当前图表上显示 BB。 仪表板 Clear the chart at startup — 启动时清除图表。 Set of Pairs — 符号集 — Market Watch — 来自“市场观察”的配对。 — Specified manually — 在参数“Pairs”中手动指定对。
ADX Dashboard MT5
Taras Slobodyanik
5 (3)
ADX 指标用于确定趋势及其强度。 价格的方向由 +DI 和 -DI 值显示,ADX 值显示趋势的强度。 如果+DI高于-DI,则市场处于上升趋势,如果相反,则市场处于下降趋势。 如果 ADX 低于 20,则没有明确的方向。 一旦指标突破该水平,中等强度的趋势就会开始。 值高于 40 表示强劲趋势(下降趋势或上升趋势)。 平均方向运动指数 (ADX) 指标的多货币和多时间框架修改。 您可以在参数中指定任何所需的货币和时间范围。 此外,当趋势强度水平被交叉时,以及当 +DI 和 -DI 线被交叉时,指标可以发送通知。 通过单击带有句点的单元格,将打开该符号和句点。 这是 MTF 扫描仪。 与货币强度计类似,仪表板可以自动选择包含指定货币的货币对或以该货币为基础的货币对。 该指标还将在单独的行上计算该货币的 ADX。 默认情况下,从图表中隐藏仪表板的键是“D”。 参数 ADX Period — 平均周期。 ADX Applied Price — 价格类型。 Clear the chart at startup — 启动时清除图表。 Set of Pairs — 符号集 —
ADX Dashboard
Taras Slobodyanik
5 (3)
ADX 指标用于确定趋势及其强度。 价格的方向由 +DI 和 -DI 值显示,ADX 值显示趋势的强度。 如果+DI高于-DI,则市场处于上升趋势,如果相反,则市场处于下降趋势。 如果 ADX 低于 20,则没有明确的方向。 一旦指标突破该水平,中等强度的趋势就会开始。 值高于 40 表示强劲趋势(下降趋势或上升趋势)。 平均方向运动指数 (ADX) 指标的多货币和多时间框架修改。 您可以在参数中指定任何所需的货币和时间范围。 此外,当趋势强度水平被交叉时,以及当 +DI 和 -DI 线被交叉时,指标可以发送通知。 通过单击带有句点的单元格,将打开该符号和句点。 这是 MTF 扫描仪。 与货币强度计类似,仪表板可以自动选择包含指定货币的货币对或以该货币为基础的货币对。 该指标还将在单独的行上计算该货币的 ADX。 默认情况下,从图表中隐藏仪表板的键是“D”。 参数 ADX Period — 平均周期。 ADX Applied Price — 价格类型。 Clear the chart at startup — 启动时清除图表。 Set of Pairs — 符号集 —
ZigZag Lines MTF
Taras Slobodyanik
4.27 (11)
多时间框架锯齿形调整浪指标。 它显示支撑/阻力水平线及其突破,并绘制当前的市场目标。 它还可以显示分形指标的线条和其他时期(最多季度)的蜡烛。 该指标重新绘制最后一个(当前)点,并且在某些情况下可以更改最后 2-3 个点。 所有线条均绘制为对象(不是指标缓冲区,但有可能接收 EA 的数据)。 在 Expert Advisor 中使用时,您可以使用 iCustom 读取 ZigZag 点。 设置 Mode — 根据以下因素绘制支撑位和阻力位: —  Zig Zag — ZigZag 指标; —  ZigZag Close — 之字折线收盘指标; —  Fractals — 分形指标; —  High-Low of the period — 通过高低水平构建指标。 时间范围在Period参数中指定; —  Candles only — 仅绘制蜡烛; Depth — 如果最后一根蜡烛的偏差小于(或大于)前一根,则 Zigzag 将不会绘制第二个最大值(或最小值)的烛台的最小数量; Deviation — 锯齿形形成局部顶部/底部的两个相邻烛台的最高点/最低点之间的最小点数; B
Lines Profit Loss MT5
Taras Slobodyanik
4.57 (14)
该指标显示当前交易品种的盈利(亏损)。 您可以自由拖放线条来显示当前的盈利或亏损。 参数 Calculation in money or in points — 以点数或货币计算利润/损失。 Add pending orders to calculate — 在计算中考虑挂单。 Magic Number (0 - all orders on symbol) — 幻数,如果需要评估特定订单。 Offset for first drawing (points from the average price) — 线距第一次开始时的平均价格的偏移量。 Decimal places for calculating the Sum — 显示总和的小数点后的位数。 Decimal places for calculating the Percentage — 显示百分比的小数点后的位数。 Tuning 调音 Color of the profit line — 利润线的颜色。 Color of the loss line — 损失线的颜色。 Line style — 线条样式。 L
FREE
ZigZag Dashboard for MT4
Taras Slobodyanik
4.75 (4)
ZigZag 指标的多货币和多时间框架修改。 显示市场的当前方向、上次走势的高度、本次走势中的柱数以及锯齿形调整浪(水平线)的前一个点的突破。 这是 MTF 扫描仪。 您可以在参数中指定任何所需的货币和时间范围。 此外,当之字折线改变方向或突破前一点时,面板可以发送通知。 通过单击带有句点的单元格,将打开该符号和句点。 参数 Depth — 如果最后一根蜡烛的偏差小于(或大于)前一根,则 Zigzag 将不会绘制第二个最大值(或最小值)的烛台的最小数量; Deviation — 锯齿形形成局部顶部/底部的两个相邻烛台的最高点/最低点之间的最小点数; Backstep — 局部高点/低点之间的最小烛台数量; Bars to calculate ZZ — 历史中用于查找 ZigZag 点的柱的数量; ZZ-wave info — 表格中显示有关波形的哪些信息 — 仅当前波形或当前波形 + 上一个波形; Highlight the symbol when all periods are in the same direction — 方向时突出显示该符号; Symbol highl
Lines Profit Loss
Taras Slobodyanik
4.82 (22)
该指标显示当前交易品种的盈利(亏损)。 您可以自由拖放线条来显示当前的盈利或亏损。 参数 Calculation in money or in points — 以点数或货币计算利润/损失。 Add pending orders to calculate — 在计算中考虑挂单。 Magic Number (0 - all orders on symbol) — 幻数,如果需要评估特定订单。 Offset for first drawing (points from the average price) — 线距第一次开始时的平均价格的偏移量。 Decimal places for calculating the Sum — 显示总和的小数点后的位数。 Decimal places for calculating the Percentage — 显示百分比的小数点后的位数。 Tuning 调音 Color of the profit line — 利润线的颜色。 Color of the loss line — 损失线的颜色。 Line style — 线条样式。 L
FREE
CCI Dashboard for MT4
Taras Slobodyanik
5 (3)
商品通道指数 (CCI) 指标的多货币和多时间框架修改。 您可以在参数中指定任何所需的货币和时间范围。 此外,该面板还可以在跨越超买和超卖水平时发送通知。 通过单击带有句点的单元格,将打开该符号和句点。 这是 MTF 扫描仪。 默认情况下,从图表中隐藏仪表板的键是“D”。 参数 CCI Period — 平均周期。 CCI Applied price — 价格类型。 Clear the chart at startup — 启动时清除图表。 Set of Pairs — 符号集 — Market Watch — 来自“市场观察”的货币对; — Specified manually — 在参数“Pairs”中手动指定对。 — Current pair — 当前对。 Pairs (separated by a space or semicolon) — 由空格或分号分隔的符号列表。 货币名称的书写方式应与经纪商的名称完全相同,并保留大小写和前缀/后缀。 Time Frames (separated by a space or semicolon) — 由空格或分号分隔的时
Dashboard RSI Multicurrency
Taras Slobodyanik
5 (6)
相对强弱指数 (RSI) 指标的多货币和多时间框架修改。 您可以在参数中指定任何所需的货币和时间范围。 此外,该面板还可以在跨越超买和超卖水平时发送通知。 通过单击带有句点的单元格,将打开该符号和句点。 这是 MTF 扫描仪。 默认情况下,从图表中隐藏仪表板的键是“D”。 与货币强弱计类似,仪表板可以自动选择包含指定货币的货币对或以该货币为基础的货币对。 该指标还将在单独的行上计算该货币的 RSI。 参数 RSI Period — 平均周期。 RSI Applied price — 价格类型。 Clear the chart at startup — 启动时清除图表。 Set of Pairs — 符号集 — Market Watch — 来自“市场观察”的配对。 — Specified manually — 在参数“Pairs”中手动指定对。 — Current pair — 仅显示当前对。 Pairs (separated by a space or semicolon) — 由空格或分号分隔的符号列表。 货币名称的书写方式应与经纪商的名称完全相同,并保留大小
Heikin Ashi Dashboard
Taras Slobodyanik
5 (3)
多货币和多时间框架 Heikin Ashi 指标。 显示了当前的市场状况。 在扫描仪面板上,您可以看到当前趋势的方向、强度和条形数量。 盘整/反转蜡烛也用颜色显示。 您可以在参数中指定任何所需的货币和期间。 此外,当趋势发生变化或出现反转和盘整蜡烛(十字星)时,指标可以发送通知。 通过单击单元格,将打开该符号和句点。 这是 MTF 扫描仪。 Heikin-Ashi 是日本的交易指标和金融图表,意思是“平均速度”。 Heikin-Ashi 图表类似于烛台图,但具有更平滑的外观,因为它们跟踪一系列价格变动,而不是像烛台那样跟踪每个价格变动。 Heikin-Ashi 由 Munehisa Homma 在 1700 年代创建,他还创建了烛台图。 交易者和投资者使用这些图表来帮助确定和预测价格变动。 参数 Averaging Method for Smoothing — 选择平滑蜡烛价格的方法。 — Simple MA — 简单 MA — Exponential MA — 指数 MA — Smoothed MA — 平滑 MA — Linear weighted MA — 线性加权
标准偏差通道的多货币和多时间框架指标。 显示市场的当前方向。 在面板上,您可以看到线性回归通道水平的突破和触及(按价格)。 在参数中,您可以指定任何所需的货币和时间范围。 此外,该指标还可以在触及水平时发送通知。 通过单击单元格,将打开该符号和句点。 这是 MTF 扫描仪。 默认情况下,从图表中隐藏仪表板的键是“D”。 «标准偏差通道建立在线性回归趋势的基础上,代表使用最小二乘法在价格图表上的两点之间构建的常见趋势线。 结果,这条线被证明是价格变化的确切中线。 它可以被视为一条均衡价格线,任何向上或向下的偏转分别表明买家或卖家的超活跃性。 标准偏差通道由两条平行线组成,与线性回归趋势上下等距。 通道框架与回归线之间的距离等于收盘价与回归线的标准差值。 所有价格变化都发生在标准偏差通道内,其中下框作为支撑线,上框作为阻力线。 价格通常会在短时间内超过通道框架。 如果它们在通道框架之外停留的时间比平时更长,则预测趋势转向的可能性» 参数 Show Linear Regression on the chart — 在当前图表上绘制标准偏差通道。 Standard De
Time Scale
Taras Slobodyanik
4.8 (10)
The indicator draws the time scale on the chart. You can specify the time offset, adjust the size and font to display on the chart (it is displaying your local time on your chart instead of MT time). You can also select the desired format for displaying the date and time. While holding down the middle mouse button, and moving the cursor, a slider will appear on the scale. You may be interested in my other product , which contains a more advanced version of the Time Scale. Parameters Hours (tim
FREE
MACD Dashboard MT5
Taras Slobodyanik
5 (1)
多货币和多时间框架指标 MACD。 仪表板可以显示传统(真实)MACD 和 MetaTrader 中内置的 MACD。 在面板上,您可以看到指标的当前状态 - MACD 线的移动方向、它们的交点以及带有指标图表的弹出窗口。 在参数中,您可以指定任何所需的交易品种和时间范围。 扫描仪还可以发送有关线相互交叉以及线穿过零电平的通知。 通过单击单元格,将打开给定的符号和句点。 因此,您可以轻松扫描所有时间范围的所有货币对和交易品种,以找到 MACD 主线和信号线或零水平的交叉点。 显示/隐藏仪表板的热键默认为“D”。 默认情况下,启用/禁用弹出图表的热键为“C”。 用于切换图表“1”和“2”上的箭头的热键。 MACD(移动平均收敛/发散)指标(或“振荡指标”)是根据历史价格数据(最常见的是收盘价)计算得出的三个时间序列的集合。 这三个系列是:MACD 系列本身、“信号”或“平均”系列以及“背离”系列(两者之间的区别)。 MACD 系列是价格系列的“快速”(短期)指数移动平均线 (EMA) 和“慢速”(较长周期)EMA 之间的差异。 平均数系列是 MACD 系列本身的 EMA。
Heikin Ashi Dashboard MT5
Taras Slobodyanik
5 (1)
多货币和多时间框架 Heikin Ashi 指标。 显示了当前的市场状况。 在扫描仪面板上,您可以看到当前趋势的方向、强度和条形数量。 盘整/反转蜡烛也用颜色显示。 您可以在参数中指定任何所需的货币和期间。 此外,当趋势发生变化或出现反转和盘整蜡烛(十字星)时,指标可以发送通知。 通过单击单元格,将打开该符号和句点。 这是 MTF 扫描仪。 Heikin-Ashi 是日本的交易指标和金融图表,意思是“平均速度”。 Heikin-Ashi 图表类似于烛台图,但具有更平滑的外观,因为它们跟踪一系列价格变动,而不是像烛台那样跟踪每个价格变动。 Heikin-Ashi 由 Munehisa Homma 在 1700 年代创建,他还创建了烛台图。 交易者和投资者使用这些图表来帮助确定和预测价格变动。 参数 Averaging Method for Smoothing — 选择平滑蜡烛价格的方法。 — Simple MA — 简单 MA — Exponential MA — 指数 MA — Smoothed MA — 平滑 MA — Linear weighted MA — 线性加权
Pro Sessions MT4
Taras Slobodyanik
4 (3)
这是一个交易时段指标,可以显示四个交易时段的所有级别(开盘价-最高价-最低价-收盘价)。 该指标还可以预测会话级别。 会话可以用线条或矩形(空的或填充的)绘制,线条可以延伸到下一个会话。 您可以通过按热键(默认为“1”、“2”、“3”、“4”)轻松隐藏/显示每个会话。 您可以看到 ASR(平均会话范围)线(默认热键“A”) 。 这与 ADR 计算类似,只是它是根据最后一个 X 交易时段计算的,这使您可以看到当前(和之前)交易时段的潜在范围(今天价格可以移动多远)。 平均值的计算方式为之前会话的总和除以会话数(参数“ASR 周期(计算平均值的会话数)”),每个会话都有自己的 ASR 值。 该指标计算并绘制未来的会话及其大小。 正确识别报价历史记录中的漏洞。 它还可以在每个会话开始时绘制垂直分隔符。 指标自动确定图表的配色方案。 当价格触及会话水平或价格突破已关闭会话指定距离时,它还会发送警报。 可以禁用每个会话的警报。 参数“如果其他会话启动则停止会话”(热键“S”)允许您停止过时的会话,并在新会话中断时接收警报。 该指标可以绘制枢轴水平并就其发送警报。 这些级
相对强弱指数 (RSI) 指标的多货币和多时间框架修改。 您可以在参数中指定任何所需的货币和时间范围。 此外,该面板还可以在跨越超买和超卖水平时发送通知。 通过单击带有句点的单元格,将打开该符号和句点。 这是 MTF 扫描仪。 默认情况下,从图表中隐藏仪表板的键是“D”。 与货币强弱计类似,仪表板可以自动选择包含指定货币的货币对或以该货币为基础的货币对。 该指标还将在单独的行上计算该货币的 RSI。 参数 RSI Period — 平均周期。 RSI Applied price — 价格类型。 Clear the chart at startup — 启动时清除图表。 Set of Pairs — 符号集 — Market Watch — 来自“市场观察”的配对。 — Specified manually — 在参数“Pairs”中手动指定对。 — Current pair — 仅显示当前对。 Pairs (separated by a space or semicolon) — 由空格或分号分隔的符号列表。 货币名称的书写方式应与经纪商的名称完全相同,并保留大小
Pro Sessions MT5
Taras Slobodyanik
5 (1)
这是一个交易时段指标,可以显示四个交易时段的所有级别(开盘价-最高价-最低价-收盘价)。 该指标还可以预测会话级别。 会话可以用线条或矩形(空的或填充的)绘制,线条可以延伸到下一个会话。 您可以通过按热键(默认为“1”、“2”、“3”、“4”)轻松隐藏/显示每个会话。 您可以看到   ASR(平均会话范围)线(默认热键“A”) 。 这与 ADR 计算类似,只是它是根据最后一个 X 交易时段计算的,这使您可以看到当前(和之前)交易时段的潜在范围(今天价格可以移动多远)。 平均值的计算方式为之前会话的总和除以会话数(参数“ASR 周期(计算平均值的会话数)”),每个会话都有自己的 ASR 值。 该指标计算并绘制未来的会话及其大小。 正确识别报价历史记录中的漏洞。 它还可以在每个会话开始时绘制垂直分隔符。 指标自动确定图表的配色方案。 当价格触及会话水平或价格突破已关闭会话指定距离时,它还会发送警报。 可以禁用每个会话的警报。 参数“如果其他会话启动则停止会话”(热键“S”)允许您停止过时的会话,并在新会话中断时接收警报。 该指标可以绘制枢轴水平并就其发送警报。 这
Gann Square of 144 for MT5
Taras Slobodyanik
5 (5)
江恩箱(或江恩方)是一种基于 W.D. Gann 的“市场预测的数学公式”文章的市场分析方法。 该指标可以绘制三种正方形模型:90、52(104)、144。有六种网格变体和两种弧形变体。 您可以在一张图表上同时绘制多个方块。 参数 Square — 选择方形模型: 90 — 90 的平方(或 9 的平方); 52 (104) — 52(或 104)的平方; 144 — 144的万能平方; 144 (full) — 正方形的“完整”版本,结合了其他正方形的线条。 据我们所知,W.D.江恩并没有这样的加价; for Arcs — 圆弧的简化正方形; Grid — 网格的变体: 4x4 (52) — 4 x 4 网格,52 个标记; 5x5 (40); 8x8 (90); 8x8 (104); 8x8 (144); 16x16 (144); 36x36 (144); disable — 禁用网格; Arcs — 弧线的变体: 4x4; 5x5; disable — 禁用弧; 开始时的方形参数: Length of Square, Bars (X-axis) — 正方形的长度(以条
MACD Dashboard
Taras Slobodyanik
多货币和多时间框架指标 MACD。 仪表板可以显示传统(真实)MACD 和 MetaTrader 中内置的 MACD。 在面板上,您可以看到指标的当前状态 - MACD 线的移动方向、它们的交点以及带有指标图表的弹出窗口。 在参数中,您可以指定任何所需的交易品种和时间范围。 扫描仪还可以发送有关线相互交叉以及线穿过零电平的通知。 通过单击单元格,将打开给定的符号和句点。 因此,您可以轻松扫描所有时间范围的所有货币对和交易品种,以找到 MACD 主线和信号线或零水平的交叉点。 显示/隐藏仪表板的热键默认为“D”。 默认情况下,启用/禁用弹出图表的热键为“C”。 用于切换图表“1”和“2”上的箭头的热键。 MACD(移动平均收敛/发散)指标(或“振荡指标”)是根据历史价格数据(最常见的是收盘价)计算得出的三个时间序列的集合。 这三个系列是:MACD 系列本身、“信号”或“平均”系列以及“背离”系列(两者之间的区别)。 MACD 系列是价格系列的“快速”(短期)指数移动平均线 (EMA) 和“慢速”(较长周期)EMA 之间的差异。 平均数系列是 MACD 系列本身的 EMA。
该指标具有三个主要工具:放大镜(缩放图表)、标尺(时间和价格刻度)和十字准线。 您可以用鼠标移动它并自定义不同的显示格式,自定义每个元素的大小和颜色。 放大镜(缩放图表)允许您显示任何时间范围和不同比例的蜡烛。 默认热键:“Q”- 更高的时间范围,“A”- 更低的时间范围,“W”- 减小蜡烛尺寸,“S”- 增加蜡烛尺寸,“Z”- 显示/隐藏缩放图表。 您可以在评论页面找到最新的演示。 → 演示版仅适用于 USDJPY 货币对。 时间刻度根据时间周期标记图表。 您可以设置时移,以便您可以在刻度上看到您的当地时间,而不是经纪商的时间(因此它会在图表上显示您的当地时间,而不是 MT 时间)。 时间格式可以设置为 24 小时制或 12 小时制。 热键“T”- 显示/隐藏时间刻度。 价格刻度垂直标记图表。 您可以设置显示数字和四舍五入价格的格式。 热键“P”- 显示/隐藏价格等级。 十字线可以显示价格、时间、柱数、点数、百分比、根据指定手数计算的利润(按手数计算的利润)、根据指定金额计算的手数(按风险手数)。 热键“C”- 显示/隐藏十字准线。 如果金额计算不正确,请尝试启用“如果
筛选:
spot007
93
spot007 2024.05.02 06:01 
 

Fantastic product. I really love this. Easy to set up, easy to use. So simple and does exactly what I need. Thank you!

Darvero
97
Darvero 2024.03.26 21:46 
 

Отличный индикатор, спасибо.

nestor jose
28
nestor jose 2024.03.16 17:47 
 

Excelente

0xJes
56
0xJes 2024.02.26 06:57 
 

The fact that MT5 uses broker time and not your local time sucks, this extension fixes it and adds useful functionality!!!

mi rou
18
mi rou 2023.12.09 15:31 
 

Thank you so much brother.

Dixit Khosla
38
Dixit Khosla 2023.09.21 01:11 
 

Excellent product. Seamless.

lolissimo
75
lolissimo 2023.08.19 20:12 
 

It has everything necessary to be an excellent and simple application, but there is something that does not work well and starts to slow down the graphics, minutes after installing it

Taras Slobodyanik
63723
来自开发人员的回复 Taras Slobodyanik 2023.08.20 09:53
Hello. I need more information on how I can repeat this situation for myself.
IK°L
816
IK°L 2023.07.11 23:00 
 

This solves the entanglements due to time lags, between the terminal, your local time, the broker, summer time, etc. It works like a charm!!

Anton Hluscu
50
Anton Hluscu 2023.04.22 23:01 
 

I like this time scale very much

GrnElf
65
GrnElf 2022.12.09 16:55 
 

It works!

are1971
738
are1971 2022.08.20 16:30 
 

Excellent indicator it makes trading easier

Mary Gomes
257
Mary Gomes 2022.06.23 07:48 
 

Beautiful Indicator

DuahCapital
34
DuahCapital 2021.08.18 21:03 
 

Is there any option to change the time from 24 hour format to 12 hour format?

Taras Slobodyanik
63723
来自开发人员的回复 Taras Slobodyanik 2021.08.31 09:46
yes, added
kinjal parekh
1892
kinjal parekh 2021.05.19 08:13 
 

Excellento......

Andre Gomes
2771
Andre Gomes 2021.03.02 13:39 
 

Really great!

Scott Cranmer
46
Scott Cranmer 2020.10.31 10:53 
 

Excellent. Does exactly as advertised. Many thanks.

Andrii Diachenko
4580
Andrii Diachenko 2019.12.27 14:44 
 

Отличный инструмент! Тарас - огромное спасибо за то, что внесли изменения по моим пожеланиям.

[删除] 2019.11.02 18:41 
 

用户没有留下任何评级信息

OLEKSІI POPOV
183
OLEKSІI POPOV 2019.01.23 17:35 
 

用户没有留下任何评级信息

回复评论
版本 1.80 2023.08.22
1) Fixed divide-by-zero bug.
2) Code optimization for MT5.
版本 1.70 2021.08.28
1) Fixed a bug with the delay in updating the number of bars on the chart using the CHART_FIRST_VISIBLE_BAR function.
版本 1.60 2021.08.27
1) Optimization of the code, acceleration of the indicator.
版本 1.50 2021.08.26
1) Added parameters to control the date and time format (on the scale and on the mouse).
2) Fixed a bug when loading an indicator from a template.
版本 1.40 2020.06.10
1) Recompilation for the new build.
版本 1.30 2020.01.13
1) Added verification of the middle mouse button.