Tick
- 指标
- Andrej Nikitin
- 版本: 1.12
- 更新: 17 十一月 2021
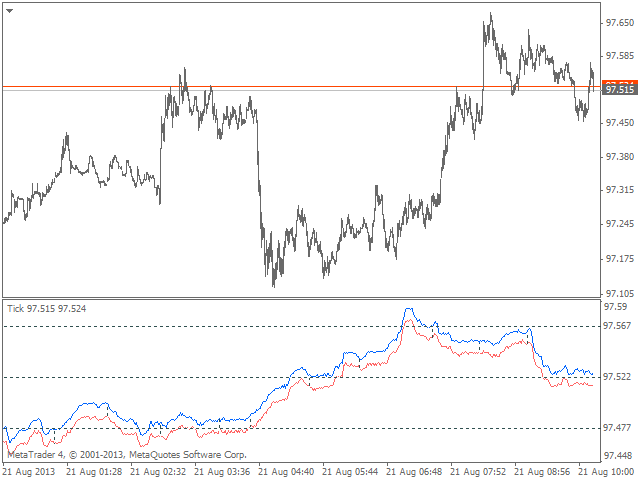
一款简单的即时报价出价和询价指标。周期分隔符 (1 分钟) 显示为直方图。
参数
- Price_levels_count - 显示的价位数量。
- Bar_under_calculation - 指标在图表上显示柱线的数量。
一款简单的即时报价出价和询价指标。周期分隔符 (1 分钟) 显示为直方图。
参数


用户没有留下任何评级信息
用户没有留下任何评级信息


指標発表の直前・直後などでは、すべてのトレーダーの息遣いが伝わってくるようで面白い