• Información general
  • Comentarios (5)
  • Discusión (3)
  • Novedades

Tick

4.33

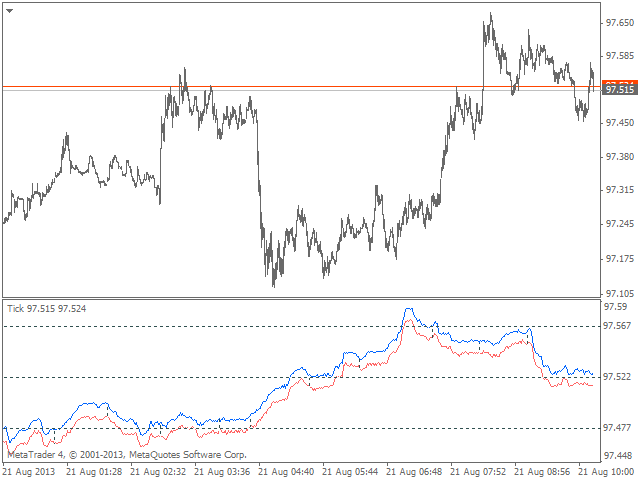
Es un simple indicador de tick del precio Bid y Ask. El separador del período (1 minuto) se muestra en forma del histograma.

Parámetros

  • Price_levels_count - número de niveles de precio a mostrar.
  • Bar_under_calculation - número de barras del indicador mostradas en el gráfico.
Comentarios 5
d_miki
38
d_miki 2023.07.16 04:14 
 

指標発表の直前・直後などでは、すべてのトレーダーの息遣いが伝わってくるようで面白い

Productos recomendados
Market Profile 3
Hussien Abdeltwab Hussien Ryad
4 (4)
Market Profile 3 MetaTrader 4 indicator  — is a classic Market Profile implementation that can show the price density over time, outlining the most important price levels, value area, and control value of a given trading session. This indicator can be attached to timeframes between M1 and D1 and will show the Market Profile for daily, weekly, monthly, or even intraday sessions. Lower timeframes offer higher precision. Higher timeframes are recommended for better visibility. It is also possible t
FREE
TrendPlus
Sivakumar Subbaiya
4.21 (14)
Trend Plus   Trendplus  Indicator   Time Frame: Suitable for any time frame.  Purpose: Trend Prediction. Blue and red candle indicate the buy and sell call respectively. Buy: When the blue candle is formed buy call is initiated. close the buy trades when the next red candle will formed.   Sell: When the Red candle is formed Sell call is initiated. close the Sell trades when the next blue candle will formed.   Happy trade!!
FREE
Cumulative Delta MT4
Evgeny Shevtsov
4.69 (35)
The indicator analyzes the volume scale and splits it into two components - seller volumes and buyer volumes, and also calculates the delta and cumulative delta. The indicator does not flicker or redraw, its calculation and plotting are performed fairly quickly, while using the data from the smaller (relative to the current) periods. The indicator operation modes can be switched using the Mode input variable: Buy - display only the buyer volumes. Sell - display only the seller volumes. BuySell -
FREE
Highlights trading sessions on the chart The demo version only works on the AUDNZD chart!!! The full version of the product is available at: (*** to be added ***) Trading Session Indicator displays the starts and ends of four trading sessions: Pacific, Asian, European and American. the ability to customize the start/end of sessions; the ability to display only selected sessions; works on M1-H2 timeframes; The following parameters can be configured in the indicator: TIME_CORRECTION = Cor
FREE
Extremum Reverse Bar
Yurij Izyumov
3.55 (11)
This indicator has been created for finding the probable reversal points of the symbol price. A small candlestick reversal pattern is used it its operation in conjunction with a filter of extremums. The indicator is not redrawn! If the extremum filter is disabled, the indicator shows all points that have a pattern. If the extremum filter is enabled, the condition works – if the history Previous bars 1 candles back contains higher candles and they are farther than the Previous bars 2 candle, such
FREE
BoxInside MT4
Evgeny Shevtsov
4.56 (9)
This indicator calculates the volume profile and places labels that correspond to the VAH, VAL and POC levels, for each candle individually. Indicator operation features The indicator works on the timeframes from M5 to MN, but it uses the history data of smaller periods: M1 - for periods from M5 to H1, M5 - for the H4 period, M30 - for the D1 period, H4 - for the W1 period, D1 - for the MN period. The color and location of the VAL, VAH and POC labels on the current candle are considered to be
FREE
PZ Penta O MT4
PZ TRADING SLU
2.25 (4)
The Penta-O is a 6-point retracement harmonacci pattern which usually precedes big market movements. Penta-O patterns can expand and repaint quite a bit. To make things easier this indicator implements a twist: it waits for a donchian breakout in the right direction before signaling the trade. The end result is an otherwise repainting indicator with a very reliable trading signal. The donchian breakout period is entered as an input. [ Installation Guide | Update Guide | Troubleshooting | FAQ | A
FREE
Wicks UpDown Target GJ Wicks UpDown Target GJ is specialized in GJ forex pairs. Choppy movement up and down on the opening range every day.  Trading breakouts on London session and New York session is recommended. Guideline Entry Strategy Idea: Step 1 - Breakout Forming (Warning! Trade on London Session and New York Session) Step 2 - Breakout Starting (Take Action on your trading plan) Step 3 - Partial Close your order & set breakeven (no-risk) Step 4 - Target complete Step 5 - Don't tr
FREE
Are you tired of drawing trendlines every time you're analyzing charts? Or perhaps you would like more consistency in your technical analysis. Then this is for you. This indicator will draw trend lines automatically when dropped on a chart. How it works Works similar to standard deviation channel found on mt4 and mt5. It has 2 parameters: 1. Starting Bar 2. Number of bars for calculation The   starting bar   is the bar which drawing of the trend lines will begin, while the   number of bars for c
FREE
Rainbow MT4
Jamal El Alama
Rainbow MT4 is a technical indicator based on Moving average with period 34 and very easy to use. When price crosses above MA and MA changes color to green, it’s a signal to buy. When price crosses below MA and MA changes color to red, it’s a signal to sell. The Expert advisor ( Rainbow EA MT4) based on Rainbow MT4 indicator, as you can see in the short video below is now available here .
FREE
Head and Shoulders Pattern Indicator - Your Key to Recognizing Trend Reversals Unlock the power of pattern recognition with the "Head and Shoulders Pattern Indicator." This cutting-edge tool, designed for MetaTrader, is your trusted ally in identifying one of the most powerful chart patterns in technical analysis. Whether you're a novice or an experienced trader, this indicator simplifies the process of spotting the Head and Shoulders pattern, allowing you to make informed trading decisions. Key
FREE
Pivot Point Fibo RSJ es un indicador que rastrea las líneas de soporte y resistencia del día utilizando las tasas de Fibonacci. Este espectacular indicador crea hasta 7 niveles de soporte y resistencia a través del Pivot Point utilizando las tasas de Fibonacci. Es fantástico cómo los precios respetan cada nivel de este soporte y resistencia, donde es posible percibir posibles puntos de entrada / salida de una operación. Características Hasta 7 niveles de soporte y 7 niveles de resistencia
FREE
Free automatic Fibonacci is an indicator that automatically plots a Fibonacci retracement based on the number of bars you select on the BarsToScan setting in the indicator. The Fibonacci is automatically updated in real time as new highest and lowest values appears amongst the selected bars. You can select which level values to be displayed in the indicator settings. You can also select the color of the levels thus enabling the trader to be able to attach the indicator several times with differe
FREE
Traditional MACD MT4
Daniel Lewis
4.61 (71)
El indicador MACD en MetaTrader 4/5 se diferencia de los semejantes indicadores en otros programas. Eso se debe al hecho de que en la versión MetaTrader 4/5 la línea MACD se muestra en forma del histograma, mientras que habitualmente se muestra en forma de la línea. Además, en la versión MetaTrader 4/5 la línea de señal se construye con el uso de SMA, mientras que por definición tiene que construirse usando EMA. En la versión MetaTrader 4/5 también se diferencia el histograma (la diferencia entr
FREE
PZ Pivot Points
PZ TRADING SLU
4.64 (14)
This indicator displays pivot points in the chart, including historical vales, and supports many calculation modes for Pivot Points and S/R levels.  [ Installation Guide | Update Guide | Troubleshooting | FAQ | All Products ] It plots historical levels for backtesting purposes It allows you to select the reference timeframe It implements different Pivot Point calculation modes It implements different SR calculation modes It implements customizable colors and sizes Calculation Modes The indi
FREE
The indicator analyzes the change in the minimum and maximum prices of the previous bars fixing the entrance of the big players. If the change (delta) increases, a signal is displayed on the graph in the form of an arrow. At the same time, virtual trade on history is carried out. In the free version, virtual trade is performed without refills in case of a repeat of the signal. The results of virtual trading in the form of losses / losses, profitability, drawdown and transaction lines are display
FREE
This indicator alerts you when/before new 1 or 5 minute bar candle formed. In other words,this indicator alerts you every 1/5 minutes. This indicator is especially useful for traders who trade when new bars formed. *This indicator don't work propery in strategy tester.Use this in live trading to check functionality. There is more powerful Pro version .In Pro version,you can choose more timeframe and so on. Input Parameters Alert_Or_Sound =Sound ----- Choose alert or sound or both to not
FREE
Introducing the Consecutive Green/Red Candle Alert Indicator for MT4 - Your Trend Spotting Companion! Are you ready to take your trading to the next level? We present the Consecutive Green/Red Candle Alert Indicator, a powerful tool designed to help you spot trends and potential reversals with ease. Whether you're a new trader looking for clarity in the market or an experienced pro seeking additional confirmation, this indicator is your trusted companion. Key Features of the Consecutive Green/Re
FREE
MegaTrends
Sivakumar Subbaiya
1 (1)
Megatrends  Indicator   Time Frame: Suitable for any time frame.  Purpose: Trend Prediction. Blue and red color indicate the buy and sell call respectively. Buy: When the blue line is originating it is opened buy call. Sell: When the Red line is origination it is opened sell call Happy trade!! this indicator is suitable for all time frame, but our recommended time frame to use 1hour and 4 hours, suitable for any chart.
FREE
This trial scanner works with the other "Smart Market Structure Opportunity Scanner", and is basically an extension of that scanner with added features to find more accurate entry opportunities for day trading or refined swing trading.  The most important added features are:  1) The ADRs ( Average Daily Range ) for the last 5 days would have color and  +/- sign that shows the direction of each days ADR     move.  2) I added RSI values for each of the trading timeframes ( 1min, 5min, 15min, 30min
FREE
Follow The Line
Oliver Gideon Amofa Appiah
4 (13)
FOLLOW THE LINE GET THE FULL VERSION HERE: https://www.mql5.com/en/market/product/36024 This indicator obeys the popular maxim that: "THE TREND IS YOUR FRIEND" It paints a GREEN line for BUY and also paints a RED line for SELL.  It gives alarms and alerts of all kinds. IT DOES NOT REPAINT and can be used for all currency pairs and timeframes. Yes, as easy and simple as that. Even a newbie can use it to make great and reliable trades. NB: For best results, get my other premium indicators for more
FREE
Bienvenido a nuestro   patrón de ondas de precios   MT4 --(Patrón ABCD)--     El patrón ABCD es un patrón comercial poderoso y ampliamente utilizado en el mundo del análisis técnico. Es un patrón de precio armónico que los comerciantes utilizan para identificar oportunidades potenciales de compra y venta en el mercado. Con el patrón ABCD, los operadores pueden anticipar posibles movimientos de precios y tomar decisiones informadas sobre cuándo ingresar y salir de las operaciones. Versión EA:
FREE
Pip Show - MultiStrategy Trading   The indicator is for free and you have to install it before you can use the Pip Show - MultiStrategy Trading EA. The use of the indicator is very simple, on green open buy positions and on red open sell positions. Its based on a MA calculation. Check out my fully automatic trading robot  multistrategy-trading.com It has four parameters: Period, Divisor ("speed"), Price and TimeFrame Period - how many candles , backwards, are calculating Divisor - how "quick" is
FREE
El Capturador de Tendencias: La Estrategia del Capturador de Tendencias con Indicador de Alerta es una herramienta versátil de análisis técnico que ayuda a los traders a identificar las tendencias del mercado y los posibles puntos de entrada y salida. Presenta una Estrategia dinámica del Capturador de Tendencias, adaptándose a las condiciones del mercado para una clara representación visual de la dirección de la tendencia. Los traders pueden personalizar los parámetros para que se ajusten a s
FREE
High Low Open Close MT4
Alexandre Borela
4.82 (22)
Si te gusta este proyecto, deja una revisión de 5 estrellas. Seguir en instagram: borelatech Este indicador dibuja los precios abiertos, altos, bajos y finales para los especificados período y se puede ajustar para una zona horaria específica. Estos son niveles importantes considerados por muchos institucionales y profesionales comerciantes y puede ser útil para que usted sepa los lugares donde podrían ser más activo. Los períodos disponibles son: Día previo. Semana anterior. Mes anteri
FREE
Tipu Heikin Ashi Panel
Kaleem Haider
4.56 (25)
Tipu Heikin-Ashi Panel is the modified version of the original Heiken Ashi indicator published by MetaQuotes here . A professional version of this indicator is available here . Features An easy to use Panel that shows the Heiken Ashi trend of selected timeframe. Customizable Buy/Sell alerts, push alerts, email alerts, or visual on-screen alerts. Customizable Panel. The panel can be moved to any place on the chart or minimized to allow more space. Heikin means "the average", and Ashi means "foo
FREE
The Rayol Code Hour Interval Lines indicator was  designed to assist your trading experience.  It  draws the range of hours chosen by the user directly on the chart, so that it enables traders to visualize price movements during their preferred trading hours, providing  traders   a more comprehensive view of   price movements and market dynamics. This indicator allows the user to choose not only the Broker's time, but also the Local time. This way, the user no longer needs to calculate local ti
FREE
The indicator displays price distribution on a horizontal histogram. Horizontal histogram help find out key levels of price so that you can make good decision on setting point of take profit, stop loss... You can improve exist trading strategy or get new trading idea with the histogram of price. Outstanding features Support multiple time frame : you can choose to work with history data in any time frame you want. It does not depend on current display time frame. Support weighting by volume a
FREE
Los Patrones Armónicos son ideales para predecir puntos de giro en el mercado. Estos patrones ofrecen una alta tasa de éxito y numerosas oportunidades de operación en un solo día de trading. Nuestro indicador identifica los Patrones Armónicos más populares basados en los principios descritos en la literatura de Trading Armónico. NOTAS IMPORTANTES: El indicador no repinta, no se retrasa (detecta un patrón en el punto D) y no se redibuja (el patrón es válido o cancelado). CÓMO USARLO: Arrastre y s
FREE
(traducción de Google) Este indicador se basa en el “ Volumen segmentado en el tiempo (TSV) ” original desarrollado por Worn Brothers, Inc . Sin embargo, agregué algunas funciones adicionales a esta. Se puede elegir el precio que se aplicará, en lugar de tener solo el precio de cierre predeterminado utilizado por el original. También se puede elegir qué ponderación de volumen usar, incluido un pseudovolumen basado en el rango real, o ninguna ponderación de volumen. (Original text) This indicator
FREE
Los compradores de este producto también adquieren
Gann Made Easy
Oleg Rodin
4.93 (70)
Gann Made Easy es un sistema de comercio de Forex profesional y fácil de usar que se basa en los mejores principios de comercio utilizando la teoría del Sr. W. D. Gann. El indicador proporciona señales precisas de COMPRA y VENTA, incluidos los niveles de Stop Loss y Take Profit. Puede comerciar incluso sobre la marcha utilizando notificaciones PUSH. ¡Por favor, póngase en contacto conmigo después de la compra! ¡Compartiré mis consejos comerciales con usted y excelentes indicadores de bonificació
Atomic Analyst
Issam Kassas
5 (3)
En primer lugar, vale la pena enfatizar que este Indicador de Trading no repinta, no redibuja y no se retrasa, lo que lo hace ideal tanto para el trading manual como para el automatizado. Manual del usuario: configuraciones, entradas y estrategia. El Analista Atómico es un Indicador de Acción del Precio PA que utiliza la fuerza y el impulso del precio para encontrar una mejor ventaja en el mercado. Equipado con filtros avanzados que ayudan a eliminar ruidos y señales falsas, y aumentan el poten
ACTUALMENTE 26% DE DESCUENTO ¡La mejor solución para cualquier operador novato o experto! Este indicador es una herramienta única, de alta calidad y asequible porque hemos incorporado una serie de características propias y una nueva fórmula. ¡Con sólo UN gráfico puede leer la Fuerza de la Divisa para 28 pares de Divisas! Imagínese cómo mejorará su operativa porque podrá señalar el punto exacto de activación de una nueva tendencia o de una oportunidad de scalping. Manual del usuario: haga
Scalper Inside PRO
Alexey Minkov
4.75 (57)
An exclusive indicator that utilizes an innovative algorithm to swiftly and accurately determine the market trend. The indicator automatically calculates opening, closing, and profit levels, providing detailed trading statistics. With these features, you can choose the most appropriate trading instrument for the current market conditions. Additionally, you can easily integrate your own arrow indicators into Scalper Inside Pro to quickly evaluate their statistics and profitability. Scalper Inside
TPSpro RFI Levels
Roman Podpora
4.8 (15)
Reversal First Impulse levels (RFI)    INSTRUCTIONS        RUS       -       ENG              R ecommended to use with an indicator   -   TREND PRO -  Version MT5 A key element in trading is zones or levels from which decisions to buy or sell a trading instrument are made. Despite attempts by major players to conceal their presence in the market, they inevitably leave traces. Our task was to learn how to identify these traces and interpret them correctly. Main functions: Displaying active zones
Trend Punch
Mohamed Hassan
5 (6)
Manual guide:   Click here Starting price of  $88  for the first 25 copies only ( 1  left)! -- Next price is  $176 .  This indicator is unstoppable when combined with our other indicator called  Support & Resistance . After purchase, send us a message and you could get  it  for  FREE as a BONUS! I like to use Trend Punch on XAUUSD on the M1 timeframe!  Introducing Trend Punch , the revolutionary forex trend indicator that will transform the way you trade! Trend Punch is uniquely de
TPSproTREND PrO
Roman Podpora
4.78 (18)
TPSpro TRENDPRO  - is a trend indicator that automatically analyzes the market and provides information about the trend and each of its changes, as well as giving signals for entering trades without redrawing! The indicator uses each candle, analyzing them separately. referring to different impulses - up or down impulse. Exact entry points into transactions for currencies, crypto, metals, stocks, indices!  -  Version MT5               DETAILED DESCRIPTION                R ecommended to use with
Advanced Supply Demand
Bernhard Schweigert
4.92 (311)
¡Actualmente con 33% de descuento! ¡La mejor solución para cualquier tráder principiante o experto! Este indicador es una herramienta comercial única, de alta calidad y asequible, porque incorpora una serie de características patentadas y una nueva fórmula. Con esta actualización, podrá mostrar zonas de doble marco temporal. No solo podrá mostrar un marco temporal más alto, sino también mostrar ambos, el marco temporal del gráfico MÁS el marco temporal más alto: MOSTRANDO ZONAS ANIDADAS. A todos
Ante todo, vale la pena enfatizar que esta Herramienta de Trading es un Indicador No Repintado, No Redibujado y No Retrasado, lo que la hace ideal para el trading profesional. Curso en línea, manual del usuario y demostración. El Indicador de Conceptos de Acción del Precio Inteligente es una herramienta muy potente tanto para traders nuevos como experimentados. Combina más de 20 indicadores útiles en uno solo, combinando ideas avanzadas de trading como el Análisis del Trader del Círculo Interio
Gold Stuff
Vasiliy Strukov
4.89 (257)
Gold Stuff: un indicador de tendencia diseñado específicamente para el oro, también se puede usar en cualquier instrumento financiero. El indicador no se vuelve a dibujar ni se retrasa. El marco de tiempo recomendado es H1. Este indicador está escrito por EA Gold Stuff Advisor, puede encontrarlo en mi perfil. IMPORTANTE! Póngase en contacto conmigo inmediatamente después de la compra para obtener instrucciones y bonificación! PARÁMETROS Draw Arrow - incl.desactivado. dibujar flechas en el grá
TrendMaestro
Stefano Frisetti
5 (3)
note: this indicator is for METATRADER4, if you want the version for METATRADER5 this is the link:  https://www.mql5.com/it/market/product/108106 TRENDMAESTRO ver 2.4 TRENDMAESTRO recognizes a new TREND in the bud, he never makes mistakes. The certainty of identifying a new TREND is priceless. DESCRIPTION TRENDMAESTRO identifies a new TREND in the bud, this indicator examines the volatility, volumes and momentum to identify the moment in which there is an explosion of one or more of these data a
FX Volume
Daniel Stein
4.6 (35)
Obtenga su actualización diaria del mercado con detalles y capturas de pantalla a través de nuestro Morning Briefing aquí en mql5 y en Telegram ! FX Volume es el PRIMER y ÚNICO indicador de volumen que proporciona una visión REAL del sentimiento del mercado desde el punto de vista de un bróker. Proporciona una visión impresionante de cómo los participantes institucionales del mercado, como los brokers, están posicionados en el mercado Forex, mucho más rápido que los informes COT. Ver esta info
¡Descubra el secreto para el comercio de Forex exitoso con nuestro indicador MT4 personalizado! ¿Alguna vez se ha preguntado cómo lograr el éxito en el mercado de Forex, obteniendo ganancias constantemente al tiempo que minimiza el riesgo? ¡Aquí está la respuesta que ha estado buscando! Permítanos presentar nuestro indicador MT4 patentado que revolucionará su enfoque para el comercio. Versatilidad única Nuestro indicador está especialmente diseñado para usuarios que prefieren las formacio
Conviértase en un Breaker Trader y obtenga beneficios de los cambios en la estructura del mercado a medida que se invierte el precio. El indicador de ruptura de bloque de órdenes identifica cuándo una tendencia o movimiento de precio se acerca al agotamiento y está listo para revertirse. Le alerta sobre cambios en la estructura del mercado que generalmente ocurren cuando una reversión o un retroceso importante están a punto de suceder. El indicador utiliza un cálculo patentado que identific
Por supuesto, aquí tienes la traducción al español: Presentamos el Indicador de Astronomía para MT4: Tu Compañero Celestial Definitivo en el Trading ¿Estás listo para elevar tu experiencia de trading a alturas celestiales? No busques más allá de nuestro revolucionario Indicador de Astronomía para MT4. Esta innovadora herramienta trasciende los indicadores de trading tradicionales, aprovechando el poder de algoritmos complejos para proporcionarte una visión astronómica sin igual y cálculos de pre
Gann Swing Structure
Kirill Borovskii
5 (1)
This indicator is based on the mathematics of the great trader W.D. Ganna. With its help, you can easily find strong levels by analyzing swings to find the optimal entry point. The indicator works on all instruments and all timeframes. The indicator is fully manual and has control buttons. All you need to do is press the NEW button, a segment will appear, which you can place on any movement, swing or even 1 candle that you want to analyze. By placing the segment, press the OK button. A grid (th
Break and Retest
Mohamed Hassan
4.33 (12)
New update to V.4 where  Break & Retest automatically draws the take profit & stop loss levels and you also have more signals per day! ‍You can visually backtest Break & Retest to see how it behaved in the past!     Manual guide:   Click here $60 for a very limited time. Next price is $120   This Indicator only places quality trades when the market is really in your favor with a clear break and retest. Patience is key with this price action strategy! If you want more alert s
M1 Arrow
Oleg Rodin
5 (14)
Una estrategia intradía basada en dos principios fundamentales del mercado. El algoritmo se basa en el análisis de volúmenes y ondas de precios utilizando filtros adicionales. El algoritmo inteligente del indicador da una señal solo cuando dos factores de mercado se combinan en uno. El indicador calcula ondas de cierto rango en el gráfico M1 utilizando los datos del marco de tiempo más alto. Y para confirmar la onda, el indicador utiliza el análisis por volumen. Este indicador es un sistema come
Scalper Vault
Oleg Rodin
5 (29)
Scalper Vault es un sistema profesional de reventa que le brinda todo lo que necesita para una reventa exitosa. Este indicador es un sistema comercial completo que puede ser utilizado por operadores de divisas y opciones binarias. El marco de tiempo recomendado es M5. El sistema le proporciona señales de flecha precisas en la dirección de la tendencia. También le proporciona señales superiores e inferiores y niveles de mercado de Gann. Los indicadores proporcionan todo tipo de alertas, incluidas
FX Power MT4 NG
Daniel Stein
5 (10)
Obtenga su actualización diaria del mercado con detalles y capturas de pantalla a través de nuestro Morning Briefing aquí en mql5 y en Telegram ! FX Power MT4 NG es la nueva generación de nuestro popular medidor de fuerza de divisas, FX Power. ¿Y qué ofrece este medidor de fuerza de nueva generación? Todo lo que le encantaba del FX Power original PLUS Análisis de fuerza de ORO/XAU Resultados de cálculo aún más precisos Períodos de análisis configurables individualmente Límite de cálculo persona
¡Actualmente 20% OFF ! ¡La mejor solución para cualquier novato o trader experto! Este software funciona con 28 pares de divisas. Se basa en 2 de nuestros principales indicadores (Advanced Currency Strength 28 y Advanced Currency Impulse). Proporciona una gran visión general de todo el mercado de divisas. Muestra los valores de Advanced Currency Strength, la velocidad de movimiento de las divisas y las señales para 28 pares de divisas en todos los (9) marcos temporales. Imagine cómo mejorar
Dragon Multi Indicator MT4
Mansour Babasafary
5 (4)
3 Indicators in 1 indicator Strategy based on price action Made specifically for the best forex currency pairs Can be used in the best time frame of the market at a very reasonable price This indicator is basically 3 different indicatos . But we have combined these 3 indicators in 1 indicator so that you can use 3 indicators at the lowest price. All three strategies are based on price action. But based on different trends. Long term, medium term and short term Attributes : No repaintin
Currency Strength Wizard es un indicador muy poderoso que le proporciona una solución todo en uno para operar con éxito. El indicador calcula el poder de este o aquel par de divisas utilizando los datos de todas las monedas en múltiples marcos de tiempo. Estos datos se representan en forma de índice de moneda fácil de usar y líneas eléctricas de moneda que puede usar para ver el poder de esta o aquella moneda. Todo lo que necesita es adjuntar el indicador al gráfico que desea operar y el indicad
El sistema PRO Renko es un sistema de trading de alta precisión especialmente diseñado para operar gráficos RENKO. Se trata de un sistema universal que se puede aplicar a diversos instrumentos de negociación. El sistema neutraliza eficazmente el llamado ruido de mercado, lo que le brinda acceso a señales de reversión precisas. El indicador es muy fácil de usar y solo tiene un parámetro responsable de la generación de señales. Puede adaptar fácilmente la herramienta a cualquier instrumento com
Trend Screener
STE S.S.COMPANY
4.83 (88)
Indicador de tendencia, solución única e innovadora para el comercio y filtrado de tendencias con todas las funciones de tendencias importantes integradas en una sola herramienta. Es un indicador 100% sin repintar de marcos temporales y monedas múltiples que se puede usar en todos los símbolos/instrumentos: divisas, materias primas, criptomonedas, índices y acciones. Trend Screener es un indicador de seguimiento de tendencia eficiente que proporciona señales de tendencia de flecha con puntos en
TrendDecoder Premium
Christophe Pa Trouillas
5 (5)
Identifique los rangos y los próximos movimientos probables   |  Obtenga las señales más tempranas y la fuerza de las Tendencias   |  Obtener salidas claras antes de reversión   |  Detecte los niveles de Fibo que el precio pondrá a prueba Indicador no repintado y no retardado - ideal para la trading manual y automatizada - adecuado para todos los activos y todas las unidades temporales Oferta por tiempo limitado >>   50% OFF Después de la compra, póngase en contacto con mi canal  para conocer lo
El indicador de reversión de ADR le muestra de un vistazo dónde se cotiza actualmente el precio en relación con su rango diario promedio normal. Recibirá alertas instantáneas a través de una ventana emergente, correo electrónico o push cuando el precio exceda su rango promedio y los niveles por encima de su elección para que pueda saltar rápidamente a retrocesos y reversiones. El indicador dibuja líneas horizontales en el gráfico en los extremos del rango promedio diario y también extensiones p
Full Forex Market View Dashboard
Opengates Success International
5 (2)
VISTA COMPLETA DEL MERCADO FOREX Indicador del tablero Este es un indicador personalizado creado para brindar a los comerciantes una visión completa de lo que está sucediendo en el mercado. Utiliza datos en tiempo real para acceder al mercado y mostrar toda la información necesaria para realizar transacciones exitosas. INSTALACIÓN: Antes de adjuntar este indicador a su gráfico de ventana, vaya al panel Market Watch de su MT4 y OCULTE todos los pares de divisas que no necesita ni opere y
ECM Channel MT4
Paulo Rocha
5 (1)
ECM Elite Channel is a volatility-based indicator, developed with a specific time algorithm, which consists of finding possible corrections in the market. This indicator shows two outer lines, an inner line (retracement line) and an arrow sign, where the channel theory is to help identify overbought and oversold conditions in the market. The market price will generally fall between the boundaries of the channel. If prices touch or move outside the channel, it's a trading opportunity. The
Introduciendo       Indicador Quantum Trend Sniper   , el innovador indicador MQL5 que está transformando la forma en que identificas y negocias los cambios de tendencia. Desarrollado por un equipo de comerciantes experimentados con experiencia comercial de más de 13 años,       Indicador de francotirador de tendencia cuántica       está diseñado para impulsar su viaje comercial a nuevas alturas con su forma innovadora de identificar cambios de tendencia con una precisión extremadamente alta.
Otros productos de este autor
AccountQuickReport
Andrej Nikitin
5 (2)
The script creates account summary report in a separate window. The report can be created for all deals and on deals for selected financial instruments. It is possible to specify a time interval of calculation and save report to htm-file. The script creates account summary report in a separate window. The report can be created for all deals and for deals of the selected financial instruments. It is possible to specify a time interval of calculation and save report to htm-file. Input paramet
Ticks Bands
Andrej Nikitin
The Bollinger Bands indicator drawn using a tick chart. After launching it, wait for enough ticks to come. Parameters: Period - period of averaging. Deviation - deviation from the main line. Price levels count - number of displayed price levels (no levels are displayed if set to 0). Bar under calculation - number of bars on the chart for the indicator calculation. Buffer indexes: 0 - BASE_LINE, 1 - UPPER_BAND, 2 - LOWER_BAND, 3 - BID, 4 - ASK.
Ticks RSI
Andrej Nikitin
The Relative Strength Index indicator drawn using a tick chart. After launching it, wait for enough ticks to come. Parameters: RSI Period - period of averaging. overbuying level - overbought level. overselling level - oversold level. calculated bar - number of bars on the chart for the indicator calculation. The following parameters are intended for adjusting the weight of RSI signals (from 0 to 100). You can find their description in the Signals of the Oscillator Relative Strength Index section
Ticks Bars
Andrej Nikitin
4 (6)
This tick indicator draws synthetic bars/candlesticks that contain a definite number of ticks. Parameters: option prices - price option. It can be Bid, Ask or (Ask+Bid)/2. the number of ticks to identify Bar - number of ticks that form OHLC. price levels count - number of displayed price levels (no levels are displayed if set to 0 or a lower value). calculated bar  - number of bars on the chart. Buffer indexes: 0 - OPEN, 1 - HIGH, 2 - LOW, 3 - CLOSE.
FREE
TrailingStop MA
Andrej Nikitin
3.8 (5)
El indicador dibuja dos media móviles simples usando los precios High y Low. La línea MA_High se muestra cuando la media móvil se dirige hacia abajo. Se puede utilizarla para colocar la orden Stop para la posición de venta. La línea MA_Low se muestra cuando la media móvil se dirige hacia arriba. Se puede utilizarla para colocar la orden Stop para la posición de compra. Este indicador se utiliza en el Asesor Experto  TrailingStop . Parámetros Period - período de cálculo de la media móvil. Deviati
FREE
Ticks
Andrej Nikitin
4 (6)
A simple tick indicator of Bid and Ask prices. The period separator (1 minute) is displayed as a histogram. Parameters Show Bid Line - show/hide the Bid line; Show Ask Line - show/hide the Ask line; Show Labels - show/hide the last price values.
FREE
AccountQuickReport 4
Andrej Nikitin
5 (1)
The script creates account summary report in a separate window. The report can be created for all deals and for deals on selected financial instruments. It is possible to specify a time interval of calculation and save report to an htm file. Script inputs report starting date - initial report generation date. symbols selection for report - select a method of choosing tools for a report generation. allSymbol - report is generated for deals performed on all symbols. onlyCurrentSymbol - report
TrailingStop
Andrej Nikitin
5 (6)
This utility is used to visually choose an indicator for trailing stop and select its parameters. The Expert Advisor modifies the Stop Loss order position opened for the instrument of the current chart based on indicator values. Uses indicators Parabolic SAR , NRTR (Nick Rypock Trailing Reverse) , Moving Average or linear regression channel. The indicators are added to or removed from the chart using the 'show' checkbox. The following options are available: Parabolic - trailing stop based on t
TrailingStop MA 4
Andrej Nikitin
4 (3)
El indicador representa dos medias móviles sencillas según los precios High y Low. La línea MA_High se representa cuando la media móvil está dirigida hacia abajo. Puede ser usada para establecer una orden stop para una posición de venta. La línea MA_Low se representa cuando la media móvil está dirigida hacia arriba. Puede ser usada para establecer una orden stop para una posición de compra. El indicador se usa en el experto TrailingStop . Parámetros Period - periodo de cálculo de la media móvil
FREE
HistoryArrowRestore 4
Andrej Nikitin
4.67 (3)
The scripts adds order tracing icons in the chart window. Trace orders are similar to the standard terminal tracing. Icons are added for both closed orders and current (market) orders. The Days of history to check parameter means the depth of the order history to be traced (number of days). If the parameter value = 0, all orders in the available history will be traced.
FREE
Ticks RSI 4
Andrej Nikitin
The Relative Strength Index indicator drawn using a tick chart. After launching it, wait for enough ticks to come. Parameters: RSI Period - period of averaging. overbuying level - overbought level. overselling level - oversold level. calculated bar - number of bars on the chart for the indicator calculation. The following parameters are intended for adjusting the weight of RSI signals (from 0 to 100). You can find their description in the Signals of the Oscillator Relative Strength Index section
The Envelopes indicator drawn using a tick chart. After launching it, wait for enough ticks to come. Parameters: Averaging period - period of averaging. Smoothing type - type of smoothing. Can have any values of the enumeration ENUM_MA_METHOD . Option prices - price to be used. Can be Ask, Bid or (Ask+Bid)/2. Deviation of boundaries from the midline (in percents) - deviation from the main line in percentage terms. Price levels count - number of displayed price levels (no levels are displayed if
The Stochastic Oscillator indicator is drawn on the tick price chart. After launching it, wait for enough ticks to come. Parameters: K period - number of single periods used for calculation of the stochastic oscillator; D period - number of single periods used for calculation of the %K Moving Average line; Slowing - period of slowing %K; Calculated bar - number of bars in the chart for calculation of the indicator. The following parameters are intended for adjusting the weight of signals of the
The Moving Average Convergence/Divergence(MACD) indicator drawn using a tick chart. After launching it, wait for enough ticks to come. Parameters: Fast EMA period - indicator drawn using a tick chart. Slow EMA period - slow period of averaging. Signal SMA period - period of averaging of the signal line. calculated bar - number of bars on the chart for the indicator calculation. The following parameters are intended for adjusting the weight of MACD signals (from 0 to 100). You can find their desc
The Bollinger Bands indicator drawn using a tick chart. After launching it, wait for enough ticks to come. Parameters: Period - period of averaging. Deviation - deviation from the main line. Price levels count - number of displayed price levels (no levels are displayed if set to 0). Bar under calculation - number of bars on the chart for the indicator calculation. Buffer indexes: 0 - BASE_LINE, 1 - UPPER_BAND, 2 - LOWER_BAND, 3 - BID, 4 - ASK.
The Moving Average of Oscillator(OsMA) indicator drawn using a tick chart. After launching it, wait for enough ticks to come. Parameters: Fast EMA period - fast period of averaging. Slow EMA period - slow period of averaging. Signal SMA period - period of averaging of the signal line. calculated bar - number of bars for the indicator calculation.
Ticks CCI 4
Andrej Nikitin
The Commodity Channel Index(CCI) indicator drawn using a tick chart. After launching it, wait for enough ticks to come. Parameters: period - number of single periods used for the indicator calculation. calculated bar - number of bars for the indicator calculation. The following parameters are intended for adjusting the weight of CCI signals (from 0 to 100). You can find their description in the Signals of the Commodity Channel Index section of MQL5 Reference. The oscillator has required directio
Ticks ADX 4
Andrej Nikitin
The Average Directional Movement Index indicator drawn using a tick chart. After launching it, wait for enough ticks to come. Parameters: Period - period of averaging. Сalculated bar - number of bars on the chart for the indicator calculation. Buffer indexes: 0 - MAIN_LINE, 1 - PLUSDI_LINE, 2 - MINUSDI_LINE.
The Standard Deviation (StdDev) indicator drawn using a tick chart. After launching it, wait for enough ticks to come. Parameters: Period - period of averaging. Method - method of averaging. calculated bar - number of bars for the indicator calculation.
The Momentum indicator drawn using a tick chart. After launching it, wait for enough ticks to come. Parameters: period - period of the indicator calculation. levels count - number of displayed levels (no levels are displayed if set to 0) calculated bar - number of bars for the indicator calculation.
The Bulls Power indicator drawn using a tick chart. After launching it, wait for enough ticks to come. Parameters: Period - period of averaging. The number of ticks to identify high/low - number of single ticks for determining high/low. Calculated bar - number of bars for the indicator calculation. The following parameters are intended for adjusting the weight of Bulls Power signals (from 0 to 100). You can find their description in the Signals of the Bulls Power oscillator section of MQL5 Refer
The  Bears Power indicator drawn using a tick chart. After launching it, wait for enough ticks to come. Parameters: Period - period of averaging. The number of ticks to identify high/low - number of single ticks for determining high/low. Calculated bar - number of bars for the indicator calculation. The following parameters are intended for adjusting the weight of Bears Power signals (from 0 to 100). You can find their description in the Signals of the Bears Power oscillator section of MQL5 Refe
Tiks ATR 4
Andrej Nikitin
The  Average True Range (ATR)  indicator drawn using a tick chart. After launching it, wait for enough ticks to come. Parameters: ATR Period  - number of single periods used for the indicator calculation. The number of ticks to identify Bar  - number of single ticks that form OHLC. Price levels count  - number of displayed price levels (no levels are displayed if set to 0 or a lower value). price mode  - choice of prices under calculation (can be bid, ask or average). Сalculated bar  - number of
Tiks WPR 4
Andrej Nikitin
The  Williams' Percent Range (%R)  indicator drawn using a tick chart. After launching it, wait for enough ticks to come. Parameters: WPR Period  - period of the indicator. Overbuying level  - overbought level. Overselling level  - oversold level. price mode  - choice of prices under calculation (can be bid, ask or average). Сalculated bar  - number of bars for the indicator calculation. The following parameters are intended for adjusting the weight of WPR signals (from 0 to 100). You can find t
The  Price Channel  indicator drawn using a tick chart. After launching it, wait for enough ticks to come. Parameters: Period  - period for determining the channel boundaries. Price levels count  - number of displayed price levels (no levels are displayed if set to 0). price mode  - choice of prices under calculation (can be bid, ask or average). Bar under calculation  - number of bars on the chart for the indicator calculation. Buffer indexes: 0 - Channel upper, 1 - Channel lower, 2 - Channel m
Descripción: Abigail es un sistema comercial a medio plazo que saca beneficios de los movimientos retrocesivos de los precios. Este Asesor Experto (EA) está optimizado para trabajar con EURUSD pero puede trabajar sin problemas con otros pares de divisas. Puede estudiar las estadísticas de trabajo del EA con diferentes brokers, diferentes instrumentos financieros en la sección Señales de Trading para MetaTrader 4 y MetaTrader 5 . Parámetros: Control de riesgos: enter volume - volumen de la entrad
TimeFilter 4
Andrej Nikitin
TimeFilter indicator allows you to visually select bit masks (GoodHourOfDay, BadHoursOfDay, GoodDayOfWeek, BadDaysOfWeek) for the  Intraday Time Filter  module of trading signals of the Standard Library. The use of time filters allows you to take into account the particulars of each trading session in performing trading operations.
TimeFilter simple 4
Andrej Nikitin
1 (1)
The indicator is an inter-week hourly filter. When executing trading operations, the indicator allows considering time features of each trading session. Permissive and restrictive filter intervals are set in string form. The used format is [first day]-[last day]:[first hour]-[last hour]. See the screenshots for examples. Parameters: Good Time for trade - intervals when trading is allowed. Bad Time for trade - intervals when trading is forbidden. time filter shift (hours) - hourly shift. percent
TrailingStop 4
Andrej Nikitin
4.83 (6)
El EA modifica el nivel de Stop Loss de la posición abierta (en el instrumento actual). El SAR Parabólico , NRTR (Nick Rypock arrastre reversa) , se utilizan indicadores de MA o la regresión lineal del canal . Modos conmutables: Trailing stop sólo cuando se obtienen ganancias; Trailing stop solamente al precio; Trabajar en cada tick o en barras (formadas) completadas; Trailing para cada orden o la posición acumulativa.
PositionGroupClose 4
Andrej Nikitin
5 (1)
The EA performs trade operations of closing position groups. Positions are grouped by type. It is possible to select orders by the profit (loss) value. It is possible to form the closure groups manually. You can set a value for automatic closure of a positions group after reaching a certain profit/loss level or price level. The additional functions of the EA are called using the hot keys: SHIFT+A - show/hide Auto exit options. SHIFT+S - show/hide Settings panel. SHIFT+V - sound ON/OFF. SHIFT+I -
Filtro:
d_miki
38
d_miki 2023.07.16 04:14 
 

指標発表の直前・直後などでは、すべてのトレーダーの息遣いが伝わってくるようで面白い

avdeev403
14
avdeev403 2022.03.27 12:13 
 

Разделители в отдельном окне индикатора так же отображаются и в основном окне графика, это мешает. Немного переписал код добавил пятизнак и линию Bid в индикатор.

Andrei
836
Andrei 2017.11.09 15:43 
 

El usuario no ha dejado ningún comentario para su valoración

Maksym Mudrakov
29227
Maksym Mudrakov 2016.08.31 18:15 
 

El usuario no ha dejado ningún comentario para su valoración

Vadim Strelkov
7710
Vadim Strelkov 2014.05.12 13:03 
 

El usuario no ha dejado ningún comentario para su valoración

Respuesta al comentario
Versión 1.12 2021.11.17
Compile application in the latest platform build.
Versión 1.1 2015.03.19
Bug fixes