TrendMaestro
- 指标
- Stefano Frisetti
- 版本: 2.3
- 更新: 18 三月 2024
- 激活: 10
note: this indicator is for METATRADER4, if you want the version for METATRADER5 this is the link: https://www.mql5.com/it/market/product/108106
TRENDMAESTRO ver 2.4
TRENDMAESTRO recognizes a new TREND in the bud, he never makes mistakes. The certainty of identifying a new TREND is priceless.
DESCRIPTION
TRENDMAESTRO identifies a new TREND in the bud, this indicator examines the volatility, volumes and momentum to identify the moment in which there is an explosion of one or more of these data and therefore the moment in which prices have strong probability of following a new TREND. TRENDMAESTRO never misses a beat, he always identifies a new TREND in the bud without error. This indicator facilitates the reading of charts on METATRADER; on a single window you can call up 28 charts of the FOREX MAJOR 8, the most interesting for me, and you can analyze them with one click, whatever the trading strategy or technical analysis you use.TRADING with TRENDMAESTRO
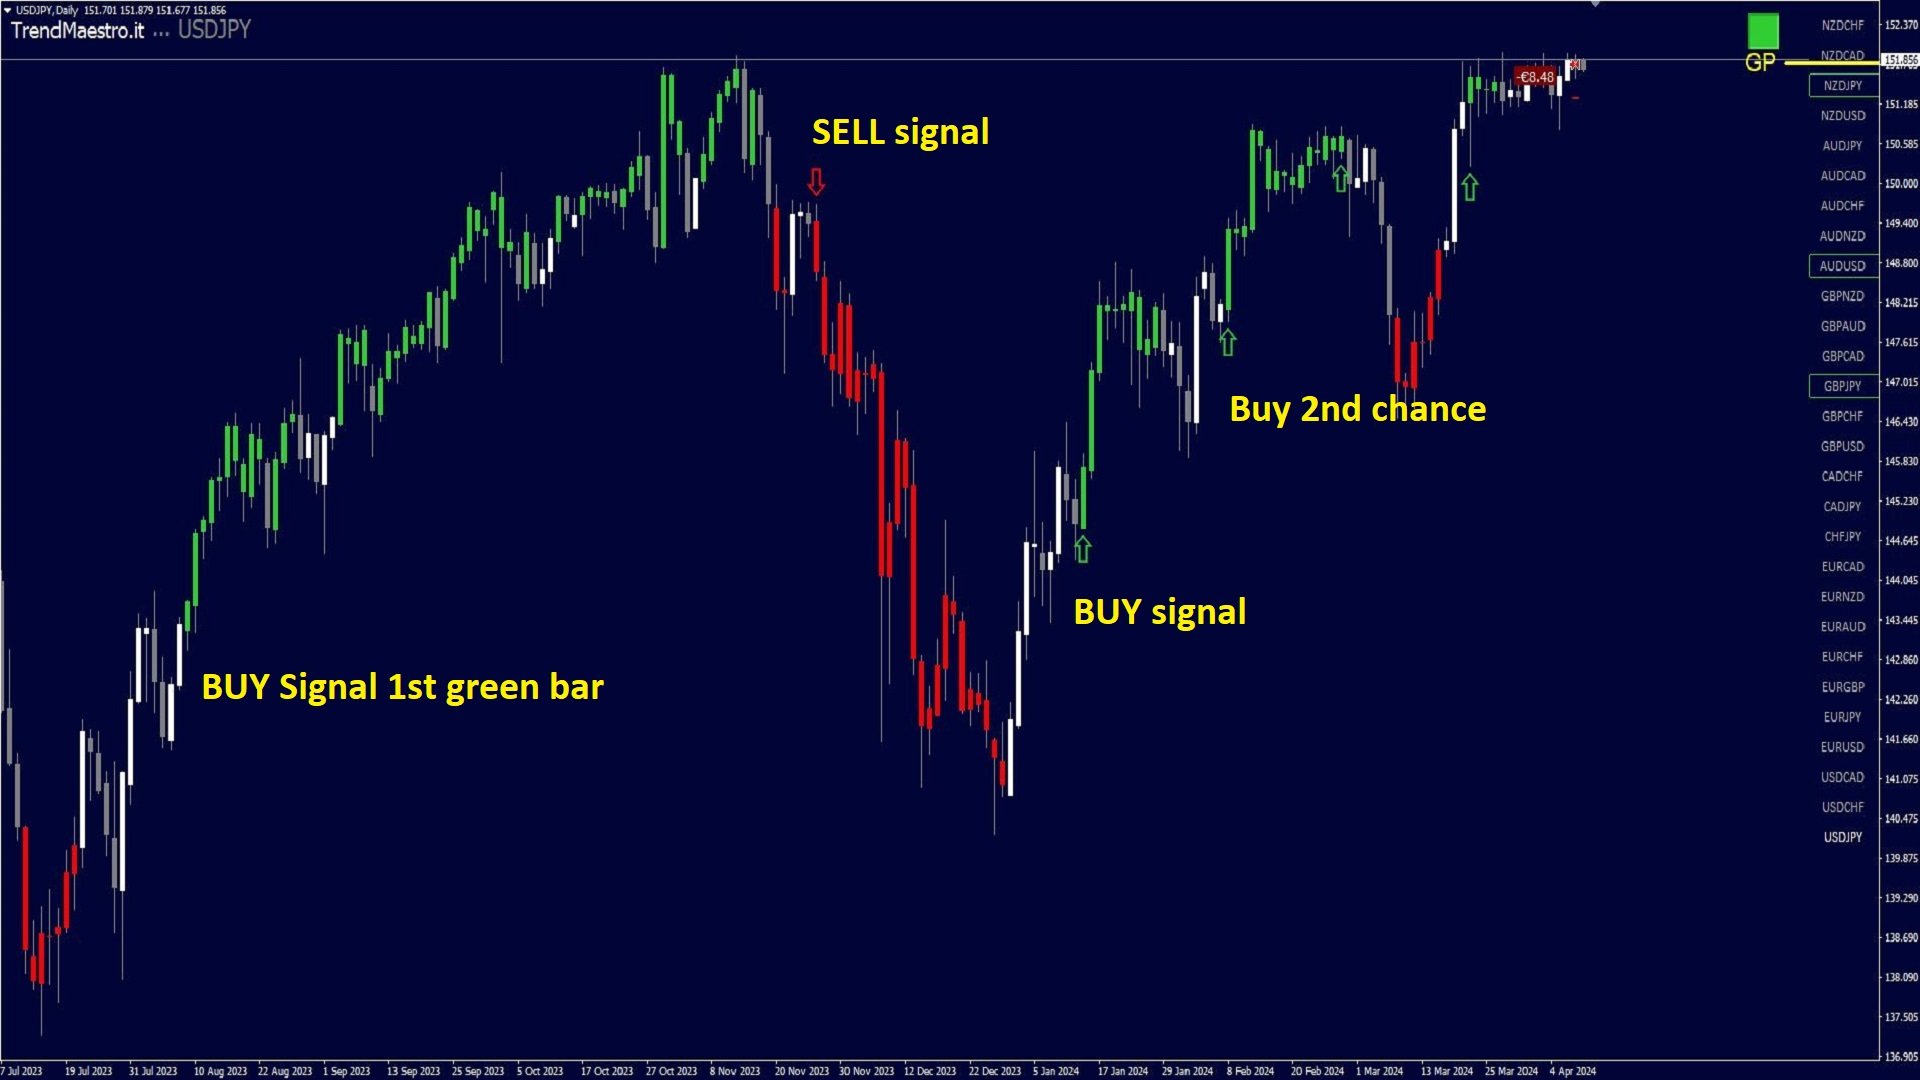
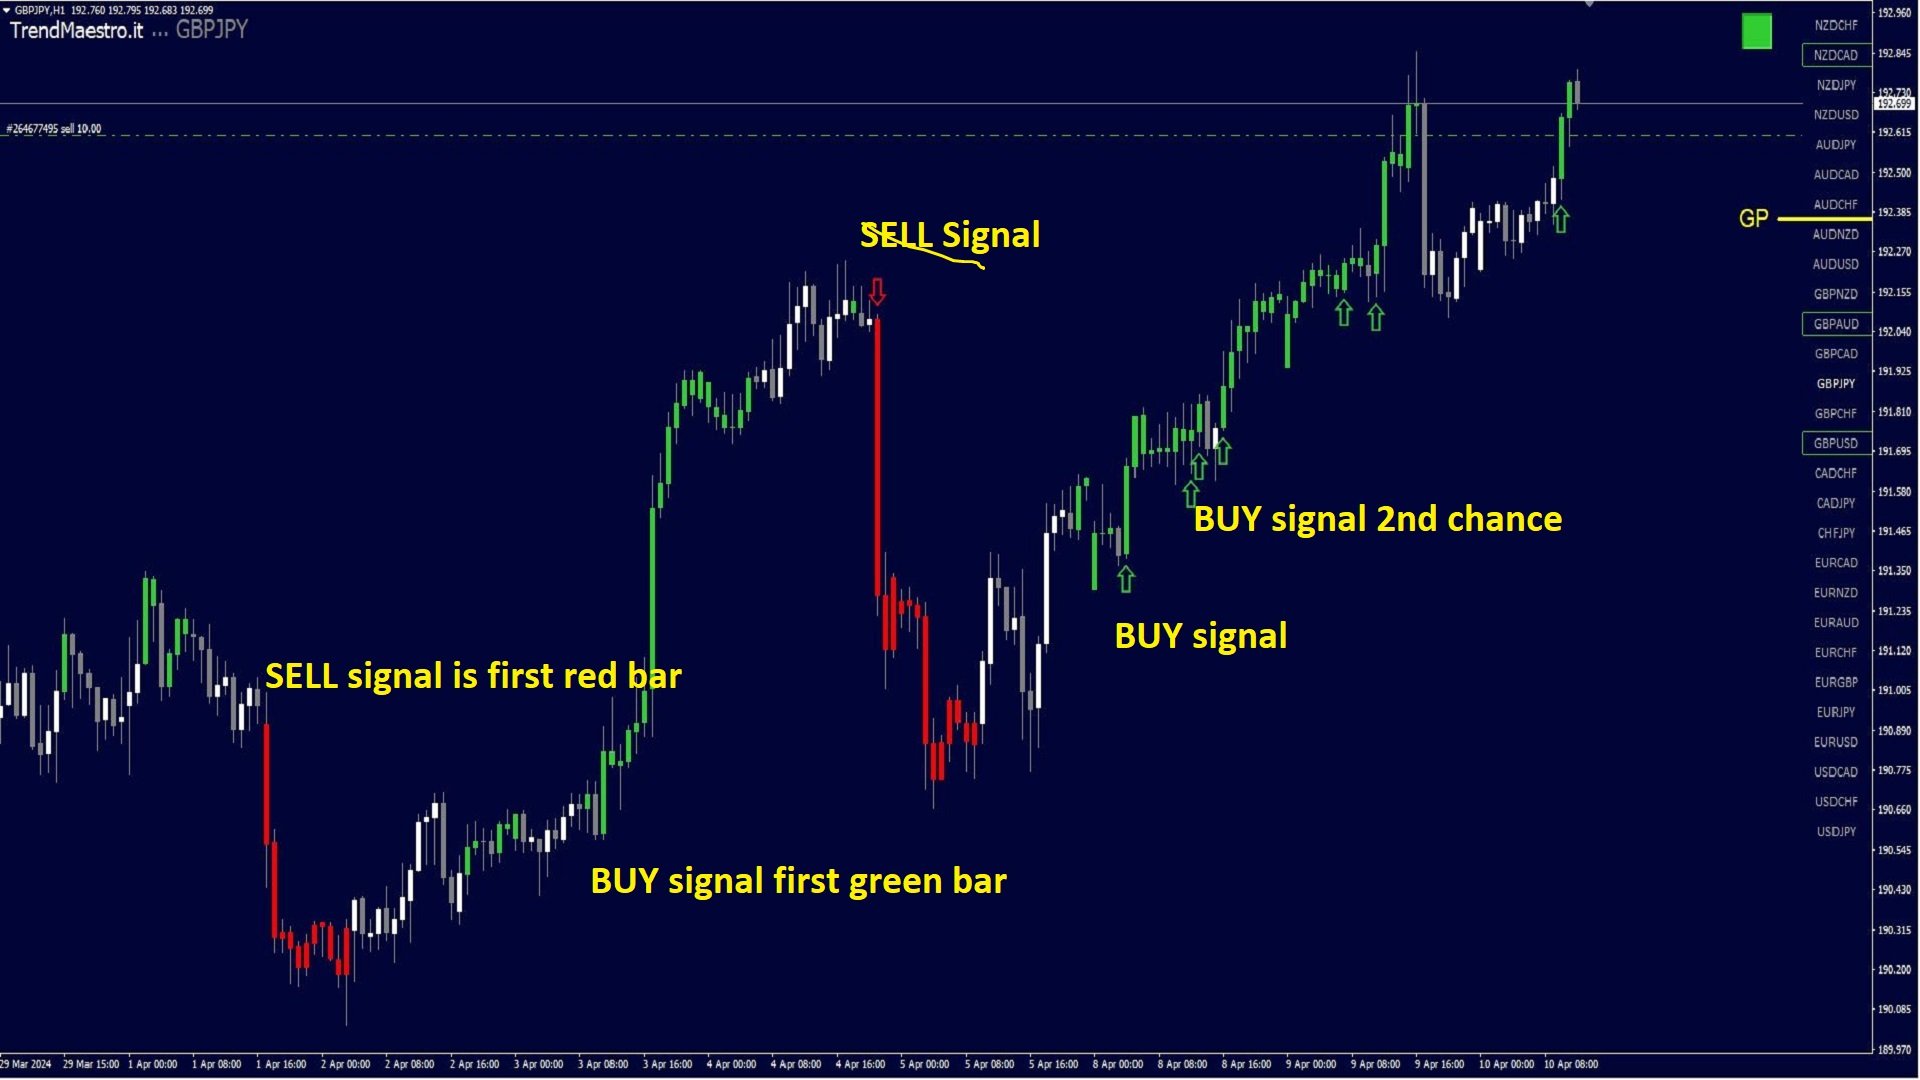
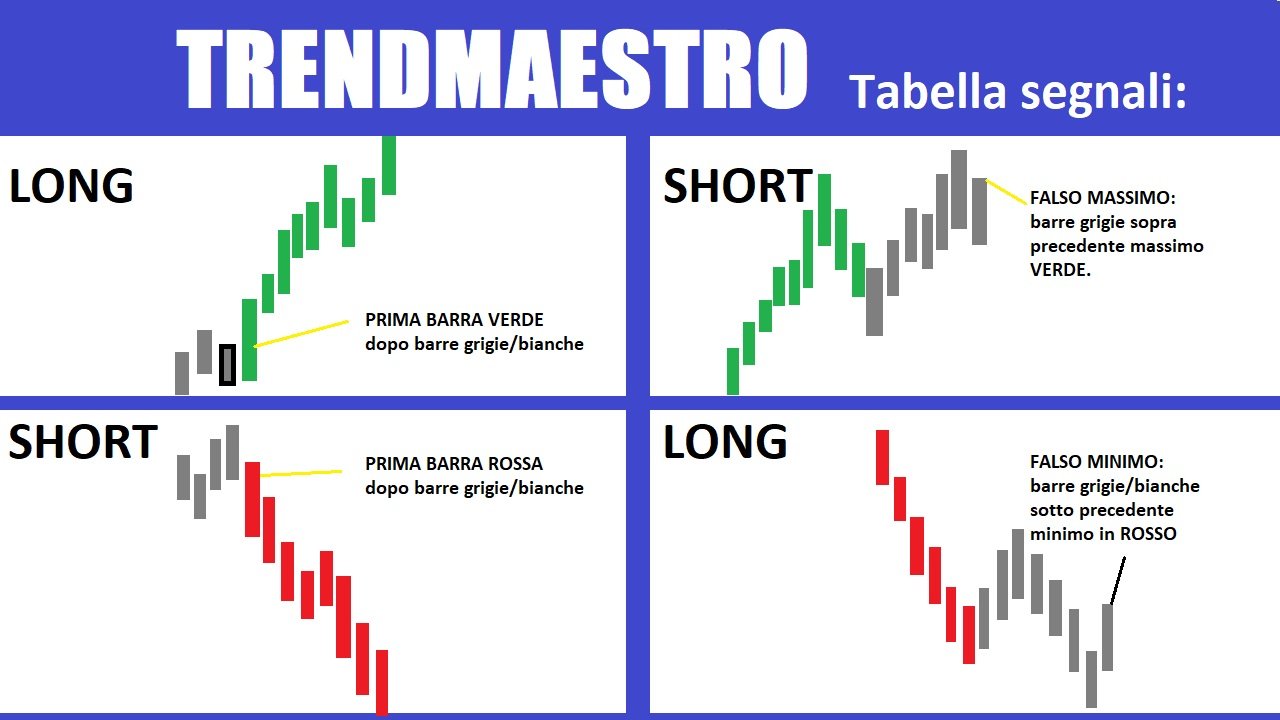
The signal is simple and immediate: at the first green bar I can evaluate a LONG at the first red bar a SHORT, while the gray and white bars mean no signal and therefore waiting. So the first colored bar is the explosion of volumes and/or volatility and is the one that gives the signal that I can decide to follow. I can decide whether to open a new LONG TRADE at the close of the first GREEN bar and a new SHORT TRADE at the close of the first RED bar. To close the TRADE I can put the TP or SL on the white balls or if I want a quicker TRADE I can close the TRADE on the first white or gray bar after I entered.SETTINGS and INPUT
The DEFAULT settings are good for all ASSETs, this indicator can be used on all listed assets, futures, shares, forex, commodities, crypto, bonds, any asset. By DEFAULT the list includes 28 FOREX pairs, but it is possible to modify the list on the INDICATOR settings and add ACTIONS, COMMODITIES etc..etc...DISTRIBUTION
- all rental and purchase licenses include: 10 activations - no time limit for installations if purchased. - YOUTUBE Channel: https://www.youtube.com/c/SFSCALPER - for contacts: sfscalper.com@gmail.com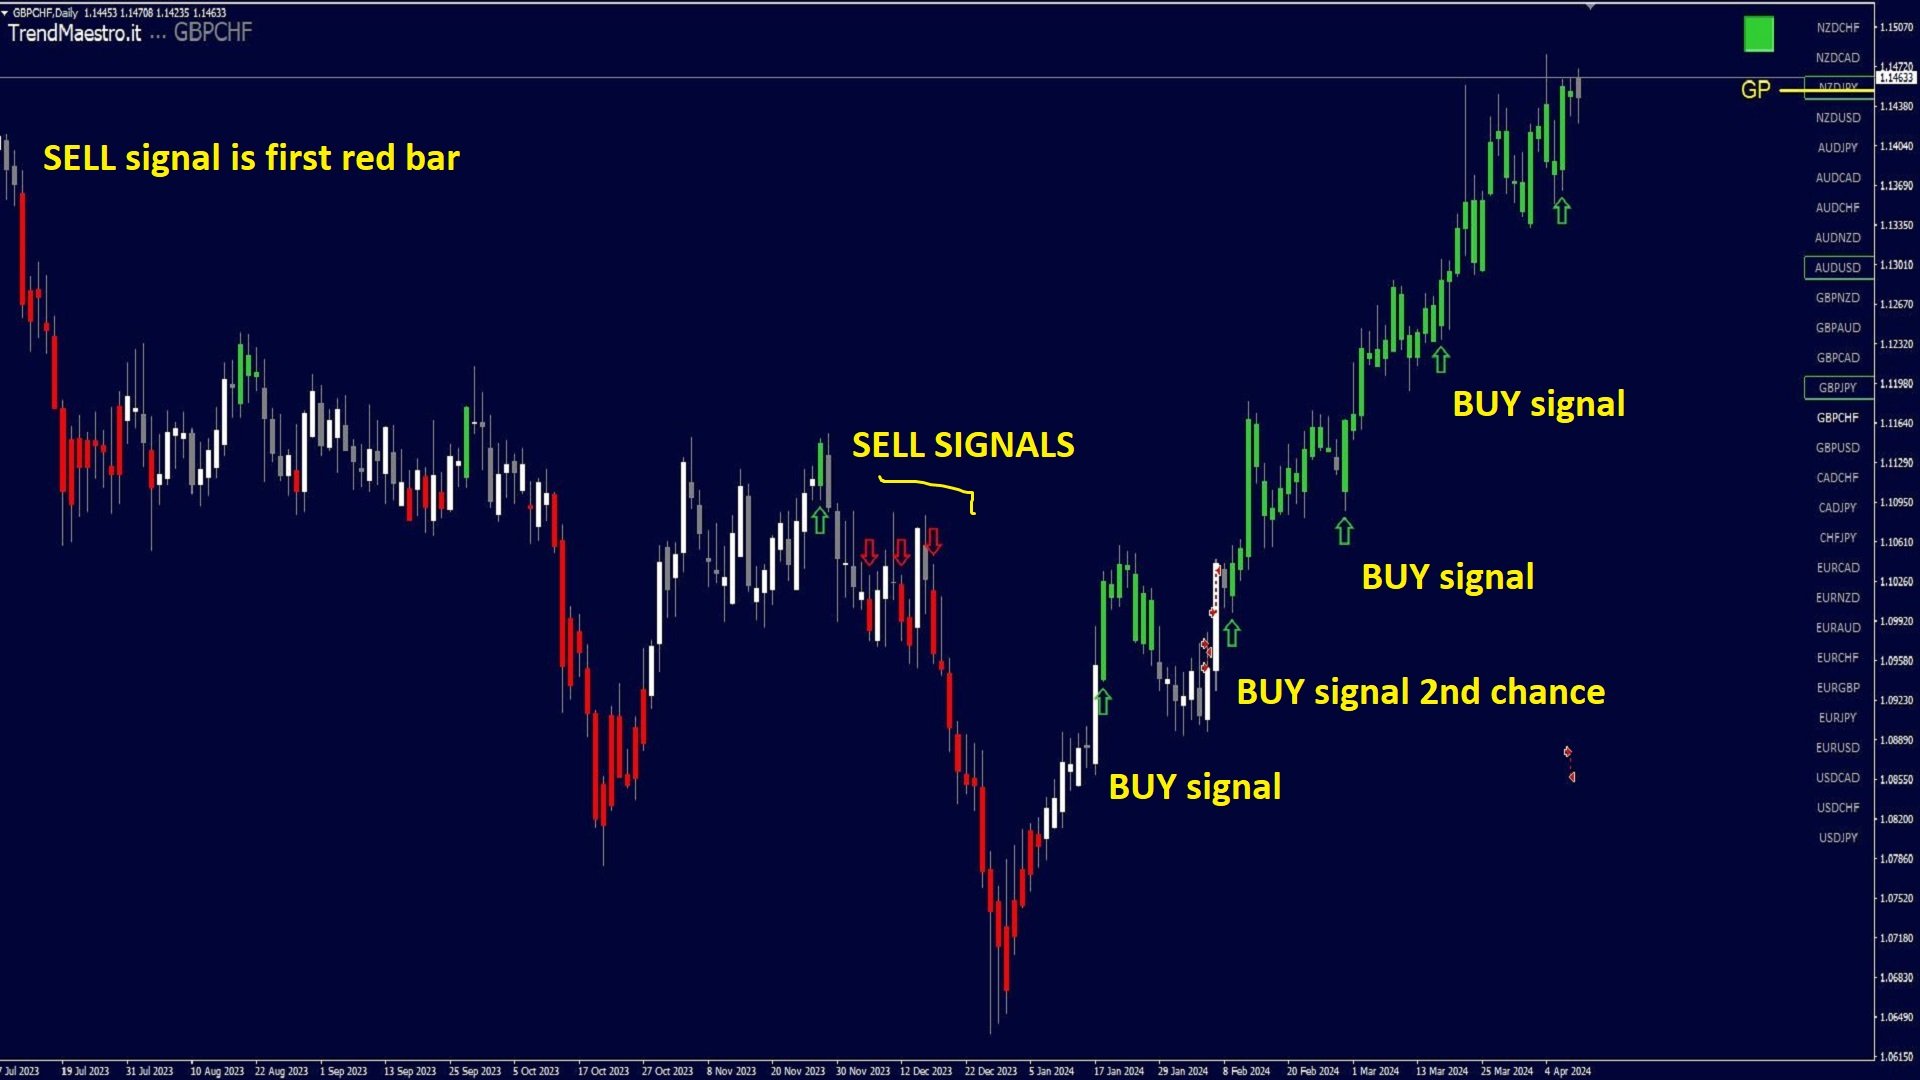
I'm a fairly novice trader, yet seriously trying to get a good understanding of it. The TrendMaestro is perfect for me, as it will be for more seasoned traders. It's simplicity is by no means a reflection of the underlying signals that come together to make calls about trend movements. Find the timeframe that suits your trading style and personality. I for one am not patient enough for a daily timeframe, hourly suits me better. I cannot recomment the TrendMaestro enough. Questions to Stefano are promptly answered and I'm sure once I get to know this indicator longer even more of it's value will become apparent. A must have in my book! (There is an accompanying YouTube chanel by the author with live trading comments as well.)