适用于MetaTrader 5的EA交易和指标 - 160

Trading signals are calculated using sma moving averages and last candle - the H1 period. Options: Lots - Lot size (if useCalcLot is false 1 lot used); useCalcLot = true riskpercentage =5 shortSmaPeriods = 50 longSmaPeriods = 200 useStopLoss = true stopLossPips = 100 useTakeProfit = true takeProfitPips = 300 useTrailingStop = true trailingStopPips = 120 Recommended currency pairs EURUSD - H1 period .

Приветствую тебя, мой контрагент на FORTS))) За 8 лет работы в офисе брокерской компании и 12 лет активного трейдинга я реализовал стабильную стратегию в робота. Если техническим языком, то этот робот торгует ретест уровня/двойное дно/вершину и прочие фигуры тех.анализа. Настройки советника позволяют ему определить экстремум перед разворотом движения и войти в сделку в самой выгодной точке.
Посмотри, Друг мой, внимательно параметры и сразу сможешь его настроить. Удачи тебе и профита! (ОБРАТИ

Read Elliott wave principle automatically. With the Swing Reader, you can easily read the Elliott Wave Principle through an automatic system. With swing, we mean a ZigZag market that is created by a breakout of its standard deviation. You can set the deviation manually, or you can let the indicator do it automatically (setting the deviation to zero).
Advantages you get Never repaints. Points showing a horizontal line, in which statistically a long wave ends. Candles showing a vertical line in

ZhiBiTMG是一款集合了趋势和马丁格尔的指标,适合所有的市场品种和所有图表周期。 市面上很多指标违背了趋势却声称很准确,但是真的准确吗?其实都不准确!因为市场必须顺势而行。 这款ZhiBiTMG指标就是在趋势的前提下,给出马丁格尔信号。这样才能顺应市场规律。 使用说明: 红色线是向下的趋势线(Sell),一共三条线;默认情况下,只打开了两条线的下单信号,也可以在参数里面打开或关闭任意一条线的下单信号。 蓝色线是向上的趋势线(Buy),一共三条线;默认情况下,只打开了两条线的下单信号,也可以在参数里面打开或关闭任意一条线的下单信号。 参数说明: 【Arrow_Sell_Down_1】:第一条向下趋势线的下单信号开或关,默认是开的状态; 【Arrow_Buy_UP_1】:第一条向上趋势线的下单信号开或关,默认是开的状态; 【Arrow_Sell_Down_2】:第二条向下趋势线的下单信号开或关,默认是开的状态; 【Arrow_Buy_UP_2】:第二条向上趋势线的下单信号开或关,默认是开的状态; 【Arrow_Sell_Down_3】:第三条向下趋势线的下单信号开或关,默认是关的状态;

Features Start point of VWAP movable. 7 types of VWAP calculation methods: close, open, high, low, average price, typical price and weighted close. 2 types of volume calculation: ticks or real volume. Thus, the indicator works in any market, for example: stocks, futures, forex, commodities, etc. Color, line style, and line width of the customizable VWAP. Label that show the current VWAP price. VWAP breakout alert that can be enabled or disabled. 2 types of methods to trigger the breakout alert:

Features 3 types of boxes: bullish, bass and unknown. The unknown box arises when prices move in the opposite direction of the current box. Allows you to set the required points for the box change. Lets you set both the box border types and colors or background color. Label that shows the box reversal points. Lets you set the size, color, corner position, and vertical label margin. Input Parameters Tab Reversal Points. Limit in points in the opposite direction to change boxes. Bulls Box Color -

Indicador en base a la pendiente de la linea de precio, dibuja una línea de color cuando sube a base de los precios que previamente has sido procesados o linealizados, y cuando baja la pendiente la linea linealizada toma otro color. En este caso se a considerado 6 lineas de diferentes procesos desde pendientes largas hacia las cortas, observándose que cuando coincidan las pendientes se produce un máximo o mínimo, lo que a simple vista nos permitirá hacer una COMPRA O VENTA.
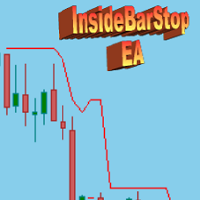
This Export Advisor implements the trailing stop algorithm "Trailing Stop with Inside Bars" that was suggested by the famous German trader and author Michael Voigt ("Das grosse Buch der Markttechnik") to capture robust gains when trading strong price moves. It is used for semiautomatic trading. You open a position manually and apply the expert to the chart. It modifies your order by setting a stop loss according to the trailing stop algorithm. Your trade direction (Long/Short) is detected automa

Features 3 types of waves: bullish, bearish and unknown. The unknown tower comes when prices move in opposite the direction of the current tower. Label that shows the percentage remaining for the next tower. Allows you set the type of volume that will be accumulated in the towers, either real or tick volumes. Thus, the indicator works in any market, for example: stocks, futures, forex, commodities, etc. Allows you to set the required score for the tower exchange. Allows you to set the font size

****************************************************** SIGNAL: https://www.mql5.com/zh/signals/586055 this is an Arbitrage system which base on EURUSD EURGBP GBPUSD you need a smallest spread and lowest ping account like ECN. I run it on icmarket and tester in icmarket history data run it on any chart then it will trade on EURUSD EURGBP GBPUSD when sign has checked ****************************************************** attention:it is cannot run on GBPUSD M30 chart.

Индикатор показывает развороты рынка в виде стрелок. Разворотные сигналы основаны на моих личных наблюдениях за поведением рынка. В основу взяты такие принципы как поиск экстремумов, объемы и Price Action. Индикатор дает сигналы на следующих принципах: Поиск окончания тенденции на рост/снижение рынка Поиск модели разворота на основе Price Action Подтверждение разворота объемом контракта. Также в индикатор встроен сигнал при появлении стрелки. Индикатор не перерисовывается. Индикатор не перерисов
SymbolAutoChanger PRO MT5 There is also version for MetaTreader4 This tool allows you to automatically change the chart symbols in a row. Example: EUR → GBP → JPY → CHF → CAD → AUD → NZD You need only to set up interval in seconds between auto switch. Also, you can choose whether to switch between all symbols provided by your broker or only between symbols available in the Market Watch window.
PRO version has following featuters: Next button Previous button Pause/Continue botton With this e

References: "A Modern Adaptation of the Wyckoff Method" "The Secret Science of Price and Volume" "Trades About to Happen" To know more, search on the internet: "The Wyckoff Method", "Weis Wave" and "Volume Spread Analysis"; Features 3 types of waves: bullish, bearish and unknown. The unknown wave comes when prices move in opposite the direction of the current wave. Label that shows the percentage remaining for the next wave. Allows you set the type of volume that will be accumulated in the wave

Scalper Private Expert Advisor 可以在任何交易模式下工作,从剥头皮开始,以及中长期操作模式,这一切都取决于 Expert Advisor 的设置。 顾问设置说明: Time_next_order - 下一个订单将打开的时间(以秒为单位) 大量 - 大量订单 TakeProfit - 利润水平 止损 - 损失水平 Time_close_order - 关闭盈利订单的时间(以秒为单位) MagicNumber - 顾问订单标识符 TrailingStop - 开始拖网的参数,以点为单位 TrailingStep - 拖网步骤,以点为单位 滑点 - 最大允许滑点 countPOS - 限制同时打开的订单数量 Trigger_threshold - 开单参数,以点数为单位

This long-term trading system works on 12 pairs and 4 timeframes . The Expert Advisor uses various trading systems, such as trend trading, counter-trend trading and others. This increases the chances of sustained growth and reduces exposure to a single pair or individual operations. The risk is tightly controlled.
/>
The EA has the built-in smart adaptive profit taking filter. The robot has been optimized for each currency and timeframe simultaneously. It does not need arrival of every tick

Estratégia Bandas de Bollinger (“Estratégia da Paula”)
Estratégia A estratégia desse robô é baseada no retorno as médias, operando o indicador Bandas de Bollinger. Essa estratégia é popularmente conhecida como “Estratégia da Paula”. Basicamente o robô fica monitorando barras que rompam a Banda de Bollinger (tanto a superior quanto a inferior) para depois voltar para dentro da Banda na próxima barra. Se a condição acima for satisfeita, considerando também os demais parâmetros do robô, o mesmo

What is this: Violent trading: means sending a large number of orders to your brokerage server, it can conduct a stress test of the trading. In this program you can run a variety of trading tests. Now you can trade at high speed, For example 1000 orders in an instant. The Demo version's link: https://www.mql5.com/en/market/product/38431/ Why to use: Whether manual trading or EA trading, the status of the broker server is very important. So it is beneficial to conduct a trading stress test on

Funciona identificando picos de máximos y mínimos, para luego eliminarlos haciendo una linea o curva, pudiendo el usuario ingresar el valor de que tanto puede suavizar. Nos facilita poder ver la tendencia así como ver el cruce que puede hacer con otros indicadores, mostrando a simple vista los inicios y salidas de una tendencia u operación. Así también facilita la visualización de subidas y bajadas.
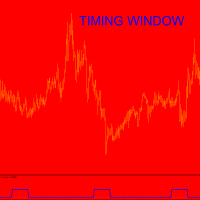
As for the cycle discussion, I invite you to read the TimingCycleWithLLV indicator presentation ...please ask me if something is not clear. I think that time is much more important than price;this is the reason for wich I trade only when one cycle finishes and the new one start. WHAT is Timing Window? It is a certain number of bars within which inversion is probable I do not know how much inversion will be....how many pips,BUT market will inverts with high probability.Time for inversion is ok. S
- 让您的机器人操作并开始工作! - 期货市场的日间交易 - 指数和美元合约 - 该机器人还可与任何其他BM&F资产(PETR4,VALE3等)配合使用 - 在Metatrader 5(免费平台)上运行的机器人 - 它有利于趋势。如果市场继续上涨,机器人将购买更多合约,如果下跌,它将卖出更多合约。目标经常在一天的凌晨被打败 - 这是一个机器人,你可以设置你的每日目标的钱(雷亚尔R $) - 基于蜡烛数量的策略 - 可以同时在多个帐户中使用 - 机器人可以在不同的时间范围内同时用于多个图表 - 提示:在使用真实账户之前,请在模拟账户中使用它,以获得使用机器人的经验
输入参数:
- 图形时间 - 入境时间表 - 截止收盘时间 - 操作结束时间 - 蜡烛数量 - 合同或股份数量 - 滑点 - 每日货币利润 - 每日货币损失
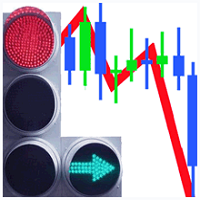
The SemiScalpel Expert Advisor is a semi-scalping system which analyzes the market using an oscillator. During tests use the "Every tick" mode. The expert works only with accounts like "Netting" Adjust StopLoss , TakeProfit , TrailingStart , TrailingBreakeven and TrailingStop to set the system operation mode: scalping or standard. Simple overbought/oversold levels are used. You can use one of the indicators (select the value of the Signal parameter): RSI CCI WPR DEM MOM RVI
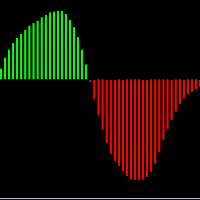
É um indicador oscilador baseado no "MACD" convencional porém com suavização . Através desse indicador você será capaz de operar sem os ruídos produzidos pelo indicador "MACD" convencional. Em quais ativos o indicador funciona: Em qualquer ativo do mercado, tanto em forex, como B3 ou binárias. Qual é o novo parâmetro: Smooth Period ou período de suavização, que representa o período que será suavizado no "MACD".

Use of support and resistance in systematic trading is very subjective. Every trader has their own idea and way to plotting the support and resistance levels on the chart. KT Support and Resistance indicator take out this ambiguity out of the situation and automatically draws support and resistance levels following an algorithmic approach using a unique multi-timeframe analysis.
When launched on the chart, It immediately scan the most significant extreme points across all the available timefr
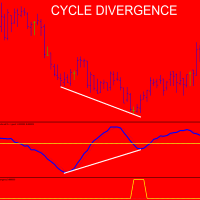
Please,put CycleDivergence in the same folder of TimingCycleWithLLV otherwise it does not run. As for the cycle discussion, I invite you to read the TimingCycleWithLLV indicator presentation ...please ask me if something is not clear. I think tha time is much more important than price;this is the reason for wich I trade only when one cycle finishes and the new one start. In order to use the CycleDivergence indicator follow these steps: 1) for example (see imagine number four) 1 minute chart,in t

Indicador multi-nivel y multi-timeframe que permite seguir la tendencia del precio de cualquier par de divisas, metales, acciones, CFD's, etc. Intuitivo y fácil de aplicar sobre cualquier gráfico.
Parámetros: Timeframe : Marco de tiempo que se le aplicará al nivel Period : Periodo que se aplicará Applied Price : Precio a aplicar
Aplicaciones: Se puede usar aplicando diferentes niveles sobre el mismo gráfico, por ejemplo, in nivel de 8, 14, 20, etc.

The Expert Advisor works with ticks, calculates volatility and operates in the volatility working range. After that, the EA defines price deviation from the price balance level and starts working in the direction set in the input parameters and on the appropriate levels that are also specified in the inputs. Setting (by default) is displayed in the screenshot. Before working in real time, optimize a month on every tick ! The optimization setting is provided. It is enough to optimize the EA once

İlk süreç, pazarın yorgunluk semptomlarını bolinger bandı ve hareketli ortalama göstergeleri ile tespit etmekle başlar. İşlem beklendiği gibi gitmezse, ikinci işlem başlar. İşlemi Avrupa ve ABD oturumları için makul bir kar veya zararla kapatır. eurusd 1 saat kullanılır. Ayda 3 veya 4
Sihirli numara = sihirli sayı inp1_TimeStart = Zaman Başlangıcı inp1_TimeEnd = Zaman Sonu inp5_VolumePercent = Birim Yüzde Satın Al inp11_mmMgInitialLots = mm MgInitia lLots satın al inp11_mmMgMultiplyOnLoss

Using the basic principles that allow scientists to report a tsunami a few minutes before it happens (tested during a period of almost 10 years), we have designed an algorithm able to perceive its wave length, amplitude, height, rate, period and acceleration.
This allows our Expert Advisor (EA) to make transactions or to send automatic signals for up to 5 currency pairs (EUR/USD, USD/CHF, AUD/USD, USD/CAD, USD/MXN). In other words, our algorithm identifies the main trend through the result
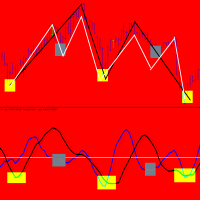
TimingCycleWithLLV is an excellent tool to determine the timing of your entry point! Everyone knows that cycles exist both in nature and in financial markets.Cycles are present in all time frames,from 1 minute to 1 year.Sometimes they are very clear to identify,others there is overlap between cycles of varyng duration. I can say this:the one-day cycle corresponds to the duration of a trading day( for example the one-day cycle for GERMAN DAX index is 14 hours as the trading day is 14 hours). Obvi

In spite of a very simple indicator, it assists the trader who is eventually positioned several days in an operation if the asset swap is for or against its operation.
It is the ideal indicator for long-term operators.
The Swap is the rate that the operator pays for being positioned from one day to another or sometimes from week to week.
There are strategies that, besides a setup and risk management, also contemplate operating in favor of the Swap.
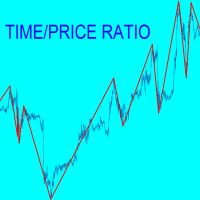
A chart is made by price and time but many traders consider only price.For each swing TIME-PRICE RATIO indicator shows in real time ratio between price/time and time/price. Moreover in the past you can read for each swing :number of pips;number of bars;ratio P/T and ratioT/P. Why it is usefull? because when P/T or T/P is a fibonacci ratio,the probabilities increase for inversion near support/resistance lines.During swing formation an audible alarm and a warning window advise you that a fibonac

Better Scroll 在您滚动时启用和禁用 MT5 的 AutoScroll 功能,使该功能感觉更加直观和方便。 您不再需要手动启用和禁用 AutoScroll 或让它将您带到图表的末尾,因为您在回测或查看历史价格数据时忘记将其关闭。 概括
在以下情况下禁用自动滚动:
鼠标单击+向左拖动(过去当前打开的蜡烛) 鼠标滚轮向左滚动(过去当前打开的蜡烛) 按下 Page Up 键 按下主页键 按下左箭头键(过去当前打开的蜡烛) 市场关闭
在以下情况下启用自动滚动: 鼠标单击+向右拖动(到当前打开的蜡烛) 鼠标滚轮向右滚动(到当前打开的蜡烛) 按下 Page Down 键(当前打开的蜡烛) 按下结束键 按下右箭头键(当前打开的蜡烛) 请务必查看我的其他实用程序,这些实用程序将提高 Metatrader 5 的生活质量!

First thirty minutes are essential for a trading session. The early reaction of traders and market players sets a path for the rest of the day. KT London Breakout EA takes advantage of this phenomenon, and after analyzing the first thirty minutes of London session, it places two bidirectional pending orders. One of pending order is eventually canceled after realizing the market direction with certainty.
It has been strictly tested and developed for EUR/JPY using 30-Min Time Frame. You can ex

Это полностью автоматизированный советник. Данный советник использует данные индикаторов SAR, ADX, EMA, SMA c некоторыми дополнениями. Не использует Мартингейл. Убыточные сделки пытается закрыть за счет прибыли прошлых сделок. При наличии на счете других открытых сделок или при ручном открытии сделок - сам закроет их при достижении прибыли. Советник использует виртуальные stoploss и takeprofit. Рекомендуется работа на нескольких валютных парах одновременно (не менее 5) Торговое плечо: от 100 д

The Expert Advisor uses the strategy based on the breakdown of the most important support and resistance levels. Adaptive trade trailing algorithm is used. The EA uses a very small SL so the account is always protected from equity drawdown with a very low risk-per-trade. The EA integrates a system of partial position closure during slippages (can be configured). It was backtested and optimized using real ticks with 99,9% quality. It has successfully completed stress testing. The EA contains the
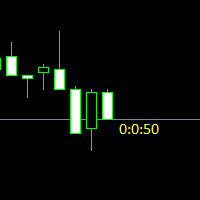
Простая утилита показывающая время до формирования свечи. Может быть очень полезна, если вход в сделку завязан на начале/завершении свечи.
Входные параметры FontColor - Цвет текста. FontSize - Размер текста. FontName - Шрифт текста. TimeOnly - Указывать только время, без дополнительного текста. TypeOfDrawing - Тип отображения информации Важно : в работе программы возможна задержка в 1 секунду.
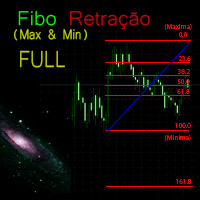
Functional in the Forex market. Functional in the B3 market - Bolsa Brasil Balcão.
Motivation The technical indicator of Fibonacci retraction for many is essential and the basis for all forecasts of market movements. The name of the tool comes from the Italian mathematician Leonardo de Pisa (13th century). This FULL version will work in Meta Trader 5 on any type of account.
This FULL version will work in Meta Trader 5 on any type of account.
To test on the DEMO account, download the free
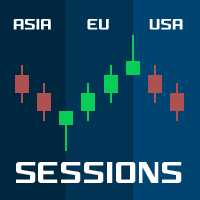
Sessions PRO is a perfect tool which divide your chart screen by 3 main market sessions: 1> asian 2> european (with division for Frankfurt and London start) 3> american
Sessions PRO is perfect especially for trading indices, where main pivot points often occurs along with new market center enters the market. With Sessions PRO you see what events happened at their exact corresponding time - European and American moves and pivot points are much more important than asian. Stop analyzing your

this indicator very simple and easy if you understand and agree with setup and rule basic teknical sba you can cek in link : please cek my youtube channel for detail chanel : https://t.me/SBA_FOREX_SIGNAL https://youtu.be/-Vtp99XGfe0 an for detail info contact me https://t.me/shadowbreakerfx basicly setup buy (long) for this indicator is Magenta- blue and green candle or magenta - green and green candlestik and for setup sell (short) is Black - yellow - and red candle or black - red and red

Индикатор, показывающий момент преодоления нулевой отметки индикатора MACD. Подходит для бинарной торговли, т.к. имеется возможность посчитать точность сигналов, в зависимости от времени экспирации.
Входные параметры Period of SMA1 - Период 1 скользящей средней Period of SMA2 - Период 2 скользящей средней Period of SMA3 - Период 3 скользящей средней Price Type - Тип цены, используемый индикатором MACD Invert signals - Возможность давать инвертированные сигналы (для работы по тренду) Infor

A useful feature may be to determine the normal frequency of round-sized trades, and monitor deviations from that expected value. The ML algorithm could, for example, determine if a larger-than-usual proportion of round-sized trades is associated with trends, as human traders tend to bet with a fundamental view, belief, or conviction. Conversely, a lower-than-usual proportion of round-sized trades may increase the likelihood that prices will move sideways, as silicon traders do not typically hol
Easley et al. study the frequency of trades per trade size, and find that trades with round sizes are abnormally frequent. For example, the frequency rates quickly decay as a function of trade size, with the exception of round trade sizes {5, 10, 20, 25, 50, 100, 200,…}.
These authors attribute this phenomenon to socalled “mouse” or “GUI” traders, that is, human traders who send orders by clicking buttons on a GUI (Graphical User Interface).
In the case of the E-mini S&P 500, for example, si
Easley et al. [2011] proposed a high-frequency estimate of PIN, which they named volume-synchronized probability of informed trading (VPIN). This procedure adopts a volume clock, which synchronizes the data sampling with market activity. For additional details and case studies of VPIN, see Easley et al. [2013]. A number of studies have found that VPIN indeed has predictive power: Abad and Yague [2012], Bethel et al. [2012], Cheung et al. [2015], Kim et al. [2014], Song et al. [2014], Van Ness et

Hasbrouck follows up on Kyle’s and Amihud’s ideas, and applies them to estimating the price impact coefficient based on trade-and-quote (TAQ) data. Consistent with most of the literature, Hasbrouck recommends 5-minute time-bars for sampling ticks. This indicator is based on Advances in Financial Machine Learning 2018 - Marcos Lopez de Prado book, Page 289. --- This code can run slow when using big timeframes, it use copytick to get dollar volume, in a next version I will implement a temporary i
This indicator implements the Corwin and Schultz Estimator based on Advances in Financial Machine Learning 2018 - Marcos Lopez de Prado, page 284. It's a spread estimator using high/low and a rolling window (configurable). It works with low liquidity markets as a robust estimator. It's interesting when you need to track spread changes, more information can be found at Marcos book.
Amihud studies the positive relationship between absolute returns and illiquidity. In particular, he computes the daily price response associated with one dollar of trading volume, and argues its value is a proxy of price impact. Despite its apparent simplicity, Hasbrouck [2009] found that daily Amihud’s lambda estimates exhibit a high rank correlation to intraday estimates of effective spread. This indicator is based on Advances in Financial Machine Learning 2018 - Marcos Lopez de Prado book,

In Kyle’s model, the variable captures price impact. Illiquidity increases with uncertainty about v and decreases with the amount of noise Kyle argues that the market maker must find an equilibrium between profit maximization and market efficiency. This indicator is based on Advances in Financial Machine Learning 2018 - Marcos Lopez de Prado book, Page 288.
This indicator implements the Rool Model Estimator based on Advances in Financial Machine Learning 2018 - Marcos Lopez de Prado, page 283. It's a spread estimator using trade by trade (copytick) values from last trades (configurable). It works with low liquidity markets as a robust estimator considering the covariance between price diferences. It's interesting when you need to track spread changes
This indicator implements the High Low Volatility Estimator based on Advances in Financial Machine Learning 2018 - Marcos Lopez de Prado, page 284. It's a robust estimator using High/Low values from past bars (configurable). It's robusto to Gaps (open/close of days to stock markets) since it's using high/low ration and not the close price. It's interesting when you need to avoid trading at a specific level of volatility

The Levels indicator has been created to simplify the process of plotting support and resistance levels and zones on selected timeframes. The indicator plots the nearest levels of the selected timeframes, which are highlighted in different colors. It significantly reduces the time needed to plot them on the chart and simplifies the market analysis process. Horizontal support and resistance levels are used to identify price zones where the market movement can slow down or a price reversal is like

The initial price is 75 USD, the future price is 150 USD
The EA uses a reverse strategy. To detect trading signals, the following indicators are used: Moving Average, Relative Vigor Index, Average True Range, Alligator and other custom indicators . Each pair has a stop loss, take profit, breakeven and trailing stop. The EA trades on many major currency pairs and timeframes. The EA uses timeframes: MetaTrader 4 MetaTrader 5 M1, M5, M15, M30, H1 M1, M2, M3, M4, M5, M10, M12 ,

ZigZag with backlight Fibonacci levels. The indicator has the ability to set any number of levels, the signals of the intersection of which can be sent to your mobile device email, as well as viewed via alerts. The indicator is designed to perform wave analysis, search for harmonic petterns, as well as search for other technical analysis figures. This Zigzag uses the principle of constructing extrema in which any trader will understand very easily. First, the indicator finds the upper and lower

Crypto Trend Finder follow trend. Color change trend changed. Works in BTCUSD/BABUSD/BSVUSD/ETHUSD/ETCUSD/BTGUSD/DSHUSD/ZECUSD/IOTUSD/XRPUSD and all crypto pairs
Best timeframes 15M/30M/1H/4H/DAILY Note : Not use 1M/5M
Signal on close of a bar. DOES NOT repaint. DOES NOT repaint. DOES NOT repaint. DOES NOT repaint.
DOES NOT recalculate. DOES NOT recalculate. DOES NOT recalculate. DOES NOT recalculate Settings : No Settings, change color

ZhiBiSmart适合所有市场品种的所有图表周期。它利用趋势回调用做反弹波段,这样会更好的预测了波段和趋势。 Buy the order:出现绿色向上的箭头的标记; Buy the close:出现绿色的叉的标记; Sell the order:出现黄色向下的箭头的标记; Sell the close:出现黄色的叉的标记; 参数设置: 【TrendPeriod】:趋势线的周期; 【SignalPeriod】:信号线的周期; 【TrendSpread】:趋势线最后的确定点差; 【Alert_No_Off】:弹窗消息的开或关;true=开、false=关; 【SendMail_No_Off】:电子邮件的开或关;true=开、false=关; 【SendNotification_No_Off】:消息推送到移动终端的开或关;true=开、false=关; 【UpArrowMessage】:出现向上的箭头的时候,发送的消息的内容; 【DownArrowMessage】:出现向下的箭头的时候,发送的消息的内容; 【UpCloseMessage】:出现关闭向上的订单的叉的时候,发送的消息的内容;

Sniper Trend Finder follow trend. Color change trend changed.
Works in EURUSD/GBPUSD/XAUUSD/USOIL/US500/USDJPY/USDCAD/JP225/USDTRY/USDMXN and all pairs
Best timeframes 5M/15M/1H/4H/DAILY
Signal on close of a bar.
DOES NOT repaint. DOES NOT repaint. DOES NOT repaint. DOES NOT repaint.
DOES NOT recalculate. DOES NOT recalculate. DOES NOT recalculate. DOES NOT recalculate Settings No Settings, change color


Sensey Candlestick Pattern Recognition Indicator Sensey is an advanced tool capable of accurately identifying candlestick patterns. Not only does it recognize patterns, but it also detects price highs and lows within a specified time frame. Sensey operates seamlessly across multiple timeframes and is compatible with all currency pairs, futures, and commodities. Unlike some indicators, Sensey does not repaint historical data, ensuring reliable analysis even in cryptocurrency markets. You can wit

The indicator compares quotes of a given symbol and a synthetic quote calculated from two specified referential symbols. The indicator is useful for checking Forex symbol behavior via corresponding stock indices and detecting their convergence/divergence which can forecast future price movements. The main idea is that all stock indices are quoted in particular currencies and therefore demonstrate correlation with Forex pairs where these currencies are used. When market makers decide to "buy" one

Hunter Trend: Arrow Indicator for Binary Options Trading Hunter Trend is an arrow indicator designed for trading binary options (turbo options) on the M1 timeframe, allowing for short-term trading opportunities. How to Trade with this Tool: Signals may appear when a candlestick forms. Once such a signal appears, wait for the closure of that candlestick. Upon the opening of a new candlestick, open a trade for 1-2 candlesticks in the indicated direction. In this case, for 1-2 minutes. A blue dot

This EA has built-in trend acceleration indicator to check the trends before performing any trading action. It's engine is provided with: trailing Stop Loss; bad time to trade filter for each day of the week; enable and disable martingale mode; define the maximum spread value to trade; define the minimum equity percentage to allow trading; the input values are already optimized for EURUSD at timeframe M1. The Strategy This Expert Advisor uses built-in trend acceleration indicator where you can s

Robonacci Universal is designed to trade any markets (Stocks, Forex, Commodities, Futures, Cryptos). The strategies are developed based on various Price Actions that will be observed on different Fibonacci Retracement levels. Product Home Page: https://www.mql5.com/en/market/product/36095
ADVANTAGES:
Works on any market and time frames Multiple Strategies in 4 categories: Retracement, Breakout, Trend Follow, Reversal Trades simultaneously on any number of markets under the same account Di

The Quantum GBPX is the latest addition to our suite of currency indices, and one which we have been asked for many times, and even more so since Brexit. It is an index which has taken us some time to develop, and through a series of complex calculations draws its primary data from a basket of currencies based on the old style dollar index, the Dixie. This is converted to a chart for the British pound. The result is an accurate index which describes strength and weakness for the GBP currency in

This is a cluster expert adviser. It allows for trading an arbitrary set of instruments, which may include Forex currencies, indices, goods, stocks, etc. It's based on algorithm used by SuperIndices indicator (the indicator itself is not required, but can be useful for visual analysis). The trading strategy is to buy assets in upper part of the indicator and sell assets in lower part. You can choose the signal strength for entering and exiting the market. If the signal becomes stronger by predef

AutoBuy - is a script place pending buy stop orders with automatic calculation of the volume (number of shares) depending on the risk of money on the deal. Inputs: Risk - number in USD of money put on the trade.
BuyHighStep - the number of USD, a step up from the rates High of the current candle (bar) stock up to buy. Minimum value is 0.01
StopLossStep - the number in USD, the step from the price of the buy stop order down to close the deal at a loss. The minimum value of 0.10
TakeProfitStep

This indicator would help you I DENTIFY different HORIZONTAL SUPPORT / RESISTANCE LEVELS AND TRENDLINES.
ADVANTAGES: Use up till 5 different levels of Support and Resistance Use up till 5 different trend lines Use true/false options to display for Support/Resistance or Trend line Image
PARAMETERS: nPeriod: the time period to decide
Limits: the candles limit to look back
UseHorizontalLines: true/false option to display Horizontal Support and Resistance Lines UseTrendline: true/false opti

WOWOWOW ! now we are ready to establish patterns, when tracing these lines we can observe sets of 1000 lines or more forming patterns that are gradually setting up a scenario behind the empty graph of the screen of the meta trader. We can observe the behavior of the players over time and we can try to predict some future action simply by installing this powerful calculating machine. If you feel confused, try the LEKIMDIKATOR utility, this one I charge 10 dollars because it will give you a real

I present to your attention experimentally, a new EA that forms the trading range of the time interval. The EA has built-in proprietary algorithms for transaction support.
The emerging range is set manually by the EA settings, such ranges can be set up to two pieces. After a specified time and capture the trading range, the EA starts its work. When the price goes beyond the limits of this range, the EA opens an order with market execution, accompanying the transaction, placing Take profit and

Exit Area Ultimate 是一种技术指标,旨在通过在图表上指示每日 平均真实范围 (ATR) 和 平均每日汇率 (ADR) 水平来增强交易决策。通过了解这些水平,交易者可以轻松评估资产全天的平均变动。这个多功能指标为日内交易者提供多种用途,帮助下单、识别日内趋势、设置追踪止损水平以及建立每日获利水平。 该指标的主要特征之一是它依赖于 ATR 和 ADR 指标,这些指标提供了对市场波动和价格范围的宝贵见解。交易者可以使用此信息来确定适当的获利和止损水平,从而优化他们的风险管理策略。该指标还根据指示的水平计算剩余点数,从而可以快速评估潜在的利润或损失。 Exit Area Ultimate 与每个符号兼容,使交易者能够将其应用于广泛的资产。此外,每个指标级别都可以根据个人偏好和交易策略激活或停用。交易者可以根据他们的具体要求灵活地定制指标水平。 为确保及时通知,该指标提供手机、电子邮件和弹出式警报,让交易者随时了解重要的市场动态。这些警报可以快速配置和定制,以满足个人喜好。 在参数方面,Exit Area Ultimate 提供了 ATR 和 ADR 的各种设置。交易者可以调整

The latest most requested Binary Options arrow indicator in the Garuda Signals product line is now on MT5! Binary options signal based on multiple time frame cross over analysis. Gets confirmation from the most consistent signals known to man; Ichimoku, SMA, Bollinger Bands; and also uses the 1 Hour time frame as trend confirmation , so you don't have to open up multiple chart and waste time. - Can be used for all time frames up to 1 hour, but is most POWERFUL for 1 and 5 min options. - Place yo

Forex Relative Performance indicator This indicator calculates the relative strength of major currencies against the US dollar. The basic idea behind this indicator is "to buy strong currency and to sell weak currency". This indicator allows you to quickly identify the best forex pair to trade according to your trading style (Intraday, Scalping, Swing, or Long Term)
MetaTrader市场是独有的自动交易和技术指标商店。
阅读MQL5.community用户备忘更多地了解我们提供给交易者的独特的服务:复制交易信号,自由职业者开发的自定义应用程序,通过支付系统完成的自动付款和MQL5云网络。
您错过了交易机会:
- 免费交易应用程序
- 8,000+信号可供复制
- 探索金融市场的经济新闻
注册
登录