适用于MetaTrader 5的付费技术指标 - 36
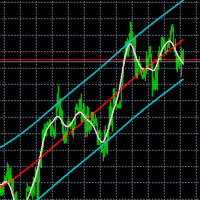
Flex channel - indicator plots channel using Hodrick-Prescott filter. Hodrick-Prescott filter is the method of avreaging time series to remove its cycling componets and shows trend. Settings HP Fast Period - number of bars to calculate fast moving average
HP Slow Period - number of bars to calculate slow moving average
Additional information in the indicator Channel width - channel width in pips at first bar MA position - fast moving average position in the channel in persentage
Close positio
Binary Options Assistant (BOA) KAM Signals Indicator provides signals based on gkNextLevel Binary Options Strategy. Indicators: 3 Moving Averages & Stochastic
Stop missing trades, stop jumping from chart to chart looking for trade set-ups and get all the signals on 1 chart! U se any of the BOA Signals Indicator with the Binary Options Assistant (BOA) Multi Currency Dashboard . All BOA Signal Indicator settings are adjustable to give you more strategy combinations. The signals can be seen v

I have been trading and designing indicators and EAs for the last 5 years, and with great pride and excitement, I am honored to present FMC Alert(Forex Market Conditions Alert) to you all!
If you are a fan of the traditional indicators like the stochastic indicator, macd and moving averages, but if you would like a complete indicator that can utilize all these indicators, and some others, then the F.M.C Alert is the indicator for you. F.M.C Alert is an indicator that allows traders to customiz

Melhor regra de coloração pra RENKO no MT5. Lucre de forma simples no mercado Brasileiro e também no Forex. Gatilhos precisos, indicando ótimos pontos de compra e venda no mercado.
Pode ser utilizado no Mini Dólar e Mini índice Pode ser utilizado no mercado Forex.
O indicador contém a regra de coloração aplicada ao RENKO.
O indicador permite a alteração dos parâmetros: período e tamanho do renko
O indicador permite a alteração das cores dos renkos.

MultiVWAP A radical reworking of the well-known VWAP, which is in fact a completely new unique tool. It gives you the opportunity to put 5 types of different VWAPs on the chart: Volume - standard VWAP calculated based on volume No volume - no volume in calculations, which allows using the indicator on the charts, for which the broker does not supply volumetric data Volatility - new development, the calculation is based on unsteady volatility Buyer - VWAP calculation is based on current market bu

The QRSI indicator is one of the most important and well-known indicators used by traders around the world. It is also obvious that this indicator is capable of showing good entries in every local area. For which it usually needs to be optimized or just visually adjusted. This development is intended for automatic optimization of the indicator. Once placed on the chart, the indicator will automatically re-optimize itself with the specified period (PeriodReOptimization) and display the chart wit

MQL4 has also been converted to MQL5 exposure info for friends using iexposure. It shows the total number of positions that have been opened, how many buy or sell positions there are, the net amount of position numbers and their order prices, the profit and loss status of all total positions. I didn't write their code, it's open source, but I wanted to share it with everyone because it's an indicator I like!
https://www.mql5.com/en/charts/14801856/usdjpy-fix-d1-idealfx-llc

Automatic marking of the chart with Pentagram models. This model is based on the Expansion Model from Adversa Tactics. Designed to determine the trend and predict possible levels and targets of price correction in the future. The model describes a developing trend. The trend is relevant until the price crosses the trend line of the model in the opposite direction. Levels of rays of the pentagram, level of HP, distances of 100% and 200% of the distance between points 1-4, levels of HP are possibl

This is an indicator for MT5 providing accurate signals to enter a trade without repainting.
It can be applied to any financial assets: Forex Cryptocurrencies Metals Stocks Indices It will provide pretty accurate trading signals and tell you when it's best to open a trade and close it. How do I trade with the Entry Points Pro indicator? Buy and install the indicator in your terminal Start trading by receiving signals from the indicator telling you about the ideal moment to enter a trade.

SL Sniper I coded. to trade with the trap system of the main market with vsa for more information and you want vsa system please pm me
Suggested timeframes to trading : M1- M2- M3- M5 - M15-M30 -H1 Wait london and newyork markert open after wait best then select the best strong index and weakest index by sniper Histogram is indicated by one arrow at a time. The signal in the end direction of weak and strong All red and green mean trending index,natural market is displayed only in white SL
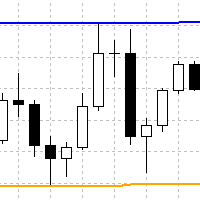
Indicator finds swing highs and lows, which are located between x bars to the left and y bars to the right. It plots such high and lows in form of continuous lines. Here is description of inputs. High Left Length - count of bars to the left for finding of swing high High Right Length - count of bars to the right for finding of swing high Low Left Length - count of bars to the left for finding of swing low Low Right Length - count of bars to the right for finding of swing low


For a trader, trend is our friend. This is a trend indicator for MT5, can be used on any symbol. just load it to the terminal and you will see the current trend. green color means bullish trend and red means bearlish trend. you can also change the color by yourself when the indicator is loaded to the MT5 terminal the symbol and period is get from the terminal automaticly. How to use: I use this trend indicator on 2 terminals with different period for the same symbol at same time. for example M5

VZO Plus is an indicator that shows overbought and oversold regions based on traded volume. #When the indicator line is between -40 and -60 it is oversold #When the indicator line is between 40 and 60 it is overbought.
Outside these regions, the market is following its natural path by inertia. Above the green line, it means that the market is positive, Another way to analyze the indicator is through divergence regions. When we have the bottom higher than the other in a downtrend or One botto

Infinity Indicator MT5 1.0 Panel Asset Rate % EURUSD 96.0% GBPUSD 94.1% AUDCAD 90.5% USDCHF 87.8% BTCUSD 78.4% Panel Win Rate based on CandleMT4 Exit Button Calculates the StdDev standard deviation indicator on the RSI data, stored in the matrix similar to the keltner. input int HourCalculate = 12; RsiLength = 5; RsiPrice = PRICE_CLOSE; HalfLength = 4; DevPeriod = 100; Deviations = 0.9; UseAlert = true; DrawArrows = true; TimerWork=300; LevelUp = 80; LevelDown = 20; MoreS

Bollinger Prophecy is a multicurrency trending tool for technical analysis of financial markets. Draws 3 lines on the chart that show the current price deviations of the currency pair. The indicator is calculated based on the standard deviation from a simple moving average. The parameters for the calculation are the standard double deviation and the period of the moving average, which depends on the settings of the trader himself. A trading signal is considered when the price exits the trading c

The JAC Trend Indicator for MT5 was created to facilitate the identification of the market trend in an easy and agile way. # When JAC Trend indicator is green , we have a pre-trend to uptrend market. # When JAC Trend indicator is Red we have a pre-trend to downtrend market. # When JAC Trend indicator is gray , we have a sideways market without strength. That way you have all the sides that the Market can go to in a clear and objective way.

Boom and Crash Trend Detector is a Non-Repaint MT5 trading system usually being sold for 50 0$ .
Most people use this for Deriv but can be used to forex too.
The boom and crash spike indicator is a spike detecting software, with Multiple features, these features include. Spike Alert ( from 10 to 100-second warning before spike) Continues spike Alert (for double or continuous spikes at a time) supports all Boom/crash Indices M6 time frame works best here . Bigger time frame trend pointer f


BetterVolumeTick it is a volume indicator. It marks the volume regions where there was a great aggression, also shows the volume intensity. Yellow means low volume, normal activity. Orange means activity with a pretty amount of volume. Red means ultra high volume. This indicator combined with the price chart will give you another view of the market context.

OSW 主日历
该指标最初是为了我个人使用而创建的,但我一直在一点一点地改进它,并实现一些功能来帮助我的日常交易,如果有用的话,我们将继续实现这些功能。
日历详细信息。
>接近当前日期的移动和详细新闻日历,其中包含以下数据:日期、国家/地区、货币、新闻部门、新闻名称以及上一个、预测和当前数据。
>日历每 5 分钟自动更新一次。
>从菜单中,您可以根据重要性,通过配置新闻的颜色以及交易时段及其开始时间来选择要查看的新闻。
颜色变化
>日历有内部变色功能,如果当前值大于上一个值,则变为蓝色,否则变为红色,中性为灰色。
>根据新闻的颜色和重要性更改新闻描述文本的颜色,可从菜单进行配置。
>如果消息导致货币走强,则货币名称和国家/地区将设置为蓝色,否则为红色,中性为灰色。 (这是一个概率)
日期
>显示交易服务器的日期。
>显示当前蜡烛完成的剩余时间。
纽扣
>线条:在新闻的确切小时和分钟处创建和删除垂直线条和标志,并使用菜单的颜色。
>会话:在菜单中配置的会话时间中创建和删除垂直线以及颜色。
>开始周:移至表中一周的开始处。
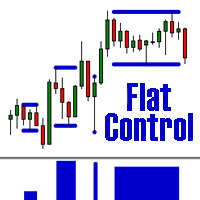
The indicator defines a trading corridor, a flat market, and corrections.
Allows you to compare the significance of different flat and trend areas (by time of existence and by volatility). This makes it possible to assess the market cycle and its mood at a glance.
That is, how long does the flat last on average, and how long is the trend and what kind of volatility they have in points.
As a rule, the longer the flat lasts, the more likely it is to accumulate the potential for a strong mov

Descriptions
A point point is a technical analysis indicator, or calculations, used to determine the overall trend of market over different time frames. This indicator calculate the highest or lowest pivots among left x and right y bars and show the high/low level during that period. From that, you could clearly see the top resistance & bottom support level and how market goes break out.
Instructions
pivotLeft - pivot left bar count pivotRight - pivot right bar count pivotHighColor - c

Signal Eskiya, in addition to channel lines, reflects entry signals in the form of arrows. Trading strategies using the channel indicator belong to the classic methods of technical analysis, are easy to execute, and therefore available even to beginners. Price ranges work equally well on any trading assets and timeframes, they can be used both independently and with additional confirmation from oscillators and market volumes.
American traders say: “Trend is your friend”, which means “Trend is

Jacket is an arrow indicator for forex, futures and binary options without redrawing. Tracks the market trend, ignoring sharp market fluctuations and noise around the average price. Works only at open prices. Therefore, it is reliable and without redrawing. This indicator uses its algorithms to analyze previous periods and predict further market behavior. It is based on the calculation of levels with a certain period, which allows you to more accurately assess the situation. Often, signals that

America is a global trend indicator. If you do not have your own trading strategy yet, you can use our ready-made trading strategy. The indicator will help in finding entry points when analyzing the price chart. The program first receives a "snapshot" of the graph, then analyzes it. The results are communicated to the trader in the form of signals. The main purpose of this indicator is to determine the moments of entries and exits from transactions, therefore the indicator displays only the tre

Market Fractal Analysis, Fractal Swing, Market Flow Fractal Cycles looks for Similar Patterns in the Market that repeat themselves because of the Market Fractal Nature. These patterns are displayed with help of Graphical Objects and Alerts can be received on their arrival. Read the Blog for full information. Features:- Auto Detection of Patterns Customization for Color and Line Styles Alerts, Emails & Push Notifications
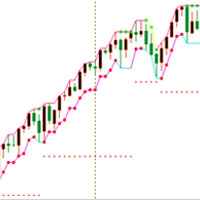
K线极点轨道UD
【input 参数】
InpMyMagic: 幻数 InpShowPanel: 是否展示面板 InpOneLot: 开单量1份[最大99.99](=0最小手,>0固定手,<0>=-1净亏比,<-1净余最小亏比) InpAllLot: 总净单量,100%(=0最小手,>0固定手,<0>=-1净亏比,<-1净余最小亏比) InpLotMaxMoney: 开单量计算的最大金额(=0不管,>0超过该值即限制为该值,<0超过整数值即限制为小数倍数) InpLot1Dot1Money: 开单1手变化1点时金额变化值。(<=0自动计算(美元),>0指定) InpDotBig: 大间隔点值(>=0点值,<1三位数点差均,<0整均比) InpDotSml: 小间隔点值(>=0点值,<1三位数点差均,<0整均比) ========== UD ========== InpUDType: 类型(=0不开,=1常规,=4偏极,=6平台,=8慢跟,=10超前,=12跟随) InpMinWidth: 上下轨宽度最小值(>=0点值,<1三位数点差均,<0整均比) InpHTurnT

After forming a New Structure High the market will retrace creating a higher low. When this movement occurs, that NSH's now become an area of structure called resistance . As price action pushes up from the newly created higher lows, that resistance level becomes the last stand for sellers to stop the buyers from rallying.
IF the resistance level cannot be penetrated, THEN it's likely that we'll see either a period of consolidation or a reversal in trend. IF price action breaks through

卷方向 MT5
通常,当当前音量高于前一音量时,音量指示器具有默认的颜色变化,这很重要但不是很有用。
出于这个原因,这个指标的创建是为了除了正常的交易量之外,当蜡烛看涨或看跌时,它会为它们绘制不同的颜色,默认情况下看涨的蓝色和看跌的红色,但这些颜色可以定制为 商人的味道。
不要忘记查看我的其他指标,它们将帮助您改善交易。
卷方向 MT5
通常,当当前音量高于前一音量时,音量指示器具有默认的颜色变化,这很重要但不是很有用。
出于这个原因,这个指标的创建是为了除了正常的交易量之外,当蜡烛看涨或看跌时,它会为它们绘制不同的颜色,默认情况下看涨的蓝色和看跌的红色,但这些颜色可以定制为 商人的味道。
不要忘记查看我的其他指标,它们将帮助您改善交易。

A powerful oscillator that provide Buy and Sell signals by calculating the investor liquidity. The more liquidity the more buy possibilities. The less liquidity the more sell possibilities. Please download the demo and run a backtest!
HOW IT WORKS: The oscillator will put buy and sell arrow on the chart in runtime only . Top value is 95 to 100 -> Investors are ready to buy and you should follow. Bottom value is 5 to 0 -> Investors are ready to sell and you should follow. Alert + sound will app

MT5 的货币强度指标 是任何初学者或专家交易者的创新解决方案!它将货币强度概念提升到一个全新的水平,因为它将它与价格行为相结合,并且可以应用于任何符号/货币对,除了通常的 8 种主要货币的 28 种组合。这意味着您可以交易任何货币对的强弱,包括所有货币、主要、次要和外来货币、商品和加密货币(不是指数)。这是一款真正的突破性产品,通过使用彩色条形图,让您一眼就可以清楚地了解 32 个符号,从而直观地告知您任何对的 2 个部分的强度/弱点平衡,而无需破译复杂的强度线或直方图,就像在其他传统的货币强度解决方案中一样。
MT5 的货币强度指标 为您提供了根据个人喜好配置 32 个符号按钮的选项,通过添加您想要密切关注和交易最多的货币对。这样您就不会错过任何机会,因为您只需看一眼就可以在图表上全面了解当前市场。此外,当您监控的 32 个品种中的任何一个在当前时间范围内达到您想要的强度水平时,您可以向您发送终端、推送或电子邮件通知。
MT5 安装和用户指南的货币强度指标 | 更新购买的产品
特征 非常简单和直接的界面,没有复杂的额外窗口或屏幕 独特的货币强

Laguerre SuperTrend Clouds adds an Adaptive Laguerre averaging algorithm and alerts to the widely popular SuperTrend indicator. As the name suggests, Laguerre SuperTrend Clouds (LSC) is a trending indicator which works best in trendy (not choppy) markets. The SuperTrend is an extremely popular indicator for intraday and daily trading, and can be used on any timeframe. Incorporating Laguerre's equation to this can facilitate more robust trend detection and smoother filters. The LSC uses the

Institutional Pivot is a result of 5 years of research on order flow analysis in the Forex market and Nasdaq, seeking mounting and defense positions. The one of the best support and resistance points you can have right now available to everyone. You can opt for the Forex, CME and Brazilian markets in the settings
Choosing the market just plot on the chart to make your trades
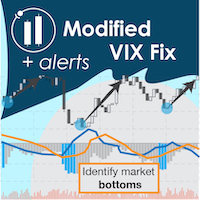
"The VIX Fix is a powerful indicator that detects market bottoms for any asset " The VIX (volatility index) is a ticker symbol of implied volatility of the S&P 500, calculated by the Chicago Board Options Exchange. VIX is a popular measure of market risk, and is one of the best measures of market bottoms that currently exists. Unfortunately, it only exists for the S&P 500... The VIX Fix was published by Larry Williams in 2007, and it synthesizes a VIX volatility index for any asset (not j

Auto Point of Control Indicator for those who use the Market/Volume Profile in their trading, who are familiar with the concepts of POC and VAH/VAL. I often noticed that it is inconvenient to change the zone of POC level calculation. Also it is not always convenient to use periodic areas, such as Day, Hour, etc. So I decided to develop a fully automated POC, where the zones change each other through the algorithm in the script. How to use POC - everyone decides for himself. They can be stop-loss
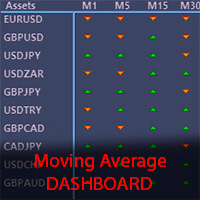
The Moving Average Dashboard indicator allows you to see the relationship between a fast and a slow moving average.
This indicator is working on multiple symbols and up to 21 timeframes. It's allows you to configure the fast and slow moving averages to whatever period, method or price is appropriate
The Moving Average Dashboard saves you time as you can use the indicator to scan multiple currency pairs or other symbols in just one window.
Installation Download the Indicator in your MT5 te

50+ Candlestick Patterns, Simulated Trading Results, Top Five Performers Candle Analysis extends Candlesticks Pattern Analysis by not only identifying Patterns but also recording the Past Performance of the Patterns. What it Does:- Identifies and plots results on chart Displays Top Patterns for both Bullish and Bearish type. Log can be printed in experts tab to see Simulated Trading results Displays All or Selected Patterns Alerts on Pattern formation More detailed information in Blog
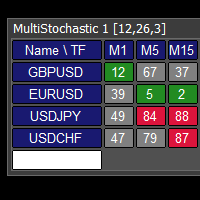
This tool monitors Stochastic indicators on all time frames in the selected markets. Displays a table with signals to open a BUY trade (green) or SELL trade (red). You can set the conditions for the signal. You can easily add or delete market names / symbols. If the conditions for opening a trade on multiple time frames are met, you can be notified by e-mail or phone message (according to the settings in MT5 menu Tools - Options…) You can also set the conditions for sending notifications. The li

This tool monitors MACD indicators on all time frames in the selected markets. Displays a table with signals to open a BUY trade (green) or SELL trade (red). You can set the conditions for the signal. You can easily add or delete market names / symbols. If the conditions for opening a trade on multiple time frames are met, you can be notified by e-mail or phone message (according to the settings in MT5 menu Tools - Options…) You can also set the conditions for sending notifications. The list of
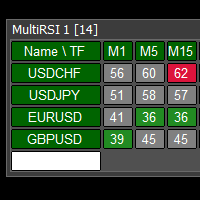
This tool monitors RSI indicators on all time frames in the selected markets. Displays a table with signals to open a BUY trade (green) or SELL trade (red). You can set the conditions for the signal. You can easily add or delete market names / symbols. If the conditions for opening a trade on multiple time frames are met, you can be notified by e-mail or phone message (according to the settings in MT5 menu Tools - Options…) You can also set the conditions for sending notifications. The list of s
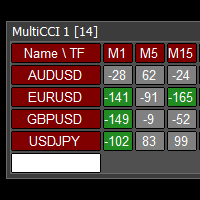
This tool monitors CCI indicators on all time frames in the selected markets. Displays a table with signals to open a BUY trade (green) or SELL trade (red). You can set the conditions for the signal. You can easily add or delete market names / symbols. If the conditions for opening a trade on multiple time frames are met, you can be notified by e-mail or phone message (according to the settings in MT5 menu Tools - Options…) You can also set the conditions for sending notifications. The list of s
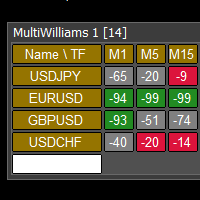
This tool monitors WilliamsPR indicators on all time frames in the selected markets. Displays a table with signals to open a BUY trade (green) or SELL trade (red). You can set the conditions for the signal. You can easily add or delete market names / symbols. If the conditions for opening a trade on multiple time frames are met, you can be notified by e-mail or phone message (according to the settings in MT5 menu Tools - Options…) You can also set the conditions for sending notifications. The li

True Choppiness Direction determines if the market is choppy (trading sideways) or if it is trending, as well as the trend direction and strength (green=up, red=down, grey=no trend) . The underlying algorithm is designed to detect trend movements even in the presence of noisy market data, please see screenshots. Trend strength is indicated by taller or shorter red/green fill. Choppiness index is range-bound between -50 (very trendy) and +50 (very choppy). This is a custom algorithm designed
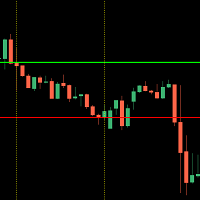
This indicator shows you the higher high and lower low of a certain period of time.
It is easy to use - select your desired time frame (current, 15Min, 1H, 1D) and the corresponding number of candles.
The indicator measures the highest and lowest point within the specified range and automatically draws the two corresponding lines.
The design of the lines is up to you!
Should the trend break one of the drawn lines with a closed candle, a message will be sent to you by the built-in alarm f

HI guys this my developing indicator 1st version alert logic work well.. this indicator using can you stronger currency and top weaker currency find well,this;s indicator multy MTF time frame strength work.very good for SL trend screener intraday trader and long time trader, very easily can you watch stronger and weaker index.I hope to more improve this future further,thank you if you want more information please pm me

Trend Everest MT5 indicator is a trend following indicator that aids in decision making. It is based on the calculation of ATR that assist and the average hull. A key issue is that the Trend Everest MT5 nominee does not repaint, so you can backtest with greater confidence. When it is Green, UpTrend When it is a Red downtrend. Not that the Market is fractal, so the longer the graphic time, the greater its degree of assertiveness.

Looking for a quality pivot point indicator? So Prosecution is what you need! To identify pivot points, the Prosecution indicator analyzes many conditions, as the aggregate analysis provides a more accurate picture of the market situation.
What are pivot points? Pivot point analysis is often used in conjunction with the calculation of support and resistance levels, as is the case with trend line analysis. When analyzing pivot points, the first support and resistance levels are calculated
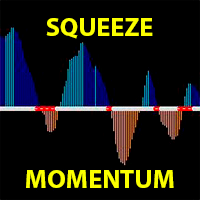
TTM Squeeze Momentum is a volatility and momentum indicator introduced by John Carter of Trade the Markets (now Simpler Trading), which capitalizes on the tendency for price to break out strongly after consolidating in a tight trading range.
This derivative Squeeze Momentum indicator attempts to identify periods of consolidation in a market. In general, the market is either in a period of quiet consolidation or vertical price discovery. By identifying these calm periods, one has a better oppo

Price reach indicator. It also serves as the perfect term for supports and resistance. I use it in two experts. The basic tool for professional trading. The indicator analyzes the last 500 bar and uses this to determine the levels ( but it doesn't predict the future ) . Personally, I use it on TF H1. It is very simple. Four lines on chart and that's all. Only two input parameters. Thousands of indicators. Why this? Is good ? No! Is very good. Please test the indicator prior to purchasing. You

价格通道是交易者分析当前市场情况的主要工具。在它的帮助下,您可以成功预测未来的价格行为,但获利的主要因素是及时的决策。这通常是一个问题,因为根本不可能经常看显示器。
该指标自动构建和更新具有不同周期(快和慢)的两个趋势通道。趋势是使用线性回归确定的。也可以使用 1 个自定义频道,您可以自行构建。
该指标将通道划分为百分比区域。您可以指定您感兴趣的区域的百分比。当价格达到此区域时,您将收到通知。
该指标的一个有趣特征是接收背离信号 - 这是当价格处于不同时期的相反通道区域时。这是一个强烈的信号。
“shift”参数在构建通道时定义了一个小前锋。
可以使用以下类型的通知:电子邮件、推送通知、警报,以及以 wav 格式播放您选择的任何声音。
53% OFF until December 31 (Normal price $125)! Don't miss the opportunity to have this invaluable tool!
This is a totally automated multi timeframe support and resistance levels finder on every MT5 chart. No manual work! Just drop this indicator on a chart and you will have the S/R levels always up to date. It is very convenient and helps the trader to anticipate possible stalls and reversions in price movements. The levels are displayed as lines and each timeframe has a different color. The

Это классический вариант реализации экспоненциальной скользящей средней с коррекций ошибки, какой используется в индикаторах DEMA и TEMA. Соответственно названию, глубина коррекции ошибки увеличена до 33. Индикатор оптимизирован. Потребляет минимально возможные ресурсы. Достаточно быстр, учитывая объёмность вычислений. Может накладываться на другие индикаторы. Как и обычные скользящие средние, nEma_33 не перерисовывается (за исключением нулевого бара). Требуется история > Период*33*33. Согласно
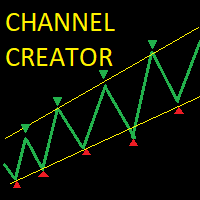
The auto-channel indicator creates a top line and bottom line that encloses a channel within which the symbol has been trading. The channel is created by finding high points for the top line and low points for the bottom line, these points are shown with arrows. A line of best fit is then plotted through these points and extended until the end of the chart. This indicator is useful for trading both within the channel and for breakouts. Inputs: MAPeriod - The moving average period over which the

它是斐波那契派生谐波形态用户可用的最完整的工具。
完全可定制:水平、颜色、线型和厚度。
选择将根据您的研究使用的斐波那契水平。
默认情况下,该工具已经具有经证明受到尊重的斐波那契水平,但用户可以自由更改。
选择如何绘制斐波那契水平线、矩形(有或没有填充)和有界水平线的颜色、线型和粗细。
斐波那契回缩:4 组(最多 25 个级别、最多 26 个级别、最多 27 个级别和最多 28 个级别),每个都可以通过不同的快捷方式操作。
斐波那契投影:一组最多 10 个级别,可通过特定快捷方式操作。
矩形:定义矩形自动绘制的间隔,可通过特定快捷方式操作。
有限的水平线,可通过某种快捷方式操作。
修复了以下快捷方式:删除所有绘制的对象、追溯删除对象、仅删除矩形和追溯删除矩形。
该工具会自动识别您要绘制回缩或斐波那契投影的烛台底部和顶部,无需精确单击烛台末端。
可以提前选择斐波那契回撤线和投影线是否向右延伸。 可以选择是否显示级别的价格。

The intelligent algorithm of the Ikiru indicator accurately detects the trend, filters out market noise and generates input signals and exit levels. Functions with advanced statistical calculation rules improve the overall performance of this indicator. A convenient indicator for technical analysis and is suitable for trading binary options. All entry points are ideally optimal points at which movement changes. Entry points should be used as potential market reversal points.
It is a hybrid tr
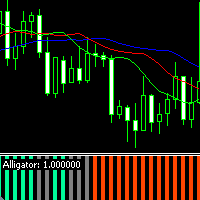
The modified Alligator indicator is designed as an oscillator. Facilitates the analysis of the Alligator indicator values by signaling the trader about market changes using a colored histogram. Histogram color values
Medium Spring Green - uptrend Orange Red - downtrend Gray - lateral movement (flat) Parameter values jaw_period - jaw period teeth_period - teeth period lips_period - lips period jaw_shift - jaw shift teeth_shift - teeth shift lips_shift - lips shift ma_method - method for calcula

The indicator connects the price in a cyclical-wave relationship. Thus, all intersection points will be optimal points at which the movement changes taking into account the indicator period. Crossing points can be used as potential market reversal points. But do not forget that the approach must be complex, the indicator signals require additional information to enter the market.
Suitable for forex, futures and binary options without redrawing. It gives a lot of signals, which requires additi

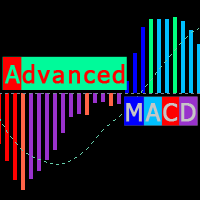
Modified MACD, for technical analysis of charts, with color backlight of histogram signals. The indicator highlights, the direction of the histogram movement, the change in the direction of the histogram movement, the histogram peaks, the interaction of the histogram and the signal curve. Also, the indicator makes it easier to find convergences / divergences between bars and the histogram (which serve as a powerful signal in some trading systems using the MACD indicator). Color designation of Ad

Clear Dom
This Indicator shows a pressure color box based on depth of market of the current symbol. Notice that it only works when book information is received.
You decide weather you want or not to display higher (ask) and lower (bid) levels of book.
The proportion ratio is calculated using volumes read from the book. You can read the actual pressure in the market any time.
Indicator parameters: color_Ask -> ASK box color and ASK value line color color_Bid -> BID box color and BID valu

This indicator shows supports and resistences calculated form historical data when market was swing. When market was swing ? When ADX was below 25 for some bars. In fact market can be considered without a trend. I mean and suggest timeframes H4 and Daily. Using that lines in the present you see resistance and support. More lines are distant and best is possible profit. Every ADX parameters can be set, so colors, swing market bars number.
I am available to get feedback or modify code. Thanks Al

该指标在当前时间范围内构建较高时间范围的预测。以彩色蜡烛的形式进行可视化。有助于更好地了解市场中的流程及其规模和动态。所有这些都可以成为灵感的源泉,并引导您找到成功交易策略的正确途径。该指标简化了烛台形态的搜索。可以启用具有不同参数的多个指标并同时查看多个时间范围。在设置中,您可以更改每个方向的蜡烛颜色及其宽度。该指标可用作与交易顾问结合使用的工具。时间框架选项 - 必须大于当前时间框架,否则指标将无法启动并报告错误。下面的视频演示了如何在不同模式和测试仪中工作。 重要的!如果指标没有绘制任何内容,则要么是时间框架参数选择不正确(它必须大于当前参数),要么您的终端没有所选时间框架的历史记录。要加载它,只需在此时间范围内打开图表并确保所有内容都加载到所需的数量。

1.这是什么 上涨波动和下降波动是不一样的,无论是学术研究还是实际检验都说明了这一点。 原始的ATR指标是把上涨波动和下降波动放在一起进行计算。本指标则是把上涨波动和下降波动分开进行计算,这样能更好的帮助你研究市场。
2.指标说明 本指标的计算有两种模式,如下表所示: 0 1 2 3 4 5 波动方向 + - + + - + TR 15 20 17 5 16 8 原始ATR (15+20+17+5+16+8)/6=13.5 模式1 不以0填充位置,周期数改变 模式1上涨TR 15 17 5 8 模式1下跌TR 20 16 模式1上涨ATR (15+17+5+8)/4=11.25 模式1下跌ATR (20+16)/2=18 模式2 以0填充位置,周期数不变 模式2上涨TR 15 0 17 5 0 8 模式2下跌TR 0 20 0 0 16 0 模式2上涨ATR (15+0+17+5+0+8)/6=7.5 模式2下跌ATR (0+20+0+0+16+0)/6=6
如上表。比如周期为6的序列中,有4个上涨2个下跌。模式1
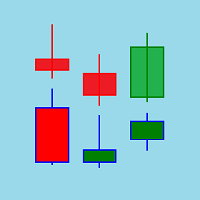
Draw Candle Can you imagine, a direct correlation view on the same chart, seeing an asset and at the same time seeing another asset? So you found the right indicator. This indicator will draw the asset you choose and have in your brokerage inside the chart of another asset. Just open a chart of your trading asset, which as an example could be the EURUSD, add this indicator to the chart and in the variable "Correlated Pair", add the asset you want, which for this example can be GBPUSD, EURGBP.

Индикатор с уникальным авторским алгоритмом определения направления тренда. Показывает лучшие результаты определения тренда на любых валютных парах, акциях, криптовалюте без перерисовки результата. Имеет встроенную статистику, что поможет сразу определить прибыльность текущей пары и таймфрейма. Использует паттерны Price action в связке с уникальным алгоритмом фильтрации. Подходит как новичкам так и профессионалам для всех видов торговли. Как выбрать прибыльный таймфрейм и оптимизировать индикато

Stochastic Cross Arrow is an indicator that automatically places arrow when stochastic K and D line crosses each other on a certain level.
Buffer Guide For Developers: Buffer 0 =Buy Arrow Buffer 1 =Sell Arrow Inputs: ---Stochastic Settings--- %K - %K value. %D - %D value. Slowing - Slowing value . Stochistic Method - Moving Average method. It can be any of enumeration values. Newbar - arrow only appear on new bar. Buy_Msgs - type info message when buy arrow appears. Sell Msgs - type inf
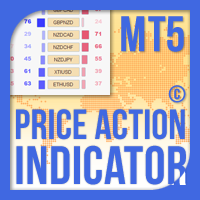
价格行为指标 MT5 根据指定(默认为 8 个)过去蜡烛的纯价格行为数据计算任何符号/工具的买入/卖出力量水平平衡。通过监控指标面板上可用的 32 个符号/工具的价格行为,这将为您提供最接近的市场情绪。超过 60% 的买入/卖出力量水平为买入/卖出特定符号(使用默认设置)提供了相当稳固的水平。价格行为指标 MT4 有 3 种计算模式,可用于标准、快速或缓慢接近价格行为,还提供可调整数量的价格行为蜡烛,以便更清晰或更平滑地适应实时变动。
价格行为指标 MT5 为您提供了根据个人喜好配置 32 个符号按钮的选项,通过添加您想要密切关注和交易最多的货币对。这样您就不会错过任何机会,因为您只需看一眼就可以在图表上全面了解当前的市场情绪。此外,当您在当前时间范围内监控的 32 个交易品种中的任何一个达到您想要的价格行为买入/卖出力量水平时,您可以向您发送终端、推送或电子邮件通知。
价格行为指标 MT5 安装和用户指南 | 更新购买的产品
特征 适合任何初学者或专家交易者的创新解决方案 根据纯价格行为数据计算任何品种/工具的买/卖力水平 3 种计算模式可用于

The Pirates MACD is a Momentum Indicator that shows us not just the Classical MACD, it also shows us high priority trades. the user has an option of selecting among several options the best settings that suits their trading style, even if one has no trading style, Pirates always find a way to survive hence the Pirates MACD is equipped with easy to understand tools. that reduce the strain on ones analysis giving them visual advantages over classical MACD techniques.
This product is made as an

The Urgently indicator is designed to quickly determine the situation in the market, reflect the state of the market and signal profitable levels for opening trades. Market conditions change quickly enough, requiring constant calibration of trading strategies. Recommended for use in conjunction with any of the oscillators. The Urgently forex market trend indicator shows the trend direction and entry points. It smooths out price fluctuations when generating a signal by averaging the data and the
MetaTrader市场是您可以下载免费模拟自动交易,用历史数据进行测试和优化的唯一商店。
阅读应用程序的概述和其他客户的评论,直接下载程序到您的程序端并且在购买之前测试一个自动交易。只有在MetaTrader市场可以完全免费测试应用程序。
您错过了交易机会:
- 免费交易应用程序
- 8,000+信号可供复制
- 探索金融市场的经济新闻
注册
登录