
Convenient and easy to use mini-panel, which displays the profitability from January to the current month .
This will help to quickly evaluate the results of transactions without resorting to monitoring the account.
Data is updated automatically
Each panel element can be configured with its own color and transparency .
There are English and Russian languages.
The panel can be run in the strategy tester and see how it is built.
Monthly profitability is calculated usin
FREE

FastMove is a panel with 5 buttons, a notification area and a text entry. Its goal is to enable quick and simple execution. Buttons: MOVE - Move the interface BUY - Start of buy process SELL - Start of sell process L - Select quantity of lots % - Select quantity of percent of balance Areas: Notifications - This area displays notifications of the various states of the program and the commands sent. Text input - Here you enter the number of lots or the percentage of risk capital depending on the o
FREE

BRiCK is a simple and versatile Utility.
By combining Experts, Indicators and utilities like the Lego block, various trading styles can be realized. "BetByTrade" is a utility to automatically add / close positions when trading. If you open the position in the trade pool, if the calculation result of the betting method exceeds the initial lot, the utility will order additional.
If you close the position in the trade pool, if the position that was additionally ordered by the utility remains, it
FREE
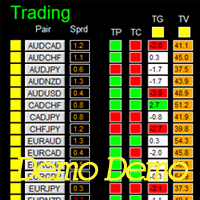
For full version of this panel Dashboard Trading Made Simple, please try it out to get familiar with all functionalities for free, LINK . It has full functionalities of the paid version, except Demo version only works on W1 time-frame, full version has option for all time-frame Stochastic is not available in demo version, it displays data but not works as filter. TDI momentum indicator is not available in demo version, it displays data but not works as filter. The Alert and send notification fun
FREE

An egg is the organic vessel containing the zygote in which an embryo develops until it can survive on its own, at which point the animal hatches. An egg results from fertilization of an egg cell . Most arthropods , vertebrates (excluding live-bearing mammals ), and mollusks lay eggs, although some, such as scorpions , do not. Reptile eggs, bird eggs , and monotreme eggs are laid out of water and are surrounded by a protective shell , either flexible or
FREE

Автоматически отправляйте уведомления в ICQ New о торговых событиях ( открытие/закрытие рыночных и отложенных ордеров, изменение СЛ и ТП ) на вашем счёте. Вы можете оперативно контролировать в реальном времени что у вас происходит на счете и делиться с другими своей торговлей, пригласив в заранее созданную группу или канал. Важно: В меню Терминала: "Сервис" - "Настройки" - "Советники" - "Разрешить WebRequest" для следующего сервера: api.icq.net Настройки: Bot Token - токен Вашего бота. (читай
FREE

This is a free demo version of the Replicator utility ( https://www.mql5.com/en/market/product/23028 ), which trades the minimum lot and only on EURUSD. The program is designed for copying your successful orders. The price is often fluctuates within a channel. But there is no time to place the next orders, especially if it happens at night. Place an order, when it closed with profit, the program repeats your order as a pending limit order. This will continue until the order closes with a loss, o
FREE

This Expert Advisor sends an email notification, generates an alert or outputs a message to the journal (depending on the settings) every time a new order is opened (buy, sell, limit, stop). It also sends a similar message about closure of orders. The EA can be useful for those who want to always be informed of which orders had been opened/closed on the account. Limitations: In this demo version, notifications are available only for the GBPCHF currency pair. To use notifications on all currency
FREE
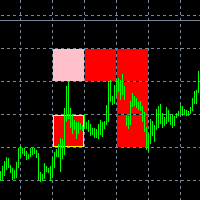
The new version of the game "Snake".
Added setting for the distance of the target (vertical + horizontal), which greatly enlivens the game.
The snake moves in the background, along the grid layout.
Control:
Ctrl - pause, W - up, A - left, S - down, D - right.
In the input parameters, you can set the time in milliseconds between movements.
The snake increases by one division upon reaching the goal, and so on, until it occupies the entire field.
The comment displays the size of the
FREE

Good old snake with various options.
You can play directly on the chart. And you can play in a separate window.
You can not play at all, but set her speed of movement and run it on the machine, the snake itself will chase and devour apples.
You can turn on different sounds of eating apples, or you can completely turn off all sounds.
You can set the maximum length of the snake, and you can also set the number of dice on the game board.
In short - a lot of things are possible. Enjoy.. )
FREE

This is an expert advisor that works more like an indicator.
Its functions are the following: - Print the balance and equity in Arial font size 40 (cannot be changed) - Change chart background and candle colors depending on the close of the previous candle and the current price level.
Now... what is this for or what can I use it for? Good. Personally I use it to put it as the main chart while in other charts I leave other expert advisors working, what I care to see is the balance and equity
FREE

On the other hand, we denounce with righteous indignation and dislike men who are so beguiled and demoralized by the charms of pleasure of the moment, so blinded by desire, that they cannot foresee the pain and trouble that are bound to ensue; and equal blame belongs to those who fail in their duty through weakness of will, which is the same as saying through shrinking from toil and pain. These cases are perfectly simple and easy to distinguish. In a free hour, when our power of choice is untram
FREE
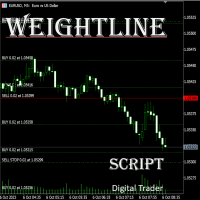
多張持倉單交易時,無法目視化觀察當前市價對應持倉單的關係. 使用此腳本,可以快速畫出報價框品種的多頭平均價 空頭平均價以及加權平均價 讓所有的持倉單可以從報價表上可以快速簡潔的了解到當前市價與持倉單的關係 多頭平均價為所有同品種的多頭持倉單平均價 空頭平均價為所有同品種的空 頭 持倉單平均價
加權平均價為所有同品種的不分多空頭加權後的持倉單平均價
設定參數 BuyAvgLineClr 設定多頭平均價線的顏色 BuyAvgLineStyle 設定多頭平均價線的風格 SellAvgLineClr 設定空頭平均價線的顏色 SellAvgLineStyle 設定空頭平均價線的風格 WeigthAvgLineClr 設定加權平均價線的顏色 WeigthAvgLineStyle 設定加權平均價線的風格
FREE

It can only be used in EURCHF / M15 . The Expert Advisor is a great tool that allows you to control your trade with ease and precision. The tool can be moved in the graphs and offers the following characteristics:
Instant order entry with a single click. Entry of pending orders using price tags and trend lines. Instant order closure with a single click. Instant order closure using trend lines as output levels that the broker can not see. We can modify the way to enter and exit the market, allo
FREE

Advisor Information: EG Connection Alert FREE every hour sends simple push notifications about the presence of a terminal connection to the server.
The utility will be useful to you if automated trading is carried out on a remote machine and there is no possibility to constantly check the operation of the terminal. Just install the adviser on any chart with any timeframe. You will receive notifications about the connection every hour. If no notifications are received, the terminal should be che
FREE

Overview The script displays information about the trade account and the current financial instrument. Information about the trade account: Account - account number and type (Real or Demo); Name - name of the account owner; Company - name of a company that provide the access to trading; Server - trade server name; Connection State - connection state; Trade Allowed - shows whether trading is allowed on the account at the moment; Balance - account balance; Equity - account equity; Credit - amount

Description Keltner's colored channel indicator,also called STARC band, drawn in the main chart window. The indicator uses the calculation technique of the three drawing options: basic, improved and modified . The first two were proposed by Keltner, the third one - by a successful trader L. Rakshe. You can also search for your own best parameters of the indicator. The upper, middle and lower bands can be colored. The indicator includes the basic analytical tool of the market moods by Keltner. Th

Profitstat premium version scans your trading history and displays performance on the chart. The premium version is far more flexible than the free one. The premium version contains the following features that you won't find in the free version: Ability to horizontally position the indicator as you prefer. Ability to display results in money or in pips with the option to hide or display one or both of them. An option to show stats for only the chart symbol. An option to only show data from a cer
Description Keltner's colored multicurrency/multisymbol channel indicator, also called STARC band, drawn in a separate window below the chart of the main financial symbol. The indicator uses the calculation technique of the three drawing options: basic, improved and modified . The first two were proposed by Keltner, the third one - by a successful trader L. Rakshe. You can also search for your own best parameters of the indicator. The upper, middle and lower bands can be colored. The indicator
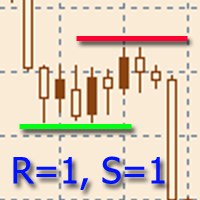
該指標旨在建立水平支撐和阻力水平。
水平搜索算法基於對極值的分組。
可以顯示每個級別的統計信息,通過多個屬性過濾級別的顯示,根據級別的類型(支撐或阻力)調整配色方案。 特點: 指示器已準備好工作,在大多數情況下不需要特殊設置 手動或自動選擇極值範圍以構建關卡 選擇要顯示的最近級別數以防止圖形混亂 靈活的圖形設置(顏色、線條和箭頭樣式) 要微調指標,您可以啟用輔助圖形元素的顯示,例如極值、極值分組區域等。 通過多個參數過濾級別的顯示 能夠在價格超過水平時啟用警報,具有可調節的滯後性 一鍵顯示關卡詳情(會顯示關卡事件) 能夠靈活自定義關卡屬性的顯示 可在一張圖表上運行多個指標(需要額外配置) 热键可用于轻松控制指示器。 可以为可用的那些功能分配大量的键选择。 在購買產品之前,您可以在這裡提出任何問題: https://www.mql5.com/en/messages/01D3CB151D42D801

TimeFilter indicator allows you to visually select bit masks (GoodHourOfDay, BadHoursOfDay, GoodDayOfWeek, BadDaysOfWeek) for the Intraday Time Filter module of trading signals of the Standard Library. The use of time filters allows you to take into account the particulars of each trading session in performing trading operations.

The indicator is an inter-week hourly filter. When executing trading operations, the indicator allows considering time features of each trading session. Permissive and restrictive filter intervals are set in string form. The used format is [first day]-[last day]:[first hour]-[last hour]. See the screenshots for examples. Parameters: Good Time for trade - intervals when trading is allowed. Bad Time for trade - intervals when trading is forbidden.
time filter shift (hours) - hourly shift. percent
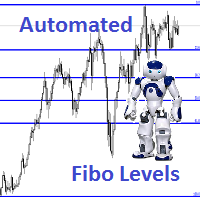
Description Fibo Levels is an indicator that automatically plots Fibonacci levels. The levels are calculated and plotted over a certain interval using the number of bars specified by the user . When the price achieve one of the target levels (23.6%, 38.2%, 50% or 61.8%) the indicator at the request of the user gives a sound signal and/or sends the message by e-mail. Example of the e-mail notification: Subject: Fibo Up Signal Message: Signal,H1 - Correction of EURUSD reached 23.6% - 2014

本 EA 修改当前交易品种已开单的止损位。 使用以下指标 抛物线停止和反转 , NRTR (Nick Rypock 尾随反转) , 移动均线 。 切换模式: 只在盈利时尾随停止; 只根据价格尾随停止; 在每次报价或柱线完成时 (已形成); 每笔订单或累积持仓尾随。
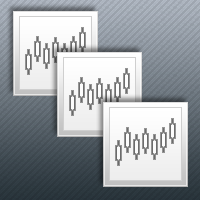
本产品可以方便用户比较不同图表的K线,还可以方便地查看同一商品在不同时间周期中的K线形态。
将脚本附加到一个图表上,移动K线,或者改变显示比例,所有打开的图表上的K线将与当前的图表上的K线按照时间对齐,并且同步移动。
如果不同图表上的K线的周期不同,将会根据K线的起始时间进行对齐。
使用前请确保相关的历史数据已经下载到本地。
欢迎提出宝贵建议或意见,请与我联系。
。。。。。。。。。。。。。。。。。。。。。。。。。。。。。。。。。。。。。。。。。。。。。。。。。。。。。。。。。。。。。。。。。。。。。。 。。。。。。。。。。。。。。。。。。。。。。。。。。。。。。。。。。。。。。。。。。。。。。。。。。。。。。。。。。。

The EA performs trade operations of closing position groups. Positions are grouped by type. It is possible to select orders by the profit (loss) value. It is possible to form the closure groups manually. You can set a value for automatic closure of a positions group after reaching a certain profit/loss level or price level. The additional functions of the EA are called using the hot keys: SHIFT+A - show/hide Auto exit options. SHIFT+S - show/hide Settings panel. SHIFT+V - sound ON/OFF. SHIFT+I -
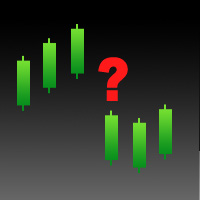
。。。。。。。。。。。。。。。。。。。。。。。。。。。。。。。。。。。。。。。。。。。。。。。。。。。。。 本产品用于检测外汇行情历史数据。
质量好的历史数据对于交易者作行情分析或回测非常重要。但是各家外汇券商提供的历史数据的质量参差不齐,有时我们会留意到K线序列有缺失,但有时不易察觉。本产品帮助用户定位这些缺失位置。如果某图表上某个时段出现许多缺口,你就要小心历史数据是否可靠,也许要考虑换一个更好的行情服务器。
这个产品用编号标记K线上出现的缺口,并计算出缺口大小,以及其他相关参数。 。。。。。。。。。。。。。。。。。。。。。。。。。。。。。。。。。。。。。。。。。。。。。。。。。。。。。。。。。。。。。。。。

The Expert Advisor for increasing (or opening) market positions. Allows specifying the desired risk, target and searching for the best open price and trade volume.
Configurable Parameters: lots - directly the volume of the position increase.
% equity - the amount of growth as a percentage of the amount of funds.
stop loss - directly the level of the stop loss order.
loss - the level of the stop loss order depending on the allowable loss.
take profit - directly the take profit level of
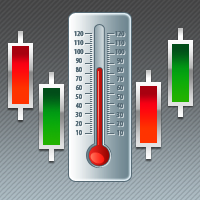
有的交易策略适合波动较小的、安静的行情,而有的策略适合波动较大、剧烈的行情。不管是哪种策略,交易者都应当对行情的冷热程度有清晰的量化标准。 本产品方便交易者对比不同交易品种的冷热程度,或者同一交易品种在不同时间段的交易热度。 你可以将它放在不同图表上,获得直观的感受。哪个品种热度更高,哪个交易更淡静,一目了然。 下方的颜色指示器显示瞬时的价格跳动情况,而左上角的数字显示的是一段时间内的温度累积均值。 。。。。。。。。。。。。。。。。。。。。。。。。。。。。。。。。。。。。。。。。。。。。。。。。。。。。。。 。。。。。。。。。。。。。。。。。。。。。。。。。。。。。。。。。。。。。。。。。。。。。。。。。。。

Description Fibo Levels is a color multicurrency/multi-symbol indicator that automatically plots Fibonacci levels on a candlestick chart in a separate window below the chart of the main financial instrument. It can be used with any broker, regardless of the name of a financial instrument used because the symbol name must be entered manually as an input parameter. If you enter a non-existent or invalid name of a financial instrument, you will receive an error message saying that the specified f

Description Fibo Levels is a color multicurrency/multi-symbol indicator that automatically plots Fibonacci levels on a Heiken Ashi chart in a separate window below the chart of the main financial instrument. It can be used with any broker, regardless of the name of a financial instrument used because the symbol name must be entered manually as an input parameter. If you enter a non-existent or invalid name of a financial instrument, you will receive an error message saying that the specified

Description Fibo Levels is a color multicurrency/multi-symbol indicator that automatically plots Fibonacci levels on any of the following six standard indicators ( AD, OBV, MA, Momentum, ATR and StdDev ) in a separate window below the chart of the main financial instrument. It can be used with any broker, regardless of the name of a financial instrument used because the symbol name must be entered manually as an input parameter. If you enter a non-existent or invalid name of a financial ins

Description Impulse Pro is an indicator's impulse trading system based on Moving Average and MACD Line . The idea of the impulse system based on Moving Average and MACD Histogram was first offered by Dr. Alexander Elder in his book "Come Into My Trading Room". The system allows users to choose the calculation method (Moving Average and MACD Line) based on a single, double or triple moving average. You can color bullish and bearish moods.
Inputs Calc_Method - Moving Average and MACD Line calcul

Description Impulse Pro is an impulse system based on two indicators - Moving Average and MACD-Histogram . The impulse system was first designed by A. Elder and is featured in his book "Come Into My Trading Room: A Complete Guide to Trading". The system is based on the Moving Average and MACD-Histogram. This product is distinct in that it allows the user to choose the system calculation method (Moving Average and MACD-Histogram) based on a single, double or triple moving average. There is pos
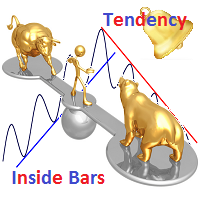
Description The indicator determines the appearance of internal bars on the chart, and paints them in accordance with the bullish and/or bearish mood. The indicator is different from Inside Bar in the same way as Tendency Reversal Bars is different from Reversal Bars . In other words, the indicator defines the appearance of internal bars during a bullish or bearish trend rather than defining their single appearance. The indicator can notify of the appearance of a formed internal bar by playi

Description Impulse Pro Global is an indicator's impulse trading system based on Moving Average and MACD Line Global . The idea of the impulse system based on Moving Average and MACD Histogram was first offered by Dr. Alexander Elder in his book "Come Into My Trading Room". The system allows users to choose the calculation method ( Moving Average and MACD Line Global ) based on a single, double or triple moving average with identification of primary signal of probable reverse of the previ

CorExTi is a tool that will save you literally hours in your daily routine to draw lines and other graphic elements in your charts. With a temporary panel discreetly displayed on your screen at the touch of a graphic element as trendline: Changes the object between 4 favorite line styles (with color, line thickness and style) Cuts trendlines, when are extended, just at the point where you touch them Extends trendlines (active property of Ray) which are not extended Or deactivates visualizat

The best way to monitor multiple pairs within little workspace. RotaGrafico sequentially displays up to 6 different pairs. It has buttons to set a pair more time for observation. Normal exposure time adjustable. Broad exposure time adjustable. Combine in a profile, Rotagrafico and use the rest of your workspace to the pair that you want to analyze in detail.

Description Impulse System Global is an indicator impulse trading system based on Moving Average and MACD Histo Global . The idea of the impulse system which is based on Moving Average and MACD Histogram was first offered by Dr. Alexander Elder in his book "Come Into My Trading Room". The system allows users to choose the calculation method ( Moving Average and MACD Histo Global ) based on a single, double or triple moving average with identification of primary signal of probable reve

Description Impulse Grand Global is an indicator impulse trading system based on Moving Average and MACD Classic Global . The idea of the impulse system based on Moving Average and MACD Histogram was first offered by Dr. Alexander Elder in his book "Come Into My Trading Room". The system allows users to choose the calculation method ( Moving Average and MACD Classic Global ) based on a single, double or triple moving average with identification of primary signal of probable reverse of

This script allows you to close all orders and delete all pending orders. Set to true order type you want to close and cancel. Parameters:
AllCurrency = set true to close position and cancel order in all pair, set false for current pair. CloseBUY = set true to close buy position. CloseSELL = set true to close sell position. DeleteBUYSTOP = set true to cancel buy stop order. DeleteSELLSTOP = set true to cancel sell stop order. DeleteBUYLIMIT = set true to cancel buy limit order. DeleteSEL

Did you have to start again the very same analysis because the original one, from where you want to modify, just have so much information that no longer fits? Have you ever wanted to change some in one of your charts and make this new line, Fibo or channel automatically appear in some or the rest of your set of charts? Object Copier is the solution to replicate any object into one or several charts at your desire. No matter if you changed an object, or made it from the scratch. With Object Copie

Controladora 在西班牙语中意为控制器, 这是一款简单而强大的 EA, 可令您轻松、精确地控制您的交易。 您是否希望在价格穿越趋势线时终止您的交易?不要担忧, Controladora 能够做到。您是否希望在价格到达通道顶端时止盈?Controladora 能够做到。 按照您帐户的确切比例计算开单, 其大小代表亏损时占您余额的百分比, 如果您正在剥头皮, 进行这种计算时间昂贵且几乎不可能对您有帮助。利用 Controladora 则无此问题, 使用标准止损点数或您希望的的一个固定值。 当您希望评价一个交易信号, Controladora 通过显示级别帮助您查看是否风险盈利与您的策略标准相匹配, 在何处您需要离场来兑现风险回报。 您是否希望将一笔交易自动划分为多个止盈价位?利用 Controladora 这没问题, 它可以放置每笔交易作为完整操作或划分为若干笔小交易。 您是否只用收盘价停止 (意即只在蜡烛高于或低于给定的级别时才开、平仓), Controladora 能够做到。 利用 Controladora 您可以通过点击买入和卖出按钮直接开单, 但您也可以将停止程序化并利用

The Expert Advisor notifies that a price has crossed a line on the chart. It handles two types of lines - horizontal line and a trendline. The number of lines is unlimited. Parameters: prefix of signal line - prefix of object (line) names processed by the indicator. If the parameter is empty, it handles all object types: horizontal lines and trendlines. price Mode - price type (bid or ask). timeout - crossing alert timeout. number of repeats - the limit of crossing alert repeats. number of comme

When you combine short term fibos with the long term, your chart get missed up with a lot of lines that hardly make sense at first view. The best way to improve the clearness and there for the easiness to read your chart is by deleting the fibo levels that you no longer need, for example those levels that the price proved didn’t work as support or resistance. With Fibo Pro, you can activate or deactivate from a set of fibo levels pre-settled by you, without miss with the default fibo configurati

自动交易驾驶员 是一款强力工具 (作为 EA 运行),帮助您管理风险,控制订单,以及通过多重保护/尾随停止规则来最大化您的盈利。 此工具对于剥头皮和趋势跟随交易者都很有用。它不仅计算交易的准确风险,而且还可以实时地保护并最大限度地提高您的利润。 拥有这个工具,您所要做的唯一一件事就是根据您自己的策略入场交易,它会按照您选择的出场策略自动驱动您的持仓。 用于测试的演示版在此下载: https://www.mql5.com/zh/market/product/4660 自动交易驾驶员结合了两种工具: 我的资金经理: https://www.mql5.com/zh/market/product/5398
交易控制器: https://www.mql5.com/zh/market/product/5405 以下是主要功能: 1. 下单面板 这个面板用来计算您能够接受的风险范围内的交易量。您可以选择指定的余额百分比作为入场价和止损,即您可承受的亏损点数 (包括佣金), 此工具将自动计算所需交易量。 之后, 您只需在 BUY, SELL, 或 PLACE ORDER (挂单) 按钮上点击一次,

Description Impulse Smart is an indicator impulse trading system based on Moving Average and MACD Classic Smart with sound notification . The idea of the impulse system based on Moving Average and MACD Histogram was first offered by Dr. Alexander Elder in his book "Come Into My Trading Room" . The system allows users to choose the calculation method ( Moving Average and MACD Classic Smart ) based on a single, double or triple moving average with identification of primary signal of pr

Description Fibo Levels Custom is a color multicurrency/multi-symbol indicator that automatically plots Fibonacci levels on the Market Mood Oscillator in a separate window below the chart of the main financial instrument. It can be used with any broker, regardless of the name of a financial instrument used because the symbol name must be entered manually as an input parameter. If you enter a non-existent or invalid name of a financial instrument, you will receive an error message sayin

This is a semi-automatic Expert Advisor. A user draws a support or a resistance line in the form of a horizontal line or a trendline on a chart. A command in the format of UP|DN_xxxx:yyyy is specified in the line name; the Expert Advisor understands it as a signal to buy or sell setting a stop loss and a take profit. EA settings include a parameter with a lot size and a value for moving stop loss to breakeven. If stop loss = 0, the EA does not use breakeven. If this parameter is greater than zer

本EA提供以下功能: 开仓: 价格穿越趋势线时,开多单或者空单 平仓: 价格穿越趋势线时,平多单或者空单 追踪止损: EA会沿着趋势线,不停的提升多单的止损或者降低空单的止损 线可以是趋势线也可以是水平线, 趋势线可是射线或者线段,线段有个特别作用就是只在线所在的时段内交易。 这些能开仓和平仓的线都是有特定名称的线,EA提供了画线面板代替手工画线. 所有开仓,平仓都会有截图保存在MQL4/Files/Cross Trend Line to Trade文件夹中. EA可以在复盘测试终端使用, 付费购买之前请先下载, 在复盘测试中试用. МТ5 版本: https://www.mql5.com/zh/market/product/107557
画线面板: 点击绿色的"+"按钮,会逐一生成6组面板,每组面板可以点击相应的按钮来绘制趋势线或者水平线 点击紫色按钮,可以选择线类型: Trend Line(趋势线) 或者水平线(Horizontal Line) 点击Del可以删除所有画线 点击X可以关闭面板,回到最初的状态. 点击按钮B1,B2,B3,B4,B5则会绘制五条线, 当价格穿越

Description Fibo Retracement is an indicator that automatically plots Fibonacci levels in the main chart based on Close prices , which distinguishes it from the Fibo Levels indicator that plots levels based on High/Low prices. Thus, using both indicators provides the trader with the opportunity of determining support and resistance zones by Fibonacci! The levels are calculated and plotted over a certain interval using the number of bars specified by the user. The user can display Fibonacci l
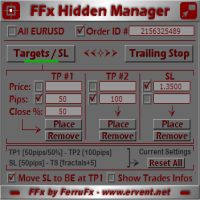
面板 FFx 隐藏管理 轻松帮助您在图表上直接管理您的订单。下面描述所有特征: 止盈, 止损和尾随停止均隐藏 每笔交易在图表上都有自己的指示线 可按您的需要拖拽任何线来改变止盈/止损 当止盈 #1 到达,自动将止损位移到盈亏平衡位置的选项 选择止盈/止损类型的选项 (通过点数或价格) 选择尾随停止类型的选项 (通过点数, MA, 分形, PSAR 或 ATR) 定义哪些订单您希望在当前图表上进行管理 (所有订单或特定单号) 最大化 / 最小化面板按钮 在图表上将面板拖拽到任意位置 显示交易信息的选项 如何使用它? (参看以下截图) 选择您希望管理的订单 (所有或特定的) 设置您的目标, 止损和尾随停止 … 之后点击 “放置”。它们都独立工作,这样您就只需设置一次。 如果您希望删除一个止盈, 止损或尾随停止, 选择正确的订单 … 然后点击 “删除” 当您选择设置 “所有当前符号”, 则 “当前设置”显示在面板里。这些设置将自动用于所有新开订单。若要重置/删除这些设置, 点击 “重置所有”。 如果 “显示交易信息”被选中, 一个新的小表格显示在面板之下, 包括每笔订单及其当前的目标和尾随停

Description Strongest Level is an indicator that automatically plots the nearest levels of strongest resistance and support in the main chart based on prices of the current timeframe. Repeated usage of the indicator with various number of bars creates a system of support and resistance! The indicator calculates and plots levels based on number of bars set by the user. It is recommended to set numbers from a golden ratio according to Fibonacci (13, 21, 34, 55, 89, 144, 233, 377, 610 etc.). Users

Description Strongest Higher Level is an indicator that automatically plots the nearest level of strongest resistance and support in the main chart based on prices of the higher timeframe that differs it from Strongest Level indicator. Repeated usage of the indicator with various number of bars creates a system of support and resistance! The indicator calculates and plots levels based on number of bars set by the user. It is recommended to set numbers from a golden ratio according to Fibonacci

I like trading manually, so I created this tool to make my trade more easier and faster.
Features Money management. Click for place order ( Buy/Sell/BuyStop/BuyLimit/SellStop/SellLimit). Many buttons for control your account (Close All, Remove Pendings, Breakeven, Hedging). Auto hide if not use for 2 minutes. See profit on current symbol. Free to move panel to where you want. Save your settings for using on next time. Special: It's work on backtest mode! You can use this for training yourself.
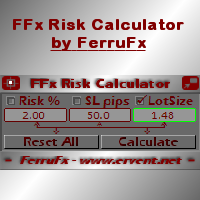
FFx Risk Calculator panel will help you to calculate very easily your trades size, SL or the risk directly on the chart. All features are described below: Option to select which parameter to calculate: Risk, Stop Loss or Lot Size The panel will show if the lot size is allowed according to the current account free margin Button to maximize/minimize the panel Drag and Drop the panel anywhere on the chart How to use it? Select the parameter you want to be calculated. It will be based on the 2 other

BreakEven shows the location of the average price level of the orders in the symbol, to which the indicator is attached. This information allows you to find the break-even. The indicator is helpful if you manage several positions, since it allows you to evaluate the performance of your open trades in a glance. If you trade a single order, it allows you to evaluate the effect of your stop loss and the profit or loss during the time your trade is open. Apart from drawing a break-even level line (w
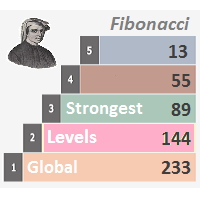
Description Strongest Levels Global is a colored multicurrency/multisymbols indicator that automatically plots a system of the nearest levels of strongest resistance and support in the separate window on one of nine different indicators of the current timeframe in accordance with user's choice. Repeated usage of the indicator with various number of bars creates an extended and confirmed system of support and resistance! The indicator calculates and plots levels based on the number of bars set b

Description DealsCopyMaster opens additional positions on a single symbol in the appropriate amount and tracks them automatically. Opening additional positions may be necessary in case a subscriber starts to lag behind the provider dramatically in the volumes of the currently opened positions and in the volumes difference when provider's balance was at some moment of time equal to the current subscriber's one. In multicurrency/multisymbol mode, the EA is attached to the chart of each financial i

Trades Viewer is a trading helper app for a serious trader. It offers several important data like day range, 22 days average range and predefined PL. It draws trades history and current open positions on a chart. It has a detail panel for viewing a particular trade with just a click on that trade. All these make it very convenient and straightforward to view your entry/exit positions and thus improve your trading system.
Features Profit/loss of the current symbol, counting all trades of the sy
Attention: Demo version for review and testing can be downloaded here . It does not allow trading and can only be run on one chart.
Active Lines - a powerful professional tool for operations with lines on charts. Active Lines provides a wide range of actions for events when the price crosses lines. For example: notify, open/modify/close a position, place/remove pending orders. With Active Lines you can assign several tasks to one line, for each of which you can set individual trigger condi

This is a system consistent of 2 components: RepliTrades Source: It sends the trades to one or more terminals into the same Computer RepliTrades Trader: It trades the orders sent by RepliTrades Source Please watch the video to learn how it works and use it.
Features: Manage up to 300 trades at same time in each terminal. Work with any broker, no matter if uses suffix or prefix in symbols names. Replicate pending orders (limits or stops orders) or direct trades (market orders, etc) and its mo

The indicator that helps you by plotting a reference to easily determine if a scalping trade (or intraday trade) has chances to work out in your favor. One of the most common issues intraday traders have is the lost of reference to know if a movement is big or small due to the scaling of the chart. With this indicator, you have 3 visual aids on your chart that will help you: "Screener" : Please set the normal stop loss size that you usually apply in your strategy. This will plot a rectangle afte

This indicator plots a crosshair pointer in all charts of the terminal in the position relative to the active chart. To activate the Pointer Sync, just press the "+" button that will appear in one of the 4 corners of the chart where the indicator is added. To deactivate the Pointer Sync, just press the "+" button again. Once Pointer Sync is deactivated, the cross lines will disappear in all charts as well. You can adjust the color of the pointers and the button, the corner where the button appea
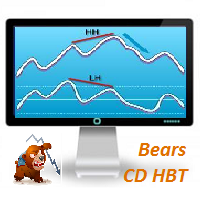
Description Bears CD HBT (Bears Convergence/Divergence High Bottom Top) is a universal analytical bears convergence/divergence indicator between a financial instrument and any of the twenty two standard indicators included in МT4 package. The indicator is the first out of the two possible versions (HBT and HTB) of the bearish convergence/divergence origins. Due to its multiple use feature, the indicator allows you to find convergences/divergences between the price and various standard indicators

Overview A One-Cancels-the-Other Order (OCO) is a pair of orders stipulating that if one order is executed, then the other order is automatically cancelled. Verdure OCO EA brings this functionality to MT4. This EA is a robust implementation of the popular One-Cancels-the-Other Order (OCO) but with added benefits, features and options. It is an EA that helps with trade management and especially useful for traders who use stop and reverse trading systems, traders who look for opportunities around
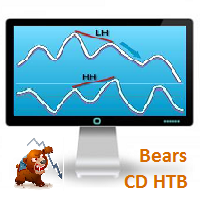
Bears CD HTB (Bears Convergence/Divergence High Top Bottom) is a universal analytical bears convergence/divergence indicator between a financial instrument and any of the twenty two standard indicators included in МetaTrader 4 package. The indicator is the second out of the two possible versions (HBT and HTB) of the bearish convergence/divergence origins. Due to its multiple use feature, the indicator allows you to find convergences/divergences between the price and various standard indicators
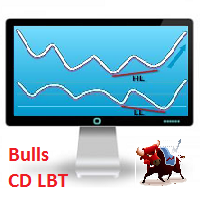
Description Bulls CD LBT (Bulls Convergence/Divergence Low Bottom Top) is a universal analytical bulls convergence/divergence indicator between a financial instrument and any of the twenty two standard indicators included in МT4 package. The indicator is the first out of the two possible versions (LBT and LTB) of the bullish convergence/divergence origins. Due to its multiple use feature, the indicator allows you to find convergences/divergences between the price and various standard indicators
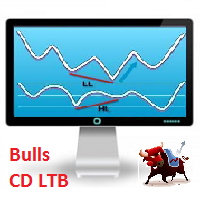
Description Bulls CD LTB (Bulls Convergence/Divergence Low Top Bottom) is a universal analytical bulls convergence/divergence indicator between a financial instrument and any of the twenty two standard indicators included in МT4 package. The indicator is the second out of the two possible versions (LBT and LTB) of the bullish convergence/divergence origins. Due to its multiple use feature, the indicator allows you to find convergences/divergences between the price and various standard indicators

Having a trade about to reach its take profit and suddenly see that it turns around to go strait ahead to your Stop Loss is one of the few things that makes me curse (a lot). This is why I created AntiCurse. Just add this Expert Advisor to an empty chart, set a "Trigger" and "Lock" in its properties and you'll have one less reason to curse!
AntiCursing Settings: "Trigger" is set in percentage terms, it is the distance between the entry price and the Take Profit that needs to be covered in orde
您知道为什么MetaTrader市场是出售交易策略和技术指标的最佳场所吗?不需要广告或软件保护,没有支付的麻烦。一切都在MetaTrader市场提供。
您错过了交易机会:
- 免费交易应用程序
- 8,000+信号可供复制
- 探索金融市场的经济新闻
注册
登录