适用于MetaTrader 4的技术指标 - 19

Contact me after payment to send you the User-Manual PDF File. Divergence detection indicator with a special algorithm. Using divergences is very common in trading strategies. But finding opportunities for trading with the eyes is very difficult and sometimes we lose those opportunities. The indicator finds all the regular and hidden divergences. (RD & HD) It uses an advanced method to specify divergence. This indicator is very functional and can greatly improve the outcome of your trading. Thi

Modified oscillator MACD. A classic indicator that combines a trend indicator with an oscillator to detect entry points. Has a multi-timeframe panel and 3 types of notifications
Benefits:
Works on all instruments and timeseries Trend indicator with oscillator for inputs Multi-period panel on all timeframes Pluggable arrows when signals appear Three types of notifications: push, email, alert
MT5 version -> HERE / Our news -> HERE
How the indicator works:
AW Classic MACD - Indicato
FREE

Download the free version here.
A Full Concept of BUY/SELL Scalping Strategy Trend detection is one of the basic challenges of every trader. Finding a way to tell when to enter a trade is very important, timing is a game changer, not too early and not too late. Sometimes, due to not knowing the market conditions, the trader closes his positions with a small profit or allows the losses to grow, these are the mistakes that novice traders make. Indicator Trend Whipper is a complete trading st
FREE

A supply and demand indicator designed with a minimalist trading strategy based on the nature of the market. The Bull zone is a strong support area, and the Bear zone is a strong resistance area. When a Bull zone was breakout, it becomes the "base" of the Bears and vice versa. When the price meets these areas, there is a high probability that the price will turn around, so we call them Obstacles. It is a suitable indicator for traders interested in manual price action and algorithmic trading up
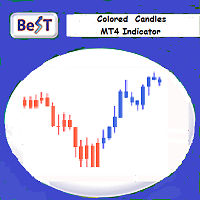
BeST_Colored Candles is an MT4 FREE indicator that can change the color of the Candlesticks based on the MACD, SAR or RSI values and levels. It is a Composite indicator that by selection uses the values each one of these 3 indicators and their critical levels in order to create numerical relationships that when satisfied cause their corresponding candlesticks coloration.
Input parameters
== Basic Settings
-- Please Select Indicator - for selecting which one of the above 3 indicator
FREE
Highly configurable Moving average indicator.
Features: Highly customizable alert functions (at levels, crosses, direction changes via email, push, sound, popup) Multi timeframe ability Color customization (at levels, crosses, direction changes) Linear interpolation option Works on strategy tester in multi timeframe mode (at weekend without ticks also) Parameters:
MA Timeframe: You can set the lower/higher timeframes for Ma. MA Bar Shift: Y ou can set the offset of the line drawing. MA Perio
FREE
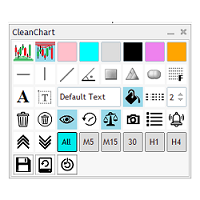
Do you get tired of having a messed up chart with chart objects from various pairs showing up on your current chart? Do you find it boring to have to click multiple clicks to update object colors and styles? Do you want to be able to load a specific set of configurations for your mostly used chart objects? Look no further, CleanChart has it all. 6 customizable Colors User configurable Support and Resistance Colors 10 mostly used chart objects Timeframe visible of any of the objects created Set m
FREE

该指标分析指定数量的蜡烛并根据高低绘制斐波那契水平。 由于级别正在重新排列,我们对范围的右侧感兴趣。 价格会吸引水平并对触摸做出反应。 使用此工具在修正后找到趋势入口点。 如果在左边我们看到水平已经完美上升,那么我们可以假设我们已经在极值点找到了运动的终点。 所有线条都通过缓冲区或对象绘制(可选)。
输入参数 。
Bars Count - 计算范围 。
Visual Button - 按钮显示(启用/禁用) 。 Corner - 按钮锚定角度 。 X indent - 以像素为单位的水平填充 。 Y indent - 以像素为单位的垂直填充 。
Label Visual - 显示级别标签 。 Label Font Size - 字体大小 。 Label Shift Bars - 在酒吧的铭文的缩进 。 Label Tooltip - 在关卡上方的光标下显示文本 。
Draw Lines - 使用缓冲区或对象绘制 。 Box Visual - 启用/禁用框视觉 。 Box Width - 箱线粗细 。 Box Style - 框线样式
FREE

Indicator measures strength of each currency in your list.
Main idea: It simply iterates through all combinations of pairs and adds difference between open and close in percent. Parameters: List of currencies - what currencies will be calculated (maximum is 8) Calculation type - from which data will be strength calculated Calculation data input - used as input related to calculation type Symbol suffix - used in case of suffix on symbols, e.g: when your symbols look like EURUSDm, EURUSDmicro et
FREE

The "Dagangduit Spread Indicator" is a versatile tool designed to provide traders with essential information about the current spread in the chart window. This indicator offers customizable features, including font parameters, display location on the chart, spread normalization, and alerts to enhance your trading experience. Key Features: Real-time Spread Display : The indicator displays the current spread in real-time on your trading chart, allowing you to stay informed about the cost of execut
FREE
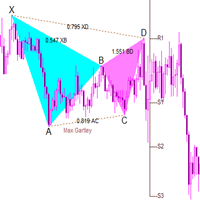
目前全额购买折扣中 ! 任何交易者的最佳伙伴! 该指标为经典的蝴蝶指标(谐波交易),默认可以识别20种形态并进行提示,也可以加入自定义形态的参数进行自定义提示, 提示合适的止损和获利水平。 该指标内置的算法独一无二,为独门的波段算法 . 指标特性 Gartley形态又称Gartley“222”, 最初由美国形态技术分析的先驱H.M.Gartley在1935年提出的,它发现了4个单独价格段之间的黄金分割关系,目的是指导大家怎样在无序的区间市场里交易。 目前在其基础中发展出非常多的形态, 本指标将其归类并且融合对波段的算法. 基本内容 包含20种价格形态 历史与当前的形态判断 止损和获利水平 电子邮件/声音/警报 基本设置 设置计算的周期。
设置指标波段算法1.灵敏 2.稳定 设置谐波指标计算模式选择 1.默认算法 2.自定义算法 3.两个算法都需要 自定义形态名称, 以及XA-B MIN XA-B MAX AB-C MIN AB-C MAX BC-D MIN BC-D MAX XA-D MIN XA-D MAX共8个参数,加上形态名字共计9组参数,

这是免费产品,欢迎您根据您的需要使用!
我也非常感谢您的积极反馈! 多谢!
// 这里提供更多优秀的 EA 交易和指标: https://www.mql5.com/en/users/def1380/seller // 也欢迎您加入盈利、稳定、可靠的信号 https://www.mql5.com/en/signals/1887493 ............................................................................................................. MT4 的外汇指标点差显示,交易支持。
点差显示指标显示其所附着的外汇对的当前点差。 可以将点差显示值定位在图表的任何角落: 0 - 左上角、1 - 右上角、2 - 左下角、3 - 右下角 还可以设置颜色和字体大小。 它是仅在该 MQL5 网站上提供的原创产品。
FREE
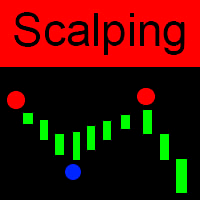
Globex 360 Scalping 是一種獨特的剝頭皮指標,可顯示價格反轉點。借助該指標,您將在圖表上看到價格何時反轉,此時您可以按照信號的方向進行交易。這是交易新手和專業人士不可或缺的助手。該指標向交易者顯示有效交易的重要和有價值的信息。 Globex 360 Scalping - 應用平滑掃描技術進行市場分析。該指標掃描價格方向,跟踪技術指標的走勢,疊加獲得的結果,並根據這些信息向交易者顯示信號。
如何使用 Globex 360 Scalping 進行交易? 當出現紅點時 - 打開賣出交易!止盈設置在距開倉的最小距離處。 當出現藍點時 - 打開買入交易!止盈設置在距開倉的最小距離處。
Globex 360 倒賣指標優勢: 適用於所有主要貨幣對。 適用於所有時間範圍。 信號幾乎從不延遲。 固定蠟燭後,指標不會重新繪製其信號。 非常容易使用。 Globex 360 Scalping 取代了 12 個標準指標。 與包括 Globex 360 在內的所有經紀商合作。
Globex 360 倒賣設置: move_step - 此參數指示用於分析的計算

What is the Volume Weighted Average Price (VWAP)? The volume weighted average price (VWAP) is a trading benchmark used by traders that gives the average price an instrument has traded at throughout the day, based on both volume and price. It is important because it provides traders with insight into both the trend and value of the instrument.
What is the Difference between VWAP and AVWAP? While VWAP is having as starting point the beggining of the day,week,month etc. in the AVWAP you can pla

Make no mistake, this is not just another indicator; it's much more than that!
Welcome to a groundbreaking approach! Sunrise Divergence is not just another tool; it represents a deep understanding in how market dynamics are analyzed and traded. This indicator is crafted for traders who seek to navigate the markets with precision, leveraging the powerful concept of asset correlation, both positive and negative, to unveil trading opportunities that many overlook. In the markets, understanding t

Drawdown Alerts Free ! Meta Trader 4 Indicator. Please leave a review about this product to help other users benefit from it. This Drawdown Alerts indicator shows the drawdown percentage in real time and alerts you when the limit you specify is reached. Calculation of drawdown depends on the amount of the trade balance. You can customize Drawdown Alerts for Corner - Left , Right , Up , Down X Y Color Number of decimal digits Popup messages and sound - Turn on / off notifications Notification
FREE

This is a modified Fractals indicator. It works similar the original Bill Williams' indicator, and is additionally enhanced with the possibility to change the top radius, in contrast to the standard radius of 2 bar. Simply put, the indicator checks the top and if it is the minimum/maximum in this radius, such a top is marked by an arrow. Advantages Adjustable radius. Use for drawing support and resistance levels. Use for drawing trend channels. Use within the classical Bill Williams' strategy or
FREE

The Breakout Indicator That Has Been Proven & Tested! Breakout Analyzer uses an advanced algorithm based on high probability price patterns. Each trade is analyzed on the statistics panel to help you evaluate the best breakout setups.
Bonus Strategy 1
Breakout Analyzer with Volume Critical Watch Video: (Click Here)
Bonus Strategy 2
Breakout Analyzer with Strength Meter
Watch Video: (Click Here)
Features Universal compatibility to different trading systems Analyzes statistics of breako
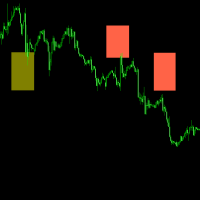
用这个指标,应用于货币兑非常好用,比如欧元、英镑、澳元、纽元、加拿大元、瑞士法郎 可以很容易找到的上下区间 国际上标准的大平台都很好用,不建议使用小平台.推荐瑞讯银行.或者EXNESS.
瑞讯开户链接: https://trade.swissquote.ch/signup/public/form/full/fx/com/individual?lang=cn&partnerid=daf9af43-2f95-443e-86c5-89ce1ab2bd63#full/fx/com/individual/step1 EX开户链接: https://one.exness.link/a/t2v0o2v0 只要稍微懂一点交易,用上这个指标的辅助,就如鱼得水 这个指标能告诉我们方向和价格区间 红色是做空 深黄色是做多 这个指标是本人独立开发,任何问题都能联系我,可以留言,也可以在TG找我。 用法: 行情遇到色块会回头 上方色块做跌 下方色块做涨 下单位置在色块边缘及色块中央 止损位置在色块外 止盈位置无法固定,参考前面的行情。
FREE

ON Trade 启明星蜡烛图指标 启明星蜡烛图模式是一个强大且直观的蜡烛图模式,可以为市场情绪和潜在趋势反转提供有价值的见解。它以蜡烛的一端具有非常小或不存在的影线(上下影线),而另一端有一个延伸到当前趋势方向的长实体为特点。该模式表示买家和卖家之间的强烈失衡,暗示市场动力明显单边。 特点和优势: 清晰的市场情绪: 启明星蜡烛清楚地描绘了主导市场情绪。牛市(白色)启明星表明从开盘到收盘价格有强劲的买入压力,而熊市(黑色)启明星表示有强烈的卖出压力。 趋势延续或反转: 根据背景,启明星模式可以信号趋势延续或潜在趋势反转。当它们出现在长时间趋势后时,可能表示趋势将继续。相反,出现在支撑或阻力区域附近的启明星蜡烛可能暗示潜在反转。 简单可靠: 启明星模式在价格图表上相对容易识别,并且与其他技术分析工具结合时可以提供可靠的信号。 如何使用启明星蜡烛图指标: 识别启明星模式: 该指标在您的价格图表上识别和标记启明星模式。它突出显示牛市(向上)和熊市(向下)启明星模式,使其易于发现。 与其他指标确认: 尽管启明星模式本身可以提供有价值的见解,但考虑使用其他技术指标或图表模式来确认信号,以提高准确
FREE

The Pivot Point indicator automatically calculates and displays the pivot point line and support and resistance levels. Pivot can be calculated according to the Classic, Floor, Fibonacci, Woodie, Camarilla or DeMark formula. It is also possible to select the period for calculating the indicator. A trader can choose from daily, weekly, monthly, or user-defined periods.
Types of pivots Classic Floor Fibonacci Woodie Camarilla DeMark
Main features The indicator shows the current and histor
FREE

Trend Filter Pro
Trend filter indicator.
Very good filter for your trading system, I recommend to use it together with - System Trend Pro and Professional Trade Arrow
The indicator no repaint!!!
Settings:
Change the Period parameter for better filtering ( default is 90)
Any questions? Need help?, I am always happy to help, write me in private messages or
In Telegram: https://t.me/Trader35_Admin
FREE

MCDX Pro is based on Buyer and Seller Volume analysis . Buyer also known as Banker is represented by GREEN BAR Seller also known as Retailer is represented by RED BAR The indicator is showing STACKED BAT representing BANKER (Green) and RETAILER (Red) activities Height of GREEN bar > 50% means Bull is in control while RED bar > 50% means Bear is in control. DARKER GREEN COLOR - STRONG BANKER - Active Buying Activity LIGHTER GREEN COLOR - STRONG Down - Weak Buying (Pullbac

This indicator tool provides mini charts, with adjustable symbol/tf that can be dragged into place. Lightweight operation with multiple mini charts are supported.
Chart features: adjustable symbol and tf draggable multiple mini charts color styling and font sizing, foreground/background colors candle coloring candle styles; candles, bars, line, high-low channel
zoom in/out
FREE

Having to check constantly if your RSI has reached a specific level can be tedious and draining at times, especially if you have to monitor different asset classes at a time. The Alert RSI indicator will assist in this task, ensuring that you get the most with little effort. When the RSI values get to a specified level, the alerts will go off, on the chart, on the MT4 phone app or via email (You can receive text messages to your phone if you activate texts on your Gmail account). The indicator d
FREE

Heiken Ashi Button Heiken-Ashi , often spelled Heikin-Ashi, is a Japanese word that means "Average Bar." The Heiken-Ashi approach can be used in conjunction with candlestick charts to spot market trends and forecast future prices. It's useful for making candlestick charts easier to read and analysing patterns. Traders can use Heiken-Ashi charts to determine when to stay in trades while the trend continues and close trades when the trend reverses. The majority of earnings are made when markets a
FREE

This indicator presents an alternative approach to identify Market Structure. The logic used is derived from learning material created by DaveTeaches (on X)
When quantifying Market Structure, it is common to use fractal highs and lows to identify "significant" swing pivots. When price closes through these pivots, we may identify a Market Structure Shift (MSS) for reversals or a Break of Structure (BOS) for continuations. The main difference with this "protected" logic is in how we determine

枢轴水平是每个市场都认可的完善的技术水平。 该指标将在图表上为任何符号绘制当前的季度、月度、周度、日度和四小时支点。您还可以显示每个时期的支撑和阻力水平,并选择从水平 1 到 4 显示哪个水平。 从以下选项中选择枢轴类型: 标准 卡马里拉 丹麦 伍迪 斐波那契数列 请注意,根据原始规格,DeMark 枢轴具有单一的支撑位和阻力位。 如果线已被价格触及,指标墙会改变绘制线的方式。这可能非常有帮助,一旦触及,支撑线或阻力线的强度就会大大降低。 您可以选择显示每个时间段的预测枢轴水平。这将使用与正常枢轴相同的计算,但将适用于当前不完整的时间范围。因此,最好在那个时期结束时使用它,此时价格已经涵盖了其范围的大部分。
设置
所有设置的详细信息都在单独的博客文章中,可在此处获取: https://www.mql5.com/en/blogs/post/746511
这是一个高度可配置的指标,因此您可以按照自己的喜好让它工作。

速度阻力线是确定趋势和阻力线的有力工具。 该指标使用图表极值和特殊的数学公式构建线条。 该指标可用于确定趋势方向和枢轴点。
<---------------------------->
指标参数:
"Depth of search" -搜索图表极值的深度(以条形为单位) "Back step of search" -极值之间的最小距离(以条为单位) "Deviation of price" -同一类型极端之间的允许价格差异 "Line color" -带有相应索引的线条颜色 "Line style" -带有相应索引的线条样式 "Line width" -具有相应索引的线宽 <---------------------------->
你可以在"艾德森*古尔德的稀有作品集"一书中找到更多信息,也可以在私人信息中与我联系。
<---------------------------->
提前感谢所有有兴趣的人,祝你好运征服市场!
FREE

This is a powerful system for binary options and intraday trading. The indicator neither repaints, nor changes its readings. Binary Reverse is designed to determine the points where the price reverses. The indicator fixes both reversals and roll-backs considerably expanding your analytical capabilities. It not only clearly shows correction and reversal points, but also tracks the overall trend dynamics.
Trading recommendations Coincidence of two signals (arrow and cross) is a strong entry sign

The Multi-Timeframe High Low Points (MTF High Low Points) indicator is a powerful tool for traders using MetaTrader 4 (MT4) to analyze price movements across different timeframes. This versatile indicator helps traders identify significant support and resistance levels by displaying the highest and lowest price points within a specified number of bars on multiple timeframes simultaneously. Key Features: Multi-Timeframe Analysis: MTF High Low Points allows traders to monitor high and low price le
FREE
Macd 2 线指标与交易箭头。
包括:
MACD信号和MACD线 2 颜色直方图 0级 可能的贸易箭头 如何阅读 :
交叉发生后,指标会给您一个箭头,并且快线位于零线上方或下方! 使用适当的风险管理,不要根据高波动性新闻进行交易!
查看其他产品: https://www.mql5.com/en/users/gabedk/seller Macd 2 xiàn zhǐbiāo yú jiāoyì jiàntóu.
Bāokuò:
MACD xìnhào hé MACD xiàn 2 yánsè zhífāng tú 0 jí kěnéng de màoyì jiàntóu rúhé yuèdú:
Jiāochā fāshēng hòu, zhǐbiāo huì gěi nín yīgè jiàntóu, bìngqiě kuài xiàn wèiyú líng xiàn shàngfāng huò xiàfāng! Shǐyòng shìdàng de fēngxiǎn guǎnlǐ, bùyào gēnjù gāo bōdòng xìng xīnwén j
FREE

该指标显示最合适的进入和退出点。它还显示所有信号的统计数据,以便更好地分析交易。
在这个指标的帮助下,你将能够更好地了解市场。
一旦趋势的力量开始减弱(这将显示在面板上),趋势线将引向水平位置 - 这是退出交易的信号。或者你可以在达到平均/中值利润水平时退出。
该指标是我自2010年以来的交易经验的结晶。 MT5的指标版本
特点 这个指标不会重新绘制。印在历史图表上的东西也将被实时打印出来。 它可以用于交易任何资产:加密货币、股票、金属、指数、商品和货币。 在所有的时间框架上都可以工作。 进入的信号出现在新蜡烛的开端。 退出交易的信号是暂定的,因为通常你可以用更大的利润关闭交易。 在左上方有一个详细的交易统计面板,它可以被最小化。 在M1到W1的时间框架上,一次显示趋势的方向和它的力量。 有一个轻量级的代码,所以它不需要加载,也不会降低终端的速度。 使用一个特殊的公式计算移动平均线,它决定了趋势的方向。 为了不错过交易的信号,你可以在警报窗口和推送中收到通知。 适用于所有级别的用户,从初学者到专家。 统计小组 取自信号历史的天数。 提供统计的信号总数。 盈利和亏损信号

If you like this project, leave a 5 star review. Often times we are using brokers that are outside of the GMT-0 timezone, this
not only complicates things, but, it can make seeing when a trading session starts
a bit more difficult than it should. This indicator allows you to set a timezone offset it will draw a vertical line for the: Day. Week. Month. Quarter. year.
FREE

Sometimes a trader needs to know when a candle will close and a new one appears to make the right decisions, this indicator calculates and displays the remaining of current candle time . It is simple to use, just drag it on the chart. Please use and express your opinion, expressing your opinions will promote the products. To see other free products, please visit my page.
FREE
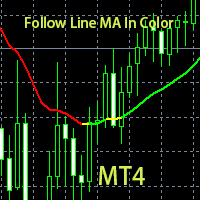
这是基于颜色识别的自定义指标。 当颜色为绿色时做多单。 当颜色为红色时做空单。 当颜色为黄色时表示行情即将反转,最好平仓或空仓。
这是本人经过长时间跟随手工做单,准确率较高,然后编写出来根据线颜色很好标识下单方向的指标,无时间,货币对限制。 当前指标最好在15分钟,30分钟,1小时,4小时上工作,效果较好。 当前指标不建议用在1分钟或5分钟或1day以上时间周期,虽然然指标是无限制的,但是效果不太好。 本指标工作平台最好选择点差比较小的交易商。 由于外汇交易是24小时运行,手工下单的话容易受到个人时间和情绪的影响,如果时间不够多的话,建议选择我基于当前指标编写的另外一个EA来交易。 基于本指标编写的EA:https://www.mql5.com/zh/market/product/37082 本指标编写的EA实盘详情:https://www.mql5.com/zh/signals/557404
FREE

Currency Strength Meter is the easiest way to identify strong and weak currencies. This indicator shows the relative strength of 8 major currencies + Gold: AUD, CAD, CHF, EUR, GBP, JPY, NZD, USD, XAU. Gold symbol can be changed to other symbols like XAG, XAU etc.
By default the strength value is normalised to the range from 0 to 100 for RSI algorithm: The value above 60 means strong currency; The value below 40 means weak currency;
This indicator needs the data of all 28 major currency pair

本产品接收指标/信号工具的信息,在满足特定条件时显示箭头或通知。
例如,当MA25和MA50交叉、SAR反转、MACD改变正负值或收盘价穿过布林线时,都会显示箭头和通知。
具体配置请参考示例设置图。
详细手册和配置文件:
https://www.mql5.com/en/blogs/post/755082
免费版本也可供下载。
箭头可以以多种配置显示,组合方式无限,任您想象。
如果您在设置与信号工具和指标的链接时遇到困难,请联系我们寻求帮助。
我们还可以向您的智能手机、电子邮件、Slack、Line、Discord等推送通知,最多添加8个参数,或根据您的要求单独链接到指标。您可以将其用作信号工具的补充或事件的通知功能。 https://www.mql5.com/zh/users/mt4kabukimono
FREE

ReviewCandleChart is a unique product that can verify past price fluctuations using candlestick charts. This indicator accurately reproduces market price fluctuations in the past and can make trading decisions (entries, profits, loss cut) many times so that you can learn the trading faster. ReviewCandleCahrt is the best indicator to improve trading skills. ReviewCandleCahrt caters to both beginners and advanced traders. Advantages of the indicator This Indicator for verifying price fluctuation u

High and Low Levels EMA Технический индикатор в помощь трейдеру. Однажды пришла идея при изучении индикатора Moving A verage ( MA ).
Так как мувинги эти сглаженное, среднее значения цены за выбранный период, то как и у обычной цены и у мувинга
должны быть «хаи и лои».
Данный индикатор, показывает уровни High и Low . Динамических уровней поддержки и сопротивления.
О понятии High и Low .
Хай — от английского high — обозначает наиболее высокую цену («рынок на хаях » — капитализ
FREE

QuantumAlert Stoch Navigator is a free indicator available for MT4/MT5 platforms, its work is to provide "alerts" when the market is inside "overbought and oversold" regions in the form of "buy or sell" signals. This indicator comes with many customization options mentioned in the parameter section below, user can customise these parameters as needful. Join our MQL5 group , where we share important news and updates. You are also welcome to join our private channel as well, contact me for the p
FREE
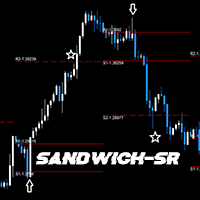
GENERAL DESCRIPTION
Simple SR Projection based on selected instrument's historical data. Best used in conjunction with current market sentiment, and fundamental analysis. Currently limited to selected pairs due to of historical data to project accurate levels.
Generally, for support and resistance, 2 levels are drawn, respectively. The inner levels (R1,S1) project the highs and lows during the opening stages of selected time frame. The outer levels, represent the targets to reach during the c
FREE

Based on famous and useful indicator - Super Trend, we add some features to make this Indicator much easier to use and powerful. Ease to identify the trend of any chart. Suitable for both Scalping & Swing Better to use in the trending market be careful in sideway market, it might provide some fake signals Setting: ATR Multiplier ATR Period ATR Max Bars (Max 10.000) Show UP/DOWN node Nodes size Show Pull-back signals Pull-back filter ratio Period of MA1 Mode of MA1 Period of MA2 Mode of MA2 A
FREE

引入 Awesome Oscillator Alert ,这是一个强大的技术指标,可为交易者提供有关市场动态和交易机会的宝贵见解。凭借其全面的功能和用户友好的界面,该指标是希望在市场上获得优势的交易者的必备工具。
Awesome Oscillator Alert 的突出特点之一是它与所有货币对和时间框架的兼容性。无论您是交易主要货币对还是外来货币,该指标都可以无缝集成到您的交易策略中。此外,用户友好的界面允许轻松自定义参数,确保您可以定制指标以满足您的个人交易偏好。
实时警报是成功交易的一个重要方面,而 Awesome Oscillator Alert 可以精确地提供它们。您将通过弹出窗口、声音和移动警报接收即时通知,让您随时了解重要的进入和退出信号。这种实时反馈使您能够及时做出交易决策并利用市场机会。
该指标提供两种可靠的交易策略:飞碟策略和零线交叉策略。飞碟策略识别直方图列中的模式,根据特定条件提供清晰的买入和卖出信号。另一方面,零线交叉策略着重于震荡指标与零线之间的相互作用,指导交易者何时进场或出场。
借助 Awesome Oscillator Ale

EZ Risk Reward Ratio is a simple to use MT4 indicator that allows the user to automatically change the Risk Reward Ratio of an open trade simply by dragging the Take Profit or Stop Loss lines to desired positions on any chart. Risk to reward ratio is displayed in whichever corner you choose and can be changed by dragging TP and SL lines.
First, place the EZ Risk Reward Ratio indicator on the MT4 chart. Second, open a trade on the MT4 chart. EZ Risk Reward Ratio works on any currency pair and
FREE

Please check the " What's new " tab regularly for a complete and up-to-date list of all improvements + parameters. FREE indicator for my trading utility Take a Break . This indicator allows you to manage multiple other EAs with just one Take a Break EA instance. Simply specify the corresponding Chart Group in the indicator(s) and Take a Break EA settings and you are good to go.
Setup example (Indicator + EA)
You want Take a Break to manage 3 other EAs: EA1 on EURUSD, EA2 on EURGBP, EA3 on G
FREE

Limited time offer! For the launch of NextBot , which has been working on a real account for about a year doubling the initial capital, the price of this indicator will drop to FREE ! Introducing a pragmatic and innovative tool for MetaTrader 4 (MT4) traders: the Linear Regression Next channel indicator, enhanced with the determination coefficient R 2 . This indicator serves as a foundational tool for traders seeking to understand market trends through the lens of statistical analysis, spe
FREE

用於確定平面和趨勢的指標。 如果價格低於兩條直方圖和兩條線(紅色和藍色)中的任何一條,則這是一個賣出區域。 購買此版本的指標時,一個真實賬戶和一個模擬賬戶的 MT4 版本 - 作為禮物(收到,給我寫私信)! 如果價格高於兩條直方圖和兩條線(紅色和藍色)中的任何一條,則這是一個買入區域。 MT4 版本: https://www.mql5.com/en/market/product/3793
如果價格在兩條線之間或在任何直方圖的區域內,那麼市場就沒有明確的趨勢。簡單地說,市場是平的。
指標的工作在屏幕截圖中更清楚地顯示。 該指標可用作獨立的交易系統。該指標可用於獲取領先數據或確定當前趨勢的方向。對於任何級別的交易者來說,這都是一個很好的工具!

Metatrader 4 的 R Inside Bar 指标提供了基于内部条形图的简单易用的价格突破水平。
它适用于纯价格行为,不会重新绘制任何内容,并以实际内柱上方和下方的 2 条彩色水平线的形式在主 MT4 图表窗口中弹出。
绿色水平线作为阻力,红线作为支撑。
多空交易理念 如果烛台收于绿色内柱线上方且整体趋势向上,则打开买单。 如果烛台收于红色内柱线下方且整体趋势向下,则打开卖单。 R Inside Bar 指标同样适用于所有货币对(主要货币对、次要货币对和外来货币对),如果使用得当,它会显示出可喜的结果。
提示
随意使用您自己喜欢的交易入场、止损和获利方法与 R Inside Bar 指标进行交易。
与往常一样,根据整体趋势进行交易,并首先在模拟账户上进行练习,直到您完全理解该指标。
请注意,即使是最好的交易指标也无法在长期内产生 100% 的胜率。
规格和输入 交易平台:Metatrader 4 (MT4)
货币对:适用于任何货币对
时间范围:适用于(1-M、5-M、15-M、30-M、1-H) 交易风格:适用于剥头皮交易、日内交易和
FREE

R Chimp Scalper 是外汇剥头皮交易者和日内交易者的绝佳交易工具。
该剥头皮指标的信号非常清晰易读。
它在单独的交易窗口中在零水平上方和下方绘制绿色和红色条: 绿色条在零水平上方对齐,表明看涨的黄牛趋势。 红色条在零下方对齐,表明看跌的黄牛趋势。 指标读数高于零水平表明头皮趋势看涨,交易者期望买入该货币对。
低于零水平的指标读数表明看跌头皮趋势,交易者预计会卖出该货币对。
最佳实践 将此剥头皮振荡器与趋势跟踪指标一起使用,并在主要趋势的方向上进行交易。
基本交易信号 R Chimp Scalper 指标信号很容易解释,看起来像这样:
买入信号:当指标向上穿过零水平(绿柱交易)时,开启剥头皮买入交易。
卖出信号:当指标再次从上方穿过零水平时(红色柱形交易),开启卖出头皮交易。
交易退出:使用您自己的交易退出方法。
特征 货币对:任何
平台:MetaTrader 4
类型:图表形态指标
自定义选项:变量(DM 重量、DI 重量、DX 重量、外部重量)、颜色、宽度和样式。
时限:1分钟、5分钟、15分钟
类型:振荡器
FREE

Th indicator is a technical analysis tool that helps identify significant changes in price trends and filter out minor price fluctuations. It is used to highlight price swings and provide a clearer picture of market movements. The Pivots are found by checking if a certain candle is the highest/lowest in a given number of candles that come before and after it. This indicator has only one input, its period. The Higher the period, the more strict the indicator is about what constitutes a Pivot. Th
FREE
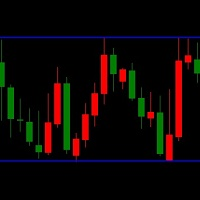
LT Triple Support Resistance Screen Method is a kind of levels indicator that consist of three SR lines. It is built by MQL4 programming language and can be used to MT4 platform. A free version indicator to determine the support and resistance levels easily This indicator works based on the screen method to calculate the most appropriate value for each buffer. A complex algorithm based on long research is applied to this free custom indicator. But this indicator has limited features and simpler
FREE

Donchian channels are a tool in technical analysis used to determine the relative volatility of a market and the potential for price breakouts.
Can help identify potential breakouts and reversals in price, which are the moments when traders are called on to make strategic decisions. These strategies can help you capitalize on price trends while having pre-defined entry and exit points to secure gains or limit losses. Using the Donchian channel can thus be part of a disciplined approach to manag
FREE

BeST_ Classic Pivot Points is an MT4 Indicator that is based on the widely known and definitely classic Pivot Point of a market prices activity. A pivot point is calculated as an average of significant prices (high,low,close) from the performance of a market in the prior trading period. If the market in the following period trades above the pivot point it is usually evaluated as a bullish sentiment, whereas trading below the pivot point is seen as bearish. A pivot point and the associated suppo
FREE

Pivot levels is indicator showing 7 pivot levels. It is adjusted for major use, including: all standard time frames
choice of periods to show three popular calculation formulas (typical, median, weighted) 9 level Camarilla pivot
pivot day shift choice of properties for lines and labels choice of showing alerts when crossing pivot lines Parameters: ----------Main parameters----------- Timeframe - time frame for pivot levels
Number of periods to show - displays pivot levels for number of period
FREE

该指标仅使用价格行为分析和donchian渠道以锯齿形检测价格反转。它是专门为短期交易而设计的,根本不需要重新粉刷或补漆。对于精明的交易者来说,这是一个绝佳的工具,旨在增加他们的运作时间。 [ 安装指南 | 更新指南 | 故障排除 | 常见问题 | 所有产品 ]
极易交易 它在每个时间段都提供价值 实施自我分析统计
它实现了电子邮件/声音/视觉警报 基于可变长度的突破和拥挤区域,该指标仅使用价格行为来选择交易并对市场快速做出反应。 显示过去信号的潜在利润 该指标分析其自身的质量和性能 突围的损失突出显示并解决 该指标是不可重涂和不可重涂的 该指标将帮助盘中交易者不要错过单个价格反转。但是,并非所有价格反转都是一样的,也不是具有相同的可行质量。决定要突破哪些突破而忽略哪些取决于交易者的良好判断。
如何解释统计数据 该指标研究其自身信号的质量,并在图表上绘制相关信息。将分析每笔交易,并在图表的左上角显示总体历史结果,这使您可以针对任何给定的工具和时间范围自行优化指标参数。每个乐器和时间表都有其自己的最佳设置,您可以自己找到它们。 最大优惠交易:对于任何给定的交易,MFE都是

经过7年的时间,我决定免费发布我自己的一些指标和EA。
如果您觉得它们有用,请 给予5星评价支持!您的反馈将持续带来更多免费工具! 也可以在这里查看我的其他免费工具和我的实时信号 这里
_________________________________ 吞没模式检测器 - 简化的交易指标 发现吞没模式检测器,这是一个在MQL4中创建的直接工具,用于识别外汇市场中的吞没模式。这个指标旨在通过突出潜在的市场进入或退出点,使您的交易策略更加有效。 主要特点: 吞没模式检测 : 快速识别看涨和看跌的吞没模式,以信号交易机会。 高级通知 : 检测到吞没形态时发送通知和警报 易于使用 ️: 无缝集成到您的Metatrader 4平台,适合任何经验水平的交易者。 如何使用: 设置 ️: 将吞没模式检测器添加到您的Metatrader 4。根据需要自定义其设置。 模式识别 : 监控指标以识别吞没模式,作为交易进入或退出的潜在信号。 自信交易 : 使用吞没模式检测器来增强您的交易决策,与您现有的策略一起使用。 吞没模式检测器是简化交易、快速
FREE
Pipfinite creates unique, high quality and affordable trading tools. Our tools may or may not work for you, so we strongly suggest to try the Demo Version for MT4 first. Please test the indicator prior to purchasing to determine if it works for you. We want your good reviews, so hurry up and test it for free...we hope you will find it useful.
Attention This trading tool is specifically designed to help grid, martingale, averaging, recovery and hedging strategies. If you are not familiar with t
Tipu Parabolic SAR Panel is the modified version of the original Parabolic SAR indicator published by MetaQuotes here . Dashboard Panel (multi symbol) version for this indicator is available here .
Features An easy to use Panel that shows the Parabolic SAR trend and signals of selected timeframe. Customizable Buy/Sell alerts, push alerts, email alerts, or visual on-screen alerts. Customizable Panel. The panel can be moved to any place on the chart or minimized to allow more space. To enable th
FREE

HEDGING MASTER line indicator It compares the power/strength lines of two user input symbols and create a SMOOTHED line that indicates the degree of deviation of the 2 symbols Strategy#1- FOLLOW THE INDICATOR THICK LINE when CROSSING O LEVEL DOWN --- TRADE ON INDICATOR THICK LINE (TREND FRIENDLY) !! Strategy#2- TRADE INDICATOR PEAKS (Follow indicator Reversal PEAKS Levels)!! you input - the index of calculation ( 10/20/30....) - the indicator Drawing start point (indicator hi

或 DBD%。该指标由彩色带组成,根据两个 Bermaui Deviation Oscillator (BD%) 和两个移动平均线显示交易信号。 Bermaui Deviation Percent 是一种波动率指数,以百分比而非点数来衡量波动率。 BD% 的想法是根据在 0% 和 100% 之间移动的经典标准偏差 (CSD) 创建一个索引。 重要信息
DBD% 专家顾问示例: https://www.mql5.com/en/blogs/post/731145
如果您想了解更多关于 BD% 的信息, 请阅读下一篇博文: https://www.mql5.com/en/blogs/post/718182 DBD% 由两个信号带组成,一个是快的,另一个是慢的。当快速和慢速看涨时,就会出现买入信号。当快速和慢速都看跌时,就会出现卖出信号。 DBD% 特点
两个不同时期的两个 BD% 的组合有助于捕捉不同的市场周期。
使用 BD% 作为趋势过滤器是一个很大的优势,因为 BD% 可以作为市场低波动性运动的过滤器。
在满足买入/卖出条件后的第一次开盘时出现信号。
精心设计的参数

This indicator is not only for trading but also for learning, thanks to it, you can learn to identify trend, support and resistance.
You've probably heard about the Dow trend theory, where higher highs and higher lows indicate an uptrend, and lower highs and lower lows indicate a downtrend. This indicator determines this trend based on the Dow Theory. You just need to enter a number representing the number of candles between extremes. The optimal solution is the number 3 (H1 TF), unless you
FREE

Lisek Stochastic oscillator indicator with Alarm, Push Notifications and e-mail Notifications. The Stochastic indicator is a momentum indicator that shows you how strong or weak the current trend is. It helps you identify overbought and oversold market conditions within a trend. The Stochastic indicator is lagging indicator, which means it don't predict where price is going, it is only providing data on where price has been !!!
How to trade with Stochastic indicator: Trend following: As lon
FREE

GTAS S-Trend is a momentum indicator that helps to determine trends using combination of MACD, RSI and moving averages. This indicator was created by Bernard Prats Desclaux, proprietary trader and ex-hedge fund manager, founder of E-Winvest.
Description The indicator oscillates between -65 and +65 with a neutral zone between -25 and +25 around a 0 equilibrium line. S-Trend between -25 and +25 indicates congestion zones with a bullish bias between 0 and +25, and a bearish bias between 0 and -25
FREE
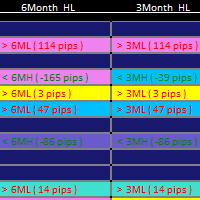
1. Updated usage instructions in blog below: Smart Market Structure Trading System and Automatic Scanner - Trading Systems - 13 October 2023 - Traders' Blogs (mql5.com) https://www.mql5.com/en/blogs/post/754495 2. The Smart Market Structure Opportunity Scanner is a great tool to find trading entries and exits based on Smart Money Concepts. It has a build-in custom choice of Forex pair lists to choose from for the scan, and it also has a user-defined entry choice to put down your own list of Fo
FREE

Bollinger Bands Breakout Alert is a simple indicator that can notify you when the price breaks out of the Bollinger Bands. You just need to set the parameters of the Bollinger Bands and how you want to be notified.
Parameters: Indicator Name - is used for reference to know where the notifications are from Bands Period - is the period to use to calculate the Bollinger Bands Bands Shift - is the shift to use to calculate the Bollinger Bands Bands Deviation - is the deviation to use to calculate
FREE

The MACD 2 Line Indicator is a powerful, upgraded version of the classic Moving Average Convergence Divergence (MACD) indicator.
This tool is the embodiment of versatility and functionality, capable of delivering comprehensive market insights to both beginner and advanced traders. The MACD 2 Line Indicator for MQL4 offers a dynamic perspective of market momentum and direction, through clear, visually compelling charts and real-time analysis. Metatrader5 Version | How-to Install Product | How-t
FREE

Pipfinite creates unique, high quality and affordable trading tools. Our tools may or may not work for you, so we strongly suggest to try the Demo Version for MT4 first. Please test the indicator prior to purchasing to determine if it works for you. We want your good reviews, so hurry up and test it for free...we hope you will find it useful.
Combo Energy Beam with Swing Control Strategy: Confirm swing pullback signals Watch Video: (Click Here) Energy Beam with Trend Laser Strategy: Confirm Tr

趨勢指標 用於確定每個時間範圍趨勢的獨特系統,
讓您能夠真實了解任何貨幣對在所有標準時間範圍內的趨勢! 綠色方塊是買入趨勢,紅色方塊是賣出趨勢。
交易技巧:如果小時間框架與較舊時間框架的趨勢相反,則由於市場運動的慣性,請按照螢幕截圖所示在較舊時間框架內入場。
此指標使用修改後的燭台公式來創建更平滑的價格走勢表示。 它平均當前和前期的開盤價、收盤價、最高價和最低價。 這種轉換可以減少噪音並提供更清晰的趨勢視圖。
它是一個強大的指標,結合了求和指數廣度分析、清晰的可視化以及基於 MACD 計算和直方圖的附加趨勢資訊。 客製化功能使其能夠適應不同的指數和市場條件,為交易者提供分析趨勢和動量的綜合工具。 要確認買入和賣出訊號,您可以尋找支撐位和阻力位,如下圖所示。 如果買進訊號出現在支撐位,則該訊號比出現在隨機價格水準的訊號更強。 同樣,如果賣出訊號出現在阻力位,則該訊號比出現在隨機價格位的訊號更強。
FREE
MetaTrader市场是您可以下载免费模拟自动交易,用历史数据进行测试和优化的唯一商店。
阅读应用程序的概述和其他客户的评论,直接下载程序到您的程序端并且在购买之前测试一个自动交易。只有在MetaTrader市场可以完全免费测试应用程序。
您错过了交易机会:
- 免费交易应用程序
- 8,000+信号可供复制
- 探索金融市场的经济新闻
注册
登录