Regardez les tutoriels vidéo de Market sur YouTube
Comment acheter un robot de trading ou un indicateur
Exécutez votre EA sur
hébergement virtuel
hébergement virtuel
Test un indicateur/robot de trading avant d'acheter
Vous voulez gagner de l'argent sur Market ?
Comment présenter un produit pour qu'il se vende bien
Indicateurs techniques pour MetaTrader 4 - 19

Contact me after payment to send you the User-Manual PDF File. Divergence detection indicator with a special algorithm. Using divergences is very common in trading strategies. But finding opportunities for trading with the eyes is very difficult and sometimes we lose those opportunities. The indicator finds all the regular and hidden divergences. (RD & HD) It uses an advanced method to specify divergence. This indicator is very functional and can greatly improve the outcome of your trading. Thi

Modified oscillator MACD. A classic indicator that combines a trend indicator with an oscillator to detect entry points. Has a multi-timeframe panel and 3 types of notifications
Benefits:
Works on all instruments and timeseries Trend indicator with oscillator for inputs Multi-period panel on all timeframes Pluggable arrows when signals appear Three types of notifications: push, email, alert
MT5 version -> HERE / Our news -> HERE
How the indicator works:
AW Classic MACD - Indicato
FREE
Download the free version here.
A Full Concept of BUY/SELL Scalping Strategy Trend detection is one of the basic challenges of every trader. Finding a way to tell when to enter a trade is very important, timing is a game changer, not too early and not too late. Sometimes, due to not knowing the market conditions, the trader closes his positions with a small profit or allows the losses to grow, these are the mistakes that novice traders make. Indicator Trend Whipper is a complete trading st
FREE

A supply and demand indicator designed with a minimalist trading strategy based on the nature of the market. The Bull zone is a strong support area, and the Bear zone is a strong resistance area. When a Bull zone was breakout, it becomes the "base" of the Bears and vice versa. When the price meets these areas, there is a high probability that the price will turn around, so we call them Obstacles. It is a suitable indicator for traders interested in manual price action and algorithmic trading up
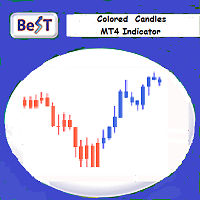
BeST_Colored Candles is an MT4 FREE indicator that can change the color of the Candlesticks based on the MACD, SAR or RSI values and levels. It is a Composite indicator that by selection uses the values each one of these 3 indicators and their critical levels in order to create numerical relationships that when satisfied cause their corresponding candlesticks coloration.
Input parameters
== Basic Settings
-- Please Select Indicator - for selecting which one of the above 3 indicator
FREE
Highly configurable Moving average indicator.
Features: Highly customizable alert functions (at levels, crosses, direction changes via email, push, sound, popup) Multi timeframe ability Color customization (at levels, crosses, direction changes) Linear interpolation option Works on strategy tester in multi timeframe mode (at weekend without ticks also) Parameters:
MA Timeframe: You can set the lower/higher timeframes for Ma. MA Bar Shift: Y ou can set the offset of the line drawing. MA Perio
FREE
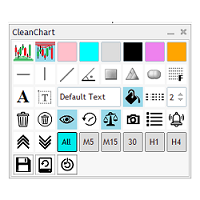
Êtes-vous fatigué d'avoir un graphique en désordre avec des objets graphiques de différentes paires apparaissant sur votre graphique actuel ?
Trouvez-vous ennuyeux de devoir cliquer plusieurs fois pour mettre à jour les couleurs et les styles des objets ?
Voulez-vous pouvoir charger un ensemble spécifique de configurations pour vos objets graphiques les plus utilisés ?
Ne cherchez pas plus loin, CleanChart a tout pour plaire.
6 couleurs personnalisables Couleurs de support et de résista
FREE

L'indicateur analyse le nombre de bougies spécifié et construit des niveaux de Fibonacci basés sur le maximum-minimum. Comme les niveaux sont reconstruits, nous sommes intéressés par la partie droite de la fourchette. Le prix est magnétique par rapport aux niveaux et réagit à un contact. Utilisez cet outil pour trouver un point d'entrée dans la tendance après une correction. Si, à gauche, nous constatons que les niveaux sont parfaitement relevés, nous pouvons supposer que nous avons trouvé la f
FREE

Indicator measures strength of each currency in your list.
Main idea: It simply iterates through all combinations of pairs and adds difference between open and close in percent. Parameters: List of currencies - what currencies will be calculated (maximum is 8) Calculation type - from which data will be strength calculated Calculation data input - used as input related to calculation type Symbol suffix - used in case of suffix on symbols, e.g: when your symbols look like EURUSDm, EURUSDmicro et
FREE

The "Dagangduit Spread Indicator" is a versatile tool designed to provide traders with essential information about the current spread in the chart window. This indicator offers customizable features, including font parameters, display location on the chart, spread normalization, and alerts to enhance your trading experience. Key Features: Real-time Spread Display : The indicator displays the current spread in real-time on your trading chart, allowing you to stay informed about the cost of execut
FREE
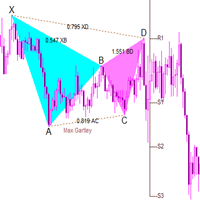
The full purchase discount is currently in progress! The best partner for any trader! This indicator is a classic butterfly indicator (harmonic trading). By default, it can identify 20 patterns and give prompts. You can also add custom shape parameters for custom prompts , prompting appropriate stop loss and profit levels. The built-in algorithm of this indicator is unique and is a unique band algorithm. Index characteristics Gartley pattern, also known as Gartley "222", was

This is Free product you are welcome to use for your needs! Also I very appreciate your positive feedbacks! Thanks a lot! // More great Expert Advisors and Indicators are available here: https://www.mql5.com/en/users/def1380/seller // Also you are welcome to join to profitable , stable and reliable signal https://www.mql5.com/en/signals/1887493 Forex Indicator Spread Display for MT4 , Trading Support . Spread Display indicator shows current spread of forex pair where it is attached. I
FREE
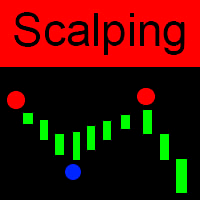
Globex 360 Scalping is a unique scalping indicator that shows price reversal points. With the help of this indicator, you will see on the chart when the price is reversing, and at this moment you can open deals in the direction of the signal. This is an indispensable assistant for both novice traders and professionals. This indicator shows the trader important and valuable information for effective trading. Globex 360 Scalping - Applies smooth scanning technology for market analysis. The indica

What is the Volume Weighted Average Price (VWAP)? The volume weighted average price (VWAP) is a trading benchmark used by traders that gives the average price an instrument has traded at throughout the day, based on both volume and price. It is important because it provides traders with insight into both the trend and value of the instrument.
What is the Difference between VWAP and AVWAP? While VWAP is having as starting point the beggining of the day,week,month etc. in the AVWAP you can pla

Make no mistake, this is not just another indicator; it's much more than that!
Welcome to a groundbreaking approach! Sunrise Divergence is not just another tool; it represents a deep understanding in how market dynamics are analyzed and traded. This indicator is crafted for traders who seek to navigate the markets with precision, leveraging the powerful concept of asset correlation, both positive and negative, to unveil trading opportunities that many overlook. In the markets, understanding t
Drawdown Alerts Free ! Meta Trader 4 Indicator. Please leave a review about this product to help other users benefit from it. This Drawdown Alerts indicator shows the drawdown percentage in real time and alerts you when the limit you specify is reached. Calculation of drawdown depends on the amount of the trade balance. You can customize Drawdown Alerts for Corner - Left , Right , Up , Down X Y Color Number of decimal digits Popup messages and sound - Turn on / off notifications Notification
FREE

This is a modified Fractals indicator. It works similar the original Bill Williams' indicator, and is additionally enhanced with the possibility to change the top radius, in contrast to the standard radius of 2 bar. Simply put, the indicator checks the top and if it is the minimum/maximum in this radius, such a top is marked by an arrow. Advantages Adjustable radius. Use for drawing support and resistance levels. Use for drawing trend channels. Use within the classical Bill Williams' strategy or
FREE

The Breakout Indicator That Has Been Proven & Tested! Breakout Analyzer uses an advanced algorithm based on high probability price patterns. Each trade is analyzed on the statistics panel to help you evaluate the best breakout setups.
Bonus Strategy 1
Breakout Analyzer with Volume Critical Watch Video: (Click Here)
Bonus Strategy 2
Breakout Analyzer with Strength Meter
Watch Video: (Click Here)
Features Universal compatibility to different trading systems Analyzes statistics of breako
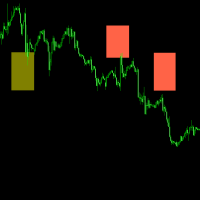
The indicator is very effective in currency exchange, for example EURUSD GBPUSD AUDUSD NZDUSD USDCHF USDCAD and it is very easy to identify the position of top and bottom. Suggest using it on the MT4 platform of SwissQuote Bank.
SwissQuote Link: https://trade.swissquote.ch/signup/public/form/full/fx/com/individual?lang=cn&partnerid=daf9af43-2f95-443e-86c5-89ce1ab2bd63#full/fx/com/individual/step1
Exness Link: https://one.exness.link/a/t2v0o2v0
With a little understanding of trading and the
FREE

Indicateur de Motif de Bougie Marubozu par ON Trade Le motif de bougie Marubozu est un motif de bougie puissant et direct qui peut fournir des informations précieuses sur le sentiment du marché et les éventuels renversements de tendance. Il se caractérise par une bougie avec une très petite ou inexistante ombre (mèche) à une extrémité et un long corps s'étendant dans la direction de la tendance dominante. Ce motif représente un déséquilibre fort entre les acheteurs et les vendeurs, suggérant que
FREE

The Pivot Point indicator automatically calculates and displays the pivot point line and support and resistance levels. Pivot can be calculated according to the Classic, Floor, Fibonacci, Woodie, Camarilla or DeMark formula. It is also possible to select the period for calculating the indicator. A trader can choose from daily, weekly, monthly, or user-defined periods.
Types of pivots Classic Floor Fibonacci Woodie Camarilla DeMark
Main features The indicator shows the current and histor
FREE

Trend Filter Pro
Trend filter indicator.
Very good filter for your trading system, I recommend to use it together with - System Trend Pro and Professional Trade Arrow
The indicator no repaint!!!
Settings:
Change the Period parameter for better filtering ( default is 90)
Any questions? Need help?, I am always happy to help, write me in private messages or
In Telegram: https://t.me/Trader35_Admin
FREE

MCDX Pro is based on Buyer and Seller Volume analysis . Buyer also known as Banker is represented by GREEN BAR Seller also known as Retailer is represented by RED BAR The indicator is showing STACKED BAT representing BANKER (Green) and RETAILER (Red) activities Height of GREEN bar > 50% means Bull is in control while RED bar > 50% means Bear is in control. DARKER GREEN COLOR - STRONG BANKER - Active Buying Activity LIGHTER GREEN COLOR - STRONG Down - Weak Buying (Pullbac

This indicator tool provides mini charts, with adjustable symbol/tf that can be dragged into place. Lightweight operation with multiple mini charts are supported.
Chart features: adjustable symbol and tf draggable multiple mini charts color styling and font sizing, foreground/background colors candle coloring candle styles; candles, bars, line, high-low channel
zoom in/out
FREE

Having to check constantly if your RSI has reached a specific level can be tedious and draining at times, especially if you have to monitor different asset classes at a time. The Alert RSI indicator will assist in this task, ensuring that you get the most with little effort. When the RSI values get to a specified level, the alerts will go off, on the chart, on the MT4 phone app or via email (You can receive text messages to your phone if you activate texts on your Gmail account). The indicator d
FREE

Heiken Ashi Button Heiken-Ashi , often spelled Heikin-Ashi, is a Japanese word that means "Average Bar." The Heiken-Ashi approach can be used in conjunction with candlestick charts to spot market trends and forecast future prices. It's useful for making candlestick charts easier to read and analysing patterns. Traders can use Heiken-Ashi charts to determine when to stay in trades while the trend continues and close trades when the trend reverses. The majority of earnings are made when markets a
FREE

This indicator presents an alternative approach to identify Market Structure. The logic used is derived from learning material created by DaveTeaches (on X)
When quantifying Market Structure, it is common to use fractal highs and lows to identify "significant" swing pivots. When price closes through these pivots, we may identify a Market Structure Shift (MSS) for reversals or a Break of Structure (BOS) for continuations. The main difference with this "protected" logic is in how we determine

Les niveaux pivots sont un niveau technique bien établi et reconnu sur tous les marchés. Cet indicateur dessinera les pivots trimestriels, mensuels, hebdomadaires, quotidiens et quadri-horaires actuels sur le graphique, pour n'importe quel symbole. Vous pouvez également afficher les niveaux de support et de résistance pour chaque période et choisir lequel afficher des niveaux 1 à 4. Choisissez le type de pivot parmi : Standard Camarilla DeMark boisé Fibonacci Veuillez noter que les pivots De

Les lignes de résistance de vitesse sont un outil puissant pour déterminer la tendance et les lignes de résistance. L'indicateur construit des lignes en utilisant des extrema graphiques et des formules Mathématiques spéciales. L'indicateur peut être utilisé pour déterminer la direction de la tendance et les points d'inversion.
<---------------------------->
Paramètres de l'indicateur:
"Depth of search" - profondeur (en barres) de la recherche extrema graphique "Back step of search" - dist
FREE

This is a powerful system for binary options and intraday trading. The indicator neither repaints, nor changes its readings. Binary Reverse is designed to determine the points where the price reverses. The indicator fixes both reversals and roll-backs considerably expanding your analytical capabilities. It not only clearly shows correction and reversal points, but also tracks the overall trend dynamics.
Trading recommendations Coincidence of two signals (arrow and cross) is a strong entry sign

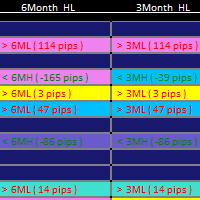
The Multi-Timeframe High Low Points (MTF High Low Points) indicator is a powerful tool for traders using MetaTrader 4 (MT4) to analyze price movements across different timeframes. This versatile indicator helps traders identify significant support and resistance levels by displaying the highest and lowest price points within a specified number of bars on multiple timeframes simultaneously. Key Features: Multi-Timeframe Analysis: MTF High Low Points allows traders to monitor high and low price le
FREE
Indicateur Macd 2 lignes avec flèches commerciales.
Comprend :
Signal MACD et ligne MACD Histogramme 2 couleurs 0 niveau flèches commerciales possibles Comment lire :
l'indicateur vous donnera une flèche après que le croisement se soit produit, et la ligne rapide passe au-dessus ou en dessous de la ligne zéro ! Utilisez une bonne gestion des risques et ne négociez pas sur des actualités à forte volatilité !
DÉCOUVREZ LES AUTRES PRODUITS : https://www.mql5.com/en/users/gabedk/seller
FREE

L'indicateur indique les points d'entrée et de sortie les plus appropriés. Il affiche également des données statistiques sur tous les signaux pour une meilleure analyse du trading.
Grâce à cet indicateur, vous pourrez mieux comprendre le marché.
Dès que la puissance de la tendance commence à s'affaiblir (ce qui sera indiqué sur le panneau), la ligne de tendance gravitera vers la position horizontale - c'est le signal pour sortir du trade. Vous pouvez également sortir lorsque le niveau de pro

If you like this project, leave a 5 star review. Often times we are using brokers that are outside of the GMT-0 timezone, this
not only complicates things, but, it can make seeing when a trading session starts
a bit more difficult than it should. This indicator allows you to set a timezone offset it will draw a vertical line for the: Day. Week. Month. Quarter. year.
FREE

Sometimes a trader needs to know when a candle will close and a new one appears to make the right decisions, this indicator calculates and displays the remaining of current candle time . It is simple to use, just drag it on the chart. Please use and express your opinion, expressing your opinions will promote the products. To see other free products, please visit my page.
FREE
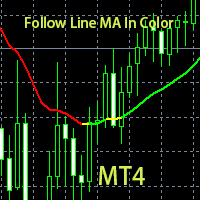
· This indicator generates trading signals based on the color of the line. · When the line shows green color, executes only long orders based on your own trading strategy · When the line shows red color, executes only short orders. · If the line turns yellow, it signifies a reversal is imminent. You can either close all your open positions and stay out; or alternatively you can devise a trading strategy to catch a reversal at its very early stage.
FREE

Currency Strength Meter is the easiest way to identify strong and weak currencies. This indicator shows the relative strength of 8 major currencies + Gold: AUD, CAD, CHF, EUR, GBP, JPY, NZD, USD, XAU. Gold symbol can be changed to other symbols like XAG, XAU etc.
By default the strength value is normalised to the range from 0 to 100 for RSI algorithm: The value above 60 means strong currency; The value below 40 means weak currency;
This indicator needs the data of all 28 major currency pairs

Ce produit reçoit des informations provenant d'outils d'indicateurs/signaux et affiche des flèches ou des notifications lorsque des conditions spécifiques sont remplies.
Par exemple, des flèches et des notifications s'affichent lorsque MA25 et MA50 se croisent, lorsque le SAR s'inverse, lorsque le MACD change son plus/moins ou lorsque le cours de clôture croise les bandes de Bollinger.
Veuillez vous référer à l'exemple d'image de paramètres pour des configurations spécifiques.
Pour le
FREE

ReviewCandleChart is a unique product that can verify past price fluctuations using candlestick charts. This indicator accurately reproduces market price fluctuations in the past and can make trading decisions (entries, profits, loss cut) many times so that you can learn the trading faster. ReviewCandleCahrt is the best indicator to improve trading skills. ReviewCandleCahrt caters to both beginners and advanced traders. Advantages of the indicator This Indicator for verifying price fluctuation u

High and Low Levels EMA Технический индикатор в помощь трейдеру. Однажды пришла идея при изучении индикатора Moving A verage ( MA ).
Так как мувинги эти сглаженное, среднее значения цены за выбранный период, то как и у обычной цены и у мувинга
должны быть «хаи и лои».
Данный индикатор, показывает уровни High и Low . Динамических уровней поддержки и сопротивления.
О понятии High и Low .
Хай — от английского high — обозначает наиболее высокую цену («рынок на хаях » — капитализ
FREE

QuantumAlert Stoch Navigator is a free indicator available for MT4/MT5 platforms, its work is to provide "alerts" when the market is inside "overbought and oversold" regions in the form of "buy or sell" signals. This indicator comes with many customization options mentioned in the parameter section below, user can customise these parameters as needful. Join our MQL5 group , where we share important news and updates. You are also welcome to join our private channel as well, contact me for the p
FREE
Cet indicateur fait défiler plusieurs graphiques simultanément lorsque vous faites défiler le graphique auquel l'indicateur est attaché. Il est utile pour tester des stratégies multi-périodes, des stratégies multi-paires, surveiller plusieurs graphiques à la fois et regarder en arrière pour voir comment plusieurs marchés se sont comportés historiquement en même temps. L'indicateur est léger et peut être utilisé pour déplacer jusqu'à 99 graphiques en même temps.
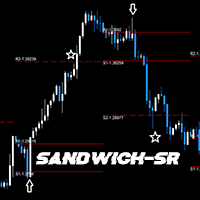
GENERAL DESCRIPTION
Simple SR Projection based on selected instrument's historical data. Best used in conjunction with current market sentiment, and fundamental analysis. Currently limited to selected pairs due to of historical data to project accurate levels.
Generally, for support and resistance, 2 levels are drawn, respectively. The inner levels (R1,S1) project the highs and lows during the opening stages of selected time frame. The outer levels, represent the targets to reach during the c
FREE

Based on famous and useful indicator - Super Trend, we add some features to make this Indicator much easier to use and powerful. Ease to identify the trend of any chart. Suitable for both Scalping & Swing Better to use in the trending market be careful in sideway market, it might provide some fake signals Setting: ATR Multiplier ATR Period ATR Max Bars (Max 10.000) Show UP/DOWN node Nodes size Show Pull-back signals Pull-back filter ratio Period of MA1 Mode of MA1 Period of MA2 Mode of MA2 A
FREE

Présentation de l' Awesome Oscillator Alert , un puissant indicateur technique qui fournit aux traders des informations précieuses sur la dynamique du marché et les opportunités de trading. Avec ses fonctionnalités complètes et son interface conviviale, cet indicateur est un outil essentiel pour les commerçants qui cherchent à gagner un avantage sur le marché.
L'une des caractéristiques les plus remarquables de l'Awesome Oscillator Alert est sa compatibilité avec toutes les paires de devi

EZ Risk Reward Ratio is a simple to use MT4 indicator that allows the user to automatically change the Risk Reward Ratio of an open trade simply by dragging the Take Profit or Stop Loss lines to desired positions on any chart. Risk to reward ratio is displayed in whichever corner you choose and can be changed by dragging TP and SL lines.
First, place the EZ Risk Reward Ratio indicator on the MT4 chart. Second, open a trade on the MT4 chart. EZ Risk Reward Ratio works on any currency pair and
FREE

Please check the " What's new " tab regularly for a complete and up-to-date list of all improvements + parameters. FREE indicator for my trading utility Take a Break . This indicator allows you to manage multiple other EAs with just one Take a Break EA instance. Simply specify the corresponding Chart Group in the indicator(s) and Take a Break EA settings and you are good to go.
Setup example (Indicator + EA)
You want Take a Break to manage 3 other EAs: EA1 on EURUSD, EA2 on EURGBP, EA3 on G
FREE

Limited time offer! For the launch of NextBot , which has been working on a real account for about a year doubling the initial capital, the price of this indicator will drop to FREE ! Introducing a pragmatic and innovative tool for MetaTrader 4 (MT4) traders: the Linear Regression Next channel indicator, enhanced with the determination coefficient R 2 . This indicator serves as a foundational tool for traders seeking to understand market trends through the lens of statistical analysis, spe
FREE

Indicator for determining flat and trend.
If the price is below any of the two histograms and two lines (red and blue), this is a sell zone.
When purchasing this version of the indicator, MT5 version for one real and one demo account - as a gift (to receive, write me a private message)!
If the price is above any of the two histograms and two lines (red and blue), this is a buy zone. MT5 version: https://www.mql5.com/en/market/product/70409 If the price is between two lines or in the zone

L'indicateur R Inside Bar pour Metatrader 4 fournit des niveaux de répartition des prix simples à utiliser basés sur les barres intérieures.
Il fonctionne sur l'action pure des prix et ne repeint rien, et apparaît dans la fenêtre principale du graphique MT4 sous la forme de 2 lignes horizontales colorées au-dessus et en dessous de la barre intérieure réelle.
La ligne horizontale verte agit comme résistance et la ligne rouge agit comme support.
Idée commerciale longue et courte Ouvrez un o
FREE

R Chimp Scalper est un excellent outil de trading pour les spéculateurs forex et les day traders.
Les signaux de cet indicateur de scalping sont très clairs et faciles à lire.
Dessinez des barres vertes et rouges au-dessus et en dessous du niveau zéro dans des fenêtres de trading séparées : Les barres vertes s'alignent au-dessus du niveau zéro, indiquant une tendance spéculative haussière. Les barres rouges s'alignent en dessous de zéro, indiquant une tendance à la baisse du scalping. Les l
FREE

Th indicator is a technical analysis tool that helps identify significant changes in price trends and filter out minor price fluctuations. It is used to highlight price swings and provide a clearer picture of market movements. The Pivots are found by checking if a certain candle is the highest/lowest in a given number of candles that come before and after it. This indicator has only one input, its period. The Higher the period, the more strict the indicator is about what constitutes a Pivot. Th
FREE
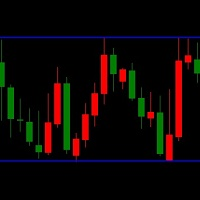
LT Triple Support Resistance Screen Method is a kind of levels indicator that consist of three SR lines. It is built by MQL4 programming language and can be used to MT4 platform. A free version indicator to determine the support and resistance levels easily This indicator works based on the screen method to calculate the most appropriate value for each buffer. A complex algorithm based on long research is applied to this free custom indicator. But this indicator has limited features and simpler
FREE

Donchian channels are a tool in technical analysis used to determine the relative volatility of a market and the potential for price breakouts.
Can help identify potential breakouts and reversals in price, which are the moments when traders are called on to make strategic decisions. These strategies can help you capitalize on price trends while having pre-defined entry and exit points to secure gains or limit losses. Using the Donchian channel can thus be part of a disciplined approach to manag
FREE

BeST_ Classic Pivot Points is an MT4 Indicator that is based on the widely known and definitely classic Pivot Point of a market prices activity. A pivot point is calculated as an average of significant prices (high,low,close) from the performance of a market in the prior trading period. If the market in the following period trades above the pivot point it is usually evaluated as a bullish sentiment, whereas trading below the pivot point is seen as bearish. A pivot point and the associated suppo
FREE

Pivot levels is indicator showing 7 pivot levels. It is adjusted for major use, including: all standard time frames
choice of periods to show three popular calculation formulas (typical, median, weighted) 9 level Camarilla pivot
pivot day shift choice of properties for lines and labels choice of showing alerts when crossing pivot lines Parameters: ----------Main parameters----------- Timeframe - time frame for pivot levels
Number of periods to show - displays pivot levels for number of period
FREE

This indicator detects price reversals in a zig-zag fashion, using only price action analysis and a donchian channel. It has been specifically designed for short-term trading, without repainting or backpainting at all. It is a fantastic tool for shrewd traders aiming to increase the timing of their operations. [ Installation Guide | Update Guide | Troubleshooting | FAQ | All Products ]
Amazingly easy to trade It provides value on every timeframe It provides suitable SL and TP levels
It impl

Après 7 ans, j'ai décidé de publier gratuitement certains de mes propres indicateurs et EAs.
Si vous les trouvez utiles, veuillez montrer votre soutien avec une évaluation de 5 étoiles ! Vos retours encouragent la continuité des outils gratuits ! Voyez aussi mes autres outils gratuits et mon signal en direct ici
_________________________________ Détecteur d'Engulf - Indicateur de Trading Simplifié Découvrez le Détecteur d'Engulf, un outil simple créé en MQL4 pour identifier
FREE
Pipfinite creates unique, high quality and affordable trading tools. Our tools may or may not work for you, so we strongly suggest to try the Demo Version for MT4 first. Please test the indicator prior to purchasing to determine if it works for you. We want your good reviews, so hurry up and test it for free...we hope you will find it useful.
Attention This trading tool is specifically designed to help grid, martingale, averaging, recovery and hedging strategies. If you are not familiar with t
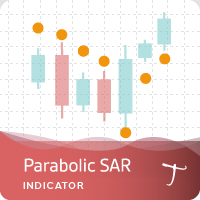
Tipu Parabolic SAR Panel is the modified version of the original Parabolic SAR indicator published by MetaQuotes here . Dashboard Panel (multi symbol) version for this indicator is available here .
Features An easy to use Panel that shows the Parabolic SAR trend and signals of selected timeframe. Customizable Buy/Sell alerts, push alerts, email alerts, or visual on-screen alerts. Customizable Panel. The panel can be moved to any place on the chart or minimized to allow more space. To enable th
FREE

HEDGING MASTER line indicator It compares the power/strength lines of two user input symbols and create a SMOOTHED line that indicates the degree of deviation of the 2 symbols Strategy#1- FOLLOW THE INDICATOR THICK LINE when CROSSING O LEVEL DOWN --- TRADE ON INDICATOR THICK LINE (TREND FRIENDLY) !! Strategy#2- TRADE INDICATOR PEAKS (Follow indicator Reversal PEAKS Levels)!! you input - the index of calculation ( 10/20/30....) - the indicator Drawing start point (indicator hi
Or DBD%. The indicator consists of colored tape that shows trading signals depending on two Bermaui Deviation Oscillator (BD%) and two moving averages. Bermaui Deviation Percent is a volatility index that measures volatility in percent rather than points. The idea of BD% is to make an index depending on Classic Standard Deviation (CSD) that moves between 0 and 100 percent. Important Information
DBD% expert advisor example: https://www.mql5.com/en/blogs/post/731145
If you want to know mor

This indicator is not only for trading but also for learning, thanks to it, you can learn to identify trend, support and resistance.
You've probably heard about the Dow trend theory, where higher highs and higher lows indicate an uptrend, and lower highs and lower lows indicate a downtrend. This indicator determines this trend based on the Dow Theory. You just need to enter a number representing the number of candles between extremes. The optimal solution is the number 3 (H1 TF), unless you
FREE

Lisek Stochastic oscillator indicator with Alarm, Push Notifications and e-mail Notifications. The Stochastic indicator is a momentum indicator that shows you how strong or weak the current trend is. It helps you identify overbought and oversold market conditions within a trend. The Stochastic indicator is lagging indicator, which means it don't predict where price is going, it is only providing data on where price has been !!!
How to trade with Stochastic indicator: Trend following: As lon
FREE

GTAS S-Trend is a momentum indicator that helps to determine trends using combination of MACD, RSI and moving averages. This indicator was created by Bernard Prats Desclaux, proprietary trader and ex-hedge fund manager, founder of E-Winvest.
Description The indicator oscillates between -65 and +65 with a neutral zone between -25 and +25 around a 0 equilibrium line. S-Trend between -25 and +25 indicates congestion zones with a bullish bias between 0 and +25, and a bearish bias between 0 and -25
FREE
1. Updated usage instructions in blog below: Smart Market Structure Trading System and Automatic Scanner - Trading Systems - 13 October 2023 - Traders' Blogs (mql5.com) https://www.mql5.com/en/blogs/post/754495 2. The Smart Market Structure Opportunity Scanner is a great tool to find trading entries and exits based on Smart Money Concepts. It has a build-in custom choice of Forex pair lists to choose from for the scan, and it also has a user-defined entry choice to put down your own list of Fo
FREE

Bollinger Bands Breakout Alert is a simple indicator that can notify you when the price breaks out of the Bollinger Bands. You just need to set the parameters of the Bollinger Bands and how you want to be notified.
Parameters: Indicator Name - is used for reference to know where the notifications are from Bands Period - is the period to use to calculate the Bollinger Bands Bands Shift - is the shift to use to calculate the Bollinger Bands Bands Deviation - is the deviation to use to calculate
FREE

The MACD 2 Line Indicator is a powerful, upgraded version of the classic Moving Average Convergence Divergence (MACD) indicator.
This tool is the embodiment of versatility and functionality, capable of delivering comprehensive market insights to both beginner and advanced traders. The MACD 2 Line Indicator for MQL4 offers a dynamic perspective of market momentum and direction, through clear, visually compelling charts and real-time analysis. Metatrader5 Version | How-to Install Product | How-t
FREE

Pipfinite creates unique, high quality and affordable trading tools. Our tools may or may not work for you, so we strongly suggest to try the Demo Version for MT4 first. Please test the indicator prior to purchasing to determine if it works for you. We want your good reviews, so hurry up and test it for free...we hope you will find it useful.
Combo Energy Beam with Swing Control Strategy: Confirm swing pullback signals Watch Video: (Click Here) Energy Beam with Trend Laser Strategy: Confirm Tr

Indicateur de tendance Un système unique pour déterminer la tendance pour chaque période,
Vous permet d’avoir une image réelle de la tendance de n’importe quelle paire de devises sur toutes les périodes standard ! Les carrés verts sont la tendance ACHETER et les carrés rouges sont la tendance VENDRE.
Technique de trading : si les petites périodes sont opposées à la tendance des plus anciennes, alors en raison de l'inertie du mouvement du marché, entrez dans les périodes plus anciennes comme
FREE
Le MetaTrader Market est un site simple et pratique où les développeurs peuvent vendre leurs applications de trading.
Nous vous aiderons à publier votre produit et vous expliquerons comment préparer la description de votre produit pour le marché. Toutes les applications de Market sont protégées par un cryptage et ne peuvent être exécutées que sur l'ordinateur de l'acheteur. La copie illégale est impossible.
Vous manquez des opportunités de trading :
- Applications de trading gratuites
- Plus de 8 000 signaux à copier
- Actualités économiques pour explorer les marchés financiers
Inscription
Se connecter
Si vous n'avez pas de compte, veuillez vous inscrire
Autorisez l'utilisation de cookies pour vous connecter au site Web MQL5.com.
Veuillez activer les paramètres nécessaires dans votre navigateur, sinon vous ne pourrez pas vous connecter.