Guarda i video tutorial del Market su YouTube
Come acquistare un Robot di Trading o un indicatore
Esegui il tuo EA
hosting virtuale
hosting virtuale
Prova un indicatore/robot di trading prima di acquistarlo
Vuoi guadagnare nel Market?
Come presentare un prodotto per venderlo con successo
Indicatori tecnici per MetaTrader 4 - 113
!! FLASH SALE !! Over 80% off !! For ONE week only. Now only $47 - normally $297!
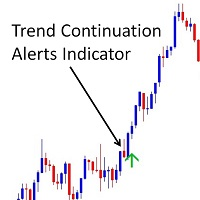
Buy and sell arrows on the chart when the trend is about to continue. Aslo Sends Alerts – On MT4 To Your Phone To Your Email.
Does not repaint.
Works on any pair, any timeframe. (Just ajust the settings for your pair and timeframe.)
10 Activations allowed so you are free from limitations
See an example of alerts from today (23 May 2020) using this and 2 other indicators here . MT5 version h
Questo filtro si basa sui polinomi di Bessel. Il suo principale vantaggio è un piccolo ritardo. Un'altra caratteristica di questo filtro è la sua elevata sensibilità agli ultimi valori delle serie temporali finanziarie. Per questo motivo, l'indicatore evidenzia i movimenti di prezzo attivi, attenuando le deviazioni del rumore. Oltre alla variante classica, all'indicatore sono stati aggiunti come funzione di ponderazione i logaritmi dei coefficienti di Bessel. In questo caso, l'indicatore risult

Highly accurate supply and Demand indicator that gives you the exact value of where the Demand or supply ends or starts. Has built-in Alerts Has ability to change colors to whatever you want. Has special feature to automatically change when the chart crosses into a new zone or breaks free from a weak zone. Great for any Manual Trader Set your own custom alerts you can have it check the history of the chart to see how other setups of supply and demand where made in the past.
[ MT5 Version ] Ultimate Alpha Trend MT4
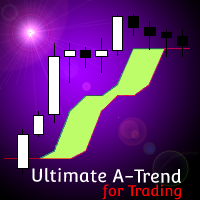
Ultimate Alpha Trend is the first trend indicator, which combines volatility, volume, average price and momentum. The results is a highly versatile representation of trendy and sideways market conditions, highlighting, at the same time, significant supply and demand levels. The Ultimate Alpha Trend indicator can be used to find entry oportunities and to set SLs taking into consideration current market volatility, volume and momentum. Besides that, the in
!! FLASH SALE !! Over 80% off !! For ONE week only. Now only $47 - normally $297! >>> Ends on 30 June 2023 - Don't miss it!
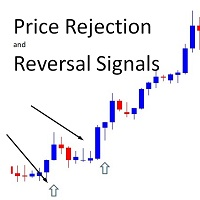
Buy And Sell Signal Arrows On The Chart When The Price Is About To Reverse. Also Sends Alerts – On MT4 To Your Phone To Your Email.
Does not repaint.
Works on any pair, any timeframe. (Just ajust the settings for your pair and timeframe.)
10 Activations allowed so you are free from limitations
MT5 version here . Spreads from 0.1pip RAW/ECN Acco

Trade any Forex combine out there. Many prop firms offer challenge or instant funding combines. The biggest problem is controlling the loss. With this indicator you can get a visual system that can limit loss and teach discipline. This uses the MACD and the strategy is scalping. You can determine the risk and reward. Visually follow small trends for scalps. Trade during active sessions. It's just a simple system to instill discipline while limiting loss and scalping pips with the paramet
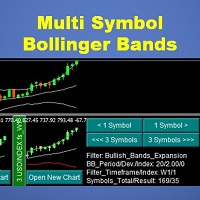
This indicator will display mini candlestick chart with Bollinger Bands indicator of the symbols that pass a filter criteria in the indicator subwindow from 1 to 10 symbols per subwindow. Feature:
Button to scroll 1 symbol, click to scroll the displaying symbols back and forth 1 symbol per click Button to scroll 1 page , click to scroll the displaying symbols back and forth 1 page(number of symbols per subwindow) per click Button to open new chart, click to force mt4 terminal to open a new cha

Holy Grail arrow is for scalping. The period you use will determine the trend. You can try different time frames and periods to see what works best for your strategy. Filters can be applied like a moving average or trendlines. The 1 minute works good for scalps and always trade during active periods and avoid consolidation times. Using other indicators to determine trends is recommended but this can also be a free flowing scalping system alone with tp and sl.
Inputs: Period = trend period

The Colored Volume is a simple, yet useful indicator that paints the color of the volume based on the price direction. If the price has increased, the volume will be shown in green. If the price has decreased, the volume will be shown in red. This indicator will make it super easy for traders to track volume bars based on price movements. (The settings of the volume bars including line width and color can be manually changed by the trader.)
MT4に表示している同一通貨ペアのチャート上で、水平線や垂直線、トレンドラインなどのオブジェクトを同期します。 このインジケーターを使うと、1つの時間足で作成した水平線などのオブジェクトが、同一通貨ペアの他のチャートにも同じオブジェクトが作成されるようになります。また、作成後の移動、プロパティ変更、削除なども同期することができます。
チャートオブジェクトが同期されるケース
・チャートオブジェクトの作成 ・チャートオブジェクトのスタイル変更(色、太さなど) ・チャートオブジェクトの移動 ・チャートオブジェクトの削除
対応しているチャートオブジェクト
以下24のオブジェクトに対応しています。 ・水平線
・垂直線
・トレンドライン
・平行チャネル
・フィボナッチリトレースメント
・フィボナッチ・エクスパンション
・フィボナッチ・チャネル
・フィボナッチ・タイムゾーン
・フィボナッチ・ファン
・フィボナッチ・アーク
・角度によるトレンドライン
・アンドリューズ・ピットフォーク
・標準偏差チャネル
・線形回帰チャネル
・サイクルライン
・三角

Oscillatore MACD con filtro trend avanzato e indicazione Alert. Determina la tendenza, le tendenze deboli vengono filtrate e viene indicata la nuova forza nella tendenza. MACD Oscillator funziona su qualsiasi timeframe e su tutti i simboli (valute, indici, petrolio, metalli, azioni, opzioni, grafici renko offline) 1. L'utente può modificare il valore MACD, 2. Filtro di livello MACD minimo, 3. Il valore di divisione filtrerà il rapporto di potenza con cui è necessaria l'indicazione del cambiament
!! FLASH SALE !! Over 80% off !! For ONE week only. Now only $47 - normally $297! >>> Ends on 30 June 2023 - Don't miss it!
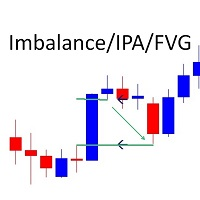
Marks Market Imbalance / Fair Value Gaps / Improper Price Action On The Chart. As traders continue to search for the best trading indicators to guide their investments, the I mbalance / I mproper P rice A ction / F air V alue G ap I ndicator has become increasingly popular. This indicator helps to identify opportunities for taking profit . Th
Speed Trade - Un ottimo strumento nelle mani giuste!
Il che ti permetterà di guardare il mercato dall'altra parte!
Tutti i segnali e gli impulsi nascosti che non hai visto verranno mostrati da questo prodotto!
Indicatore multivaluta che ti permette di fare trading su tutte le coppie di valute.
Il prodotto è anche in fase di test su materie prime e criptovaluta.
Si consiglia di utilizzare tempi non superiori a 1-5m, questo è un trading veloce e intelligente.
È completamente configu

This indicator is excellent for scalping on the M1 or M5 chart. Uses a special algorithm for the lines. No need to set up the indicator. Does not feature any alerts and is best used manually after visually confirming the line displays. NB: Make sure to download M1 history before testing and use.
How to use: Simply attach to M1 or M5 chart. Zoom chart out completely. Sell when all lines above the white line (PriceLine). Sniper line crosses above white line. Buy when all lines below the white li
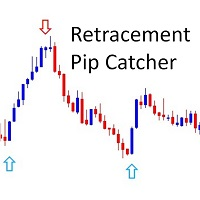
!! FLASH SALE !! Over 80% off !! For ONE week only. Now only $47 - normally $297! >>> Ends on 30 June 2023 - Don't miss it!
Buy and Sell Arrows when price is about to retrace. It Also Sends Alerts – On MT4 To Your Phone To Your Email
Does not repaint.
Works ony any pair, any timeframe.
10 Activations allowed so you are free from limitations
See an example of alerts from today (23 May 2020) using this and 2 more of my indicators here . MT5 Version here . Spreads from 0
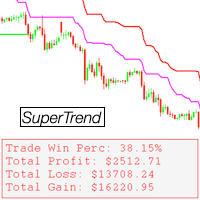
Super Trend Double Pro
- Includes the classic SuperTrend indicator x2 - Includes two indicators for much better market analysis - Comes with various settings - Comes with a display - Displays statistical win/loss information
The "Super Trend Double Pro" indicator provides the ability to combine two of the classic SuperTrend indicators into one, displaying two indicators with different settings on the same chart. The indicator comes with many customizable settings as well as a display which

This is a Manual Indicator to help Manual traders see the Trend Visually it allows you to fully control how the candle closes with many different options, and you can plot the path with many different options. This Indicator is best used in Timeframe: H1 or higher
Close Candle Methods
Close Open High Low Median Typical Weighted Close Median Body (Open+Close)/2 Average (High+Low+Open+Close)/4 Trend Biased Heiken Ashi Close Heiken Ashi Open Heiken Ashi High Heiken Ashi Low Heiken Ashi Media
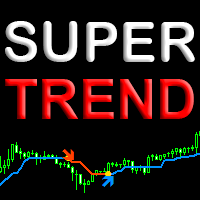
В Super Trend Line реализован один из лучших "price action" алгоритмов трендового индикатора. В связке с авторской фильтрацией это дает максимально точное определения тренда на любых трендовых валютных парах, акциях, криптовалюте без перерисовки результата. Индикатор легко настраивается и станет дополнительным помошником в вашей торговой системе. Подходит как новичкам так и профессионалам для всех видов трендовой торговли.
Как выбрать прибыльный таймфрейм и оптимизировать индикатор под валютну

Ready trading system. The indicator arrow shows when and in what direction you need to open an order. At the end of the blue rectangle we put TakeProfit, and at the end of the red rectangle we put StopLoss. The indicator calculates the size of TakeProfit and StopLoss automatically, depending on the market volatility and the probability of price direction. Therefore, the indicator does all the work instead of the trader. He analyzes the market himself, determines the distance for TakeProfit and

This indicator XRX Master indicator.Indicator displays trend movement. Indicator helps to buy and sell. Features FiltPer- displays indicator period.
deviation - displaus indicator deviation.
deviation2 - displaus indicator deviation 2.
HL_period - displaus indicator Highest and Lowest period. HL_period2 - displaus indicator Highest 2 and Lowest 2 period.
How to understand the status: If the trend color arrow is green, trend is up. I f the trend color arrow is red, trend is down.
//////
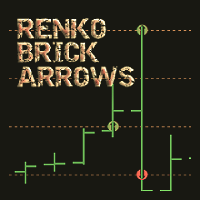
The ' Renko Brick Arrows ' indicator was developed to showcase the traditional renko brick grid pricing on chart. An alternative to using an offline chart generator for renko grid prices, and a unique charting style to strategize.
Key Features Renko bricks are drawn over the chart without having to generate a new chart. Optional horizontal lines shows where the next arrows are supposed to appear. Both one and two step reversals are available to draw arrows for buy and sell.
Input Parameters

IMPORTANT; Price is subject to rise at any time from now! Do not miss this offer! Dear trader I am glad to introduce my new tool called Trend Analyser Dashboard to you. The design, style, and settings of this indicator have been made simple to make its users not take too much time in understanding the indicator itself. The purpose is to help traders in analysing the direction of the major trend and the status of the trend whether in weak trend or its strong trend. The indicator will also prov
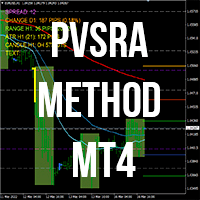
Metodo di scambio PVSRA. Il sistema si basa sul calcolo della direzione delle posizioni dei grandi giocatori, in cui guadagnano posizioni.
PVSRA è un'abbreviazione: P - Prezzo (Prezzo), V - Volume (Volume), S - Supporto (Supporto), R - Resistenza (Resistenza), A - Analisi (Analisi).
Il metodo PVSRA utilizza livelli di prezzo tondi (es. 1.2000) e livelli intermedi (es. 1.2250, 1.2750). Il consolidamento al di sotto del livello rotondo è la preparazione per le posizioni lunghe, il consolidame

Indicatore di scalping. I punti mostrano le posizioni di inversione del prezzo sul grafico. Non ridisegnato. Ritardo minimo. Funziona su timeframe M1, M5, M30, H1, H4. Puoi lavorare su tutte le coppie di valute. L'indicatore può funzionare anche su oro, argento e criptovalute. Questo indicatore può essere utilizzato anche per le opzioni binarie.
Come fare trading (un esempio di strategia per GBPUSD)? Quando appare un punto blu, acquista. Quando appare un punto rosso, vendi. TakeProfit fissato
Target Striking - One of the best binary options trading tools!
It is set up so powerfully that you can trade not only on currency pairs, but also on raw gold oil!
You can also try on cryptocurrency!
Ideal for trading on currency pairs, the percentage of reliable transactions is more than + 75%
The trading tool is already set for the best profit!
Only Target Striking can unlock the potential of the trading market for you!
With it, the signals are even and accurate without redrawing,

''SKPredict'' Show you next prediction of Close/High/Low/ Open Level. This indicator Used mathematical calculations . It means, that based on the previous movement of the market, the price movement is expected to be in predicted Level. Also you can See, what Happened in previous Data and Predictions and use Buffers to write your EA. Also In ' Tendency indicator '' , as full package of Predictions that every Trader need, there is the Predict line to show you the future of Price.

Improve trading with this indicator. Find areas of buys or sells in Fibonacci retracement areas. Fulltrend is for scalping and making swing trades. Fib levels are added for take profits and stop losses. This works on any time frame and can be used by itself or together with other systems and indicators for filters. The indicator doesn't repaint. Alerts are added and can be true or false. No need to sit glued to the computer, just set on charts and listen or the alerts to come. Take a pos
The Breakeven levels indicator is an indicator that, according to its algorithm of work, determines the number of open orders on a certain instrument finds the level at which all orders go from loss to profit. Separately, for sell and buy orders, the general level of the beginning of profit is found. In the lower left or right corner, information is displayed on three buttons to choose from. When you press the button, a horizontal line of a certain level is displayed on the screen. On the right
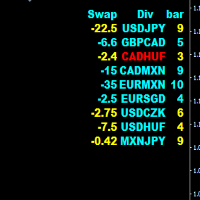
Divergence HiLo scaner is a good tool for market analysis. The indicator looks through all currency pairs and finds those that meet the selection conditions, where corrections or reversals to the main movements are supposed to begin. The indicator values are entered in the final table. 1 value is swap 2 Currency pair. 3 The number of bars after finding the selection conditions. The bar color blue is used for the buy signal. The bar color yellow is used for the sell signal. The color of the
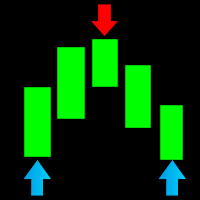
An indicator that shows price reversal points on the chart. Using RSI and other standard indicators, the indicator determines the price reversal points and shows them on the chart with arrows. The indicator does not redraw its values and in 95% of cases it shows accurate signals. This indicator works on all currency pairs and all timeframes.
How to trade with this indicator (recommendations): We recommend opening trades in the direction of the arrow that appears. If a blue arrow appears, op

Fibonacci retracements are trend lines drawn between two significant points, usually between absolute lows and absolute highs, plotted on a chart. Intersecting horizontal lines are placed at the Fibonacci levels. Fibonacci retracements are useful tools that help traders identify support and resistance levels. With the information gathered, they can place orders, identify stop-loss levels, and set price targets. Although useful, traders often use other indicators to make more accurate assessments
Multi-timeframe signal trend indicator.
Detects the trend direction and is colored in the corresponding color.
It has three different sensitivity options
Can show trend direction on other timeframes
Has embedded audible and visual alerts on trend reversals.
Can send notifications to your phone or email.
Allows trend and counter-trend trading.
Works on all timeframes, all currency pairs, metals, indices and cryptocurrency.
It can be used for binary options.
Distinctive feature
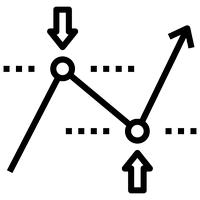
Questo indicatore mostra i livelli ottimali di take profit e stop loss. Questi livelli sono calcolati sulla base di dati storici. Al primo avvio, l'indicatore viene addestrato sulla cronologia. Dopodiché, valuta la probabilità che il prezzo superi questo o quel livello in futuro e seleziona le opzioni più ottimali per piazzare ordini stop. Ad esempio, i valori di take profit sono selezionati in modo che il profitto sia massimo e la probabilità che il prezzo raggiunga il suo livello sia la più a

RSI Signals is a simple dashboard type indicator that displays the values of the RSI (Relative Strength Index) oscillator on various instruments and time frames chosen by the user. In addition, it can be configured by the trader to show signals when the RSI is in an overbought/oversold condition, when it crosses these levels or when it crosses the 50 level, which is important in some strategies. It is simple and easy to set up. By itself, it should not be used as a trading system since RSI signa
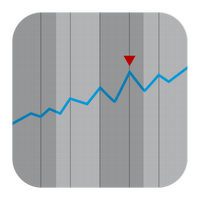
La serie ipergeometrica viene utilizzata per calcolare i coefficienti di peso di questo filtro. Questo approccio consente di ottenere un livellamento piuttosto interessante delle serie temporali. I pesi del filtro ipergeometrico non decadono velocemente come le medie mobili ponderate esponenziali e lineari, ma più velocemente delle medie mobili uniformi. Per questo motivo, il comportamento di questo filtro è per molti versi simile al comportamento delle medie mobili. Tuttavia, ha diversi vantag

Scalping Code is for trend scalping. It is simple to use and is profitable. It can work on any time frame and any asset. This indicator can be used on it's own or together with another system. The arrow does not repaint or recalculate.
The rules are as follows: A blue arrow above the moving average is a buy. An exit for the buy above the moving average is a red arrow or target. A red arrow below the moving average is a sell. An exit for the red below the moving average is a blue arro

Indicator MT4 : DXMA(Direction index moving average)
Objective: To track price trends and price reversals.
How to set up Indicator DXMA : 1. The standard value is EMA 12 and EMA 26, you can set it as you like. 2. UTBx 14 is Universal Trend Boundary Index, standard value 14. 3. UTBx Method is a method for calculating the standard value is Exponential.
Meaning of symbols in indicators : 1. The line of the green group means the trend is up. 2. The line of the red group represents a down trend
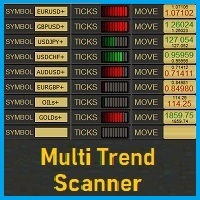
MultiTrend_Scanner is an indicator for the MT4 platform that is used to review trends on multiple symbols. We turn it on on any symbol, on any TF and we have a preview of the entire market. The current symbol is permanently assigned in the first segment of scanner. When adding another segment, you can manually enter any symbol. The quantity of added segments is unlimited. In each segment of a given symbol displayed are trends on different TFs. To calculate the strength of these trends are used
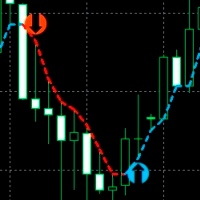
An indicator for accurately determining price reversal points on all timeframes and all currency pairs. With the help of technical analysis of the market and mathematical diagnostic models, this indicator determines the price reversal points and the current trend direction with great efficiency. The indicator displays this information on the chart in the form of arrows and lines. The arrows show the trend reversal points and the lines show the current trend direction. INDICATOR trades in real ti
This indicator is based on the same famous fractal indicator with a slight difference:
MetaTrader version 5 click here
Advantages:
Works on all instruments and time series,
Does not redraw its results,
Comparison depth is adjustable,
Works well with any popular strategy,
Adjust the power of fractals
Input settings:
Number of comparisons - The number of candles that each side selects for comparison.
Marker distance from the candlestick
This indicator is based on ParabolicSAR. This indicator does not change the trend easily and does not change the trend until it receives a clause and approval. This indicator can be used for trail stop or trend detection.
MT5 Version
benefits:
Works on all instruments and time series,
Does not redraw its results,
Comparison depth is adjustable,
Works well with any popular strategy,
The power of the areas is adjustable,
We assure you that we we
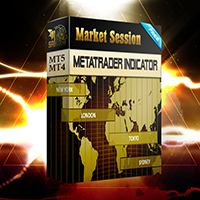
The Market Sessions Indicator for MT5 helps you predict market turnarounds by detecting major supply and demand areas. These pivot points tend to occur after a new session has started and the previous one is still open. It is also used to gauge how many points or pips the market moves on average during a session. This helps us to place better our take profits and stop losses. The indicator works on all forex pairs, gold, silver, commodities, stocks, indices and any other instrument that yo

The Stochastic Dashboard is multi currencies and multi timeframes dashboards. It shows the Stochastic direction for the chosen pairs/timeframes. For the Stochastic lovers and manual trader this indicator is a most indicator which can be used to determine the market direction for the pair(s) you are trading. Set it to one chart only and monitor from one place all the charts you want.
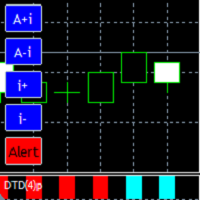
It is a very comfortable and easy to use indicator, as well as very powerful and precise. It is a digitalization of the Oscillometer indicator. Detects and visually shows us the beginning of a new trend . The way to present it, is by means of a two-color bar graph , one for the start of the uptrend, and one for the start of the downtrend . The parameter with which the indicator is built, is the maximum allowed amplitude of price oscillation. The indicator will follow the price checking its

Price pivot point indicator. The indicator shows with points on the chart the places where the price can turn in the opposite direction. When the indicator draws a red dot, it means that the price can turn its movement down. When the indicator draws a blue dot, then the price can turn its move up. This indicator can be used for both manual trading and automated trading by integrating it into your robot. To do this, the indicator has data exchange buffers.
Recommended currency pairs: XAUUSD EU
PAX Simple Trend Signals for MT4
Самый простой и лёгкий в работе индикатор для торговли по сигналам разворота тренда. Зелёными и красными линиями на ценовом графике отображаются направления тренда — растущий и падающий соответственно. Стрелка вначале линии тренда сигнализирует о развороте тренда.
Если на трендовой линии появилась стрелка такого же цвета — это сигнал на открытие нового ордера. Если на трендовой линии появилась стрелка противоположного цвета — это сигнал на закрытия всех орде

A professional trading indicator with double-entry options. Valuable Smooth Channel Lines on the separated window, Trend Lines both on the main window, and separated window and entry arrows. Good for trading scalping in the lower timeframes. Even also it can work and provide signals in the higher timeframes for longer-term trading periods. INDICATOR SETTINGS: 1. Signal Mode. There are 2 options: Default and Compact. If Default, it will provide 3 different arrow codes on the main window. This o
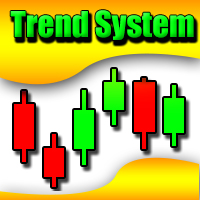
Advanced Trend System è un indicatore innovativo che utilizza un algoritmo proprietario che consente di trovare potenziali punti di inversione di tendenza con un'alta probabilità e ricevere segnali per entrare nel mercato all'inizio di una formazione di tendenza. L'indicatore seguirà le attuali condizioni di mercato e solo quando tutte le strategie interne saranno concordate e saranno in confluenza al 100% l'una con l'altra, l'indicatore fornirà un segnale di acquisto o vendita. L'indicatore è
MT5 Version A versatile tool
You do not need any other tools with this tool.
You can enable or disable all indicators.
Their values are adjustable.
In the first line you will see a summary of your account status.
p: The amount of your profit or loss
BP: The amount of your daily profit based on the balance
EP: Equity daily earnings
WP: Your weekly profit
MP: Your monthly profit
The next line shows each of the time frames you selected.
Chikou: The Chikou process
KT: The trend of t

This indicator has as many dots as a Rollex watch..
Also in the kit we have 3 built-in indicators that are combined and configured in such a way that would give you a profit of 75% and that's not all
for your convenience, you can reconfigure it! Initially, it is configured for currency pairs, but if necessary, we can reconfigure it for cryptocurrency and also raw gold, whatever you want!
Not just an arrow indicator, but an Alligator in the world of the Market, then you will like how it sh

L'indicatore di allarme di inversione della struttura del mercato rileva quando una tendenza o un movimento di prezzo sta raggiungendo la fine del suo ciclo di vita e sta per invertire. Ti avverte quando la struttura del mercato sta cambiando, cosa che di solito accade quando è probabile che si verifichi un'inversione o una grande flessione. Quando viene raggiunto un nuovo massimo o minimo attorno a un possibile punto di esaurimento, l'indicatore rileva i breakout e lo slancio del prezzo. L'indi

Overview: With so much noise and distraction in the markets I wanted to create clarity for traders to have a simple, efficient, and fun trading experience. This is why I created Pipsurfer. Pipsurfer is an trend following indicator that visually shows you important Institutional Smart Money levels in the market and helps you to trace Market Structure in the markets. Most traders find it difficult to visually see trading elements such as trend, structure and momentum which are key for understandin
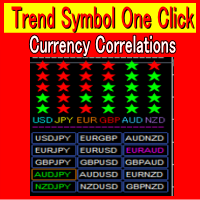
Currency Strength Meter 1:Correctly identifying trends in foreign exchange investments is critical. 2:TrendSymbolOneClick quickly detects and displays trends that have just begun and those that have already been in place for an extended period of time. 3:There is also a USD JPY EUR GBP AUD NZD strength function. 4:Volatility allows you to know exactly when there is a major market move. 5:You can save time in your market analysis by using Trend Symbol One Click. 6:Analysis available from 1 minut

Master Point is an indicator set that includes the most powerful and necessary tools for a trader, giving that very edge in the markets to be successful. An indicator that has an elegant and complete system that works very well in all markets (Forex, Crypto, Stocks, Indices) helps to find the best reversal points. It has tools such as trend reversal detection, pivot points, divergences, currency strength and 'candle strength'. All this makes the indicator a complete tool that does not require a
Apollo Binary Options Indicator è un indicatore di segnale per il trading di opzioni binarie. Il segnale arriva all'apertura della candela corrente ed è valido fino alla sua chiusura. Il segnale è accompagnato da una freccia e da un messaggio di segnalazione direttamente sulla tua carta. Il tempo di scadenza dell'opzione consigliato è di una candela. Cioè, se il grafico è H1, il tempo di scadenza sarà di 1 ora. Se il grafico è M5, il tempo di scadenza dell'opzione sarà di 5 minuti. Ma in effetti

Horizontal tick volumes (HTV) Horizontal tick volumes - an easy and convenient indicator of a horizontal market profile in a user-selected time. Produces a visual image of strong trading levels by maximum peaks past volumes and trading direction by color (sell or buy), and also allows you to detect smaller trading levels by differentiating past volumes. In the "Optimal" mode, when displayed on chart periods up to and including "M30", the data of one-minute bars are used, on H1 and H4 - five-minu

IGRIDCOIN.COM PRESENT SIGNALS FROM THE OUTER LIMITS! IgridCoin Space Signals is a unique 4 in 1 reversal trend indentation bot 100% non-repainting multi-timeframe indicator that can be used on all symbols/instruments: forex, commodities, cryptocurrencies, indices, stocks. “Igrid space signals” it will determine the current trend and at what point a reverse will happen at its early stages, gathering information and data from up to 4 special indicators, which are: Average Directional Movement Ind
PROFITABLE TRADER is an interesting name for this indicator... And all because it is for a true trader who values his time. It has a built-in Alert and parameters that will make your work easier. Open settings will allow you to set the indicator to any cryptocurrency or just currency. It's better to test and then draw a conclusion .. screenshots will show everything.. good bidding my friend.

This indicator is named so for a reason, because it will show the reverse side of the market.
It has several math indicators built in that are tuned to show the best signals for currency pairs!
Ideally proved to be in work on the M5-M15 no more and no less!
Only at the same time it shows up to 86.5% of correct signals!
The settings include the colors of the arrows, the alert, and the same parameters so that you can reconfigure the indicator and trade on cryptocurrency and raw materials!

An excellent indicator for those who like fast binary options trading!
It works great on m1-m5 timeframes!
The periods are customizable, so you can even set up for cryptocurrency, and trade on weekends!
You can also customize the color of the arrows!
Works on all timeframes!
But as stated above, it's better on m1 - m5!
Whatever you forget about the signal, it has an alert!
Test and try this indicator! If I have questions write, I will gladly listen to suggestions and errors!

By TFT Professional - One of our best MT4 products
which does not draw or change the positions of the arrows.
an arrow appears on the current candle.
periods are customizable as well as the color of the arrows.
with this indicator you will feel what you need from the market,
This is the stability and openness of the market.
Multi-timeframe and multi-currency indicator!
Test and try it in action!

L'indicatore Promining Trade Signal completerà qualsiasi strategia e può anche essere utilizzato come strumento indipendente. Benefici Tempo consigliato M30 Facile da usare; non sovraccarica la grafica con informazioni non necessarie. La possibilità di utilizzare come filtro per qualsiasi strategia. L'indicatore non cambia colore dopo la chiusura della candela. Funziona su azioni, indici, petrolio, oro e su tutti i tempi. Ha la funzione di notifiche push e avvisi sonori. Avviso - abilita/disabil

Market Meter is designed for explore various trends in current trading symbol. with Market Meter you can get a clear idea about the trends running on different time frames of current symbol. This indicator uses separate window to display its data. Every time when a new trend occurred, Indicator shows it with displaying an arrow on related text area. It's very important to identify the trends of higher time frames when you trading lower time frames. Let the Market Meter to do the work for you.

Pipsurfer Dashboard is a multi-currency multi-timeframe dashboard designed to alert you to where the action is happening in the forex markets. The software trades a trend based price action and market structure strategy. Assets Supported: All Forex Metals Indices Major Crypto
Major Input Settings: Timeframe Filters - Choose which timeframe you want the Pipsurfer Dashboard to signal you on. Pair Selection - Choose To Follow All Major Pairs And Crosses or have a custom list of your choice Aler

" Scalping saham " is a unique, turnkey scalping trading system. It shows the trader when and where to open and close trades. Scalping trading is one of the most effective, but at the same time, the most complex trading systems. Therefore, if you don’t have your own strategy yet, you’d better take a ready-made scalping strategy and work with it. The scalping strategy of this indicator is to determine the direction of the trend with high accuracy, then determine the price reversal points and giv
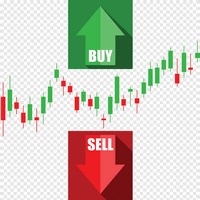
Questo indicatore utilizza massimi e minimi locali delle serie di prezzi. Dopo aver evidenziato gli estremi, i loro valori vengono smussati. Grazie a ciò, vengono costruiti due canali: esterno e interno. Il canale interno mostra i limiti se il movimento del prezzo segue rigorosamente un andamento lineare. Il canale esterno mostra i confini per il movimento dei prezzi con un andamento logaritmico. Dopo aver calcolato i canali, l'indicatore analizza il movimento del prezzo reale e offre consigli

Divergence and Convergence are important harbingers of reversals in stock markets.
The Divergence Sync indicator is designed to automatically search for divergences on a large number of indicators with different parameters.
The search for divergences is carried out on these indicators: (CCI, CHO, DeMarker, MACD, MFI, Momentum, OBV, OsMA, RSI, Stochastic, WPR, Awesome Oscillator ).
To search for divergences, you can use one technical indicator or search simultaneously on any number of indic

L'indicatore TickCounter conta i tick avanti e indietro su ogni nuova barra.
Il calcolo inizia dal momento in cui l'indicatore viene posizionato sul grafico.
Le barre dell'istogramma rappresentano: Barre gialle - numero totale di tick; Barre blu - tick UP; Barre rosse - segni di spunta GIÙ. Se la barra blu non è visibile, ci sono più segni di spunta verso il basso e la barra rossa viene visualizzata sopra quella blu (il livello rosso è sopra quello blu). MT5 version: https://www.mql5.com/e

Trading Indicator Lab’s Trend Navigator for MT4 is an indicator that can help you reveal the underlying trends in any chart on any timeframe. Determining Trends It only takes a minute or two to analyze the indicator with its simple yet insightful methods of representing bullish, bearish and ranging price action across the chart. It forms a single line that runs in 3 directions: Upward direction – represents a significant bullish price action Horizontal direction – represents ranging price action
SL Curruncy impulse flow of this intraday Asian London New York Sessions strength.SL Curruncy impulse indicator best for intraday scalper. market powerful move time you can catch best symbol. because you'll know which currencies are best to trade at that moment. Buy strong currencies and sell weak currencies Suggested timeframes to trading : M1 - M5 - M15 - M30 -H1 You can however just change SL Curruncy impulse to check in the settings. Bear in mind that scanning very low timeframes. How d
MetaTrader Market - i robot di trading e gli indicatori tecnici per trader sono disponibili nel tuo terminale di trading.
Il sistema di pagamento MQL5.community è disponibile per tutti gli utenti registrati sul sito MQL5.com che effettuano transazioni su MetaTrader Services. Puoi depositare e prelevare denaro usando WebMoney, PayPal o una carta di credito.
Ti stai perdendo delle opportunità di trading:
- App di trading gratuite
- Oltre 8.000 segnali per il copy trading
- Notizie economiche per esplorare i mercati finanziari
Registrazione
Accedi
Se non hai un account, registrati
Consenti l'uso dei cookie per accedere al sito MQL5.com.
Abilita le impostazioni necessarie nel browser, altrimenti non sarà possibile accedere.