Guarda i video tutorial del Market su YouTube
Come acquistare un Robot di Trading o un indicatore
Esegui il tuo EA
hosting virtuale
hosting virtuale
Prova un indicatore/robot di trading prima di acquistarlo
Vuoi guadagnare nel Market?
Come presentare un prodotto per venderlo con successo
Nuovi indicatori tecnici per MetaTrader 4

Manual guide: Click here Starting price of $88 for the first 25 copies only ( 2 left)! -- Next price is $176 .
This indicator is unstoppable when combined with our other indicator called Support & Resistance . After purchase, send us a message and you could get it for FREE as a BONUS! Introducing Trend Punch , the revolutionary forex trend indicator that will transform the way you trade! Trend Punch is uniquely designed to provide precise buy and sell arrows during strong

L'indicatore LEVELSS mostra:
- Zona rialzista e ribassista giornaliera. È visibile tutti i giorni dalle 00:00 alle 23:59. - La zona rialzista e ribassista settimanale. È visibile da lunedì 0:00 a venerdì 23:59 ogni settimana. - Canale appositamente calcolato da un timeframe specifico che viene visualizzato su tutti gli altri timeframe. Per impostazione predefinita, si tratta del timeframe a 4 ore, che può essere modificato in qualsiasi altro timeframe si desideri operare. Viene calcolato sen
WONNFX iN M5 - Arrow indicator for Forex and Binary Options. Reliable signal algorithm. Indicator not repaint. Indicator working hours: 21:55-23:00. GMT+2. Average winrate = 60-70%.
Recommendations: Timeframe: M5. Expiration: 2-3 candles (1 candle = 5 minutes) Symbol: EURUSD, USDJPY, EURAUD, GBPAUD, EURJPY, AUDUSD, USDCAD, NZDUSD, AUDCAD, AUDCHF, AUDJPY, AUDNZD, CADJPY, EURCAD, EURGBP, GBPUSD, GBPCAD, NZDJPY, CADJPY, XAUUSD
FREE
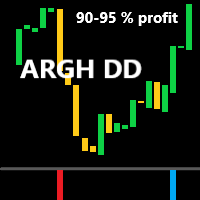
Indicatore di acquisto-vendita ARGH DD
Questo indicatore è un indicatore dell'istogramma.
È un indicatore potente e accurato con pochissimi falsi positivi.
Le operazioni che attivano durano giorni o settimane.
Ma sono transazioni molto stabili.
Naturalmente le regole di ingresso sono molto semplici:
️la barra dell'istogramma blu indica l'apertura di una posizione di acquisto;
️la barra rossa dell'istogramma indica l'apertura di una posizione di vendita.
Non dovremmo sorprender

Indicatore BRICS
Bentornati sulla nostra pagina!
Acquista presso la freccia bianca. Vendi alla freccia gialla.
È molto semplice.
Non entrerò nei dettagli.
Sono sicuro che hai abbastanza esperienza e conoscenza.
Penso che le immagini allegate mostrino molto chiaramente la potenza di questo indicatore.
Su AUDCHF, GBPUSD, AUDJPY, NZDUSD funziona molto bene.
Può darsi che su altre coppie dia segnali più rari oppure ci sia qualche perdita.
Provalo e basta!
Lo metterò anch'io all'
Questo potente strumento identifica automaticamente le linee di tendenza, aiutandoti a semplificare la tua strategia di trading e prendere decisioni più informate. versione MT5
Funzionalità chiave Rilevamento della linea di tendenza automatica : l'indicatore della "tendenza di base" scansiona il mercato per potenziali linee di tendenza e le visualizza istantaneamente sul grafico.Questo ti fa risparmiare tempo prezioso e ti assicura di non perdere mai una tendenza importante. Pannello intuitivo

Renko Masterx è un indicatore di tipo freccia mt4 progettato per scambiare grafici renko, questo indicatore ha un dashboard di backtest che fornisce al trader informazioni utili come tasso di vincita e punti vinti, fornisce anche tp e sl nella moltiplicazione atr x, questo indicatore dà il suo segnale sulla barra aperta o intra bar, e ha un indicatore bianco che segnerà il prezzo esatto in cui è stato dato il segnale, il modo per utilizzare questo indicatore è aprire un acquisto o una vendita s

La freccia Spider Renko è un indicatore a freccia basato su Renko che fornisce il segnale sulla barra aperta/intra bar e utilizza 2 strategie per tracciare il segnale. Questo indicatore può essere utilizzato per scalpare una barra TP o per oscillare il commercio se utilizzato con periodi più alti nelle sue impostazioni. Questo indicatore non viene mai ridipinto o verniciato. ================================================== ======= Parametri: Periodo di ingresso: periodo del segnale principale

Binary atm è un indicatore di segnali di opzioni binarie che si basa su 2 pezzi, il primo ha la forma di una linea colorata che indica la direzione del trend e detta le vendite solo sugli acquisti, il secondo è un segnale di ingresso a forma di punto che si accende su BAR OPEN e non si ridipinge mai e non è ritardato.
MODO D'USO:
Attendi che un punto di vendita appaia sulla barra aperta Se la barra precedente aveva un colore della linea di vendita rispetto all'apertura di una vendita, la tu

Il BMW M5 è un indicatore ad alta velocità progettato per lo scalping, che fornisce segnali estremamente precisi e rapidi per i cambiamenti di direzione dei prezzi su qualsiasi timeframe, inclusi i più piccoli: M1 e M5. Funziona con tutte le coppie di valute, permettendo ai trader di analizzare il mercato utilizzando un sistema di trading scalping intraday. Operando sui timeframe M1 e M5, fornisce ai trader decine di segnali di ingresso ogni giorno. Raccomandazioni per l'uso: Quando l'indicatore
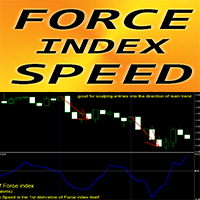
Forex Indicator " Force index Speed" for MT4 The calculation of this indicator is based on equations from physics. Force index Speed is the 1st derivative of Force index itself F orce index is one of the top indicators that combines price and volume data into a single value Force index Speed is good for scalping entries into the direction of main trend: u se it in combination with any suitable trend indicator Force index Speed indicator shows how fast Force index itself changes its d
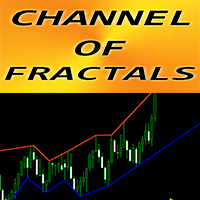
Forex Indicator "CHANNEL of FRACTALS" for MT4 This indicator is showing actual local Trend lines based on Highs/Lows of Fractals Great for traders who use Graphical Analysis Resistance local trend lines - Red color Support l ocal trend lines - Blue color It has few parameters responsible for number of fractals, trend line colors and width // More great Expert Advisors and Indicators are available here: https://www.mql5.com/en/users/def1380/seller // Also you are welcome to join to pro

Forex Indicator " Hanging Man pattern" for MT4 Indicator " Hanging Man pattern " is very powerful indicator for Price Action trading: No repaint, No delays; Indicator detects bearish Hanging Man patterns on chart: Red arrow signal on chart (see pictures) PC, Mobile & Email alerts are included Indicator "Hanging Man pattern" is excellent to combine with Support/Resistance Levels : https://www.mql5.com/en/market/product/100903 // More great Expert Advisors and Indicators are available he

Introducing our exciting new Price Retest indicator! Get instant alerts when the price retests, giving you a powerful edge in your trading strategy. Remember to do your own analysis before making any moves in the market. Here’s a detailed explanation of how the Price Retest indicator works, its components, and how you can incorporate it into your trading strategy: The Price Retest indicator is designed to notify traders when the price breaks through a key level (support or resistance) and subse
FREE

The Channel Scalper Pro Indicator is a highly efficient tool for market analysis based on price channels and signal arrows. This indicator is designed for the MetaTrader 4 (MT4) platform. It utilizes a combination of channels and visual signals to provide fairly accurate entry and exit points in the market. Below is a detailed description of the indicator, its functionalities, and usage strategies. Technical Description Channels: The channels presented by the indicator display the upper and lowe

Advantages of the Tick Volume Indicator: Identifying Market Sentiment : A predominance of green bars on the histogram may indicate an uptrend or strong buying pressure, useful for determining entry points for long positions. A predominance of red bars indicates a downtrend or strong selling pressure, useful for determining entry points for short positions. Analyzing Market Activity : The indicator helps identify periods of high activity, when significant changes are occurring in the market, and
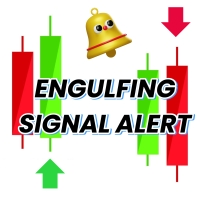
Engulfing Candle Signal Alert: Elevate Your Trading Strategy Unlock the full potential of your trading with the Engulfing Candle Indicator, the ultimate tool for identifying market reversals and enhancing your trading precision. Designed specifically for traders who value accuracy and timely alerts, this powerful indicator detects engulfing candle patterns, a key signal in technical analysis that often indicates a potential shift in market direction. What is an Engulfing Candle?
An engulfing c
FREE

This is Shades and Trades Fx anniversary!
As a way to give back, we have combined all of our beloved indicators the likes of: Key level order block , Key level supply and demand , Key level liquidity grab and Key level wedge into one single indicator and dashboard.
Whats new Dashboard : There is an easy access dashboard for all your needs. Multi-timeframe button : There is now a multi-timeframe option for Order Blocks and Supply and demand zones, making it easy to see higher timeframe zones
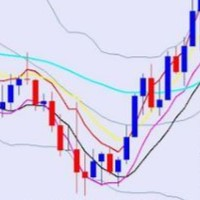
BBMA Terdiri dari indikator BB dan 5 Moving Averages, BBMA Oma Ally (OA) merupakan sistem trading buatan seorang trader asal Malaysia bernama Oma Ally. Setelah melalui penelitian dan pengujian selama bertahun-tahun, beliau membantu banyak trader sejak 2010 dengan sistem ciptaannya ini.
Di kalangan trader Indonesia sendiri, BBMA OA sudah mulai populer sejak beberapa tahun lalu. Saking populernya, sistem trading ini sampai mempunyai komunitas khusus gabungan trader dari beberapa negara.
Men
FREE

The indicator defines the buy and sell arrows with high performance and consistent results. Suitable for trend trading or following the trend. Automatic analysis of market opportunities ; Help traders earn more from their investments;
Never repaints, recalculates or backpaints signals; This is FREE demo version of the indicator and works only on "EUR USD M15" . The demo version does not work on SUFFIX OR PREFIX brokers ! Forex Trend Commander All details about the indicator here :
FREE

Bagaimana Cara membaca market melalui FMCBR-W - Didalam dunia trading ini pelbagai cara digunakan oleh trader dan penganalisa market membaca dan memahami trend. - Dari sudut FMCBR permulaan trend atau permulaan pullback dikenali melalui CB1. Apa pun dari sudut FMCBR-W trend didefinasikan melalui 3 combinasi yang saya akan kupas di muka surat seterusnya nanti. - Saya amat berharap agar pengunaan FMCBR-W nanti amat perlu terlebih dahulu memahami basic FMCBR…. Ini kerana kebanyakan entry FMCBR-W a
FREE

Sync Cursor MT4 Tool will It make the Horizontal Line + Vertical Line in the Screen That it is always present on the screen and that it moves along with the candle (with the price). I am sure that something so simple will be a Treasure in the hands of many people. Some of my personal trades are posted voluntary and free of charge in this Public channel https://t.me/FXScalpingPro Contact: https://t.me/TuanNguyenTrader
FREE

The indicator defines the buy and sell arrows with high performance and consistent results. Suitable for trend trading or following the trend. Automatic analysis of market opportunities ; Help traders earn more from their investments;
Never repaints, recalculates or backpaints signals; This is FREE demo version of the indicator and works only on "EUR USD M5" . The demo version does not work on SUFFIX OR PREFIX brokers ! Trend Reversing PRO All other details about the indicator here
FREE

The indicator defines the buy and sell arrows with high performance and consistent results. Suitable for trend trading or following the trend. Automatic analysis of market opportunities ; Help traders earn more from their investments;
Never repaints, recalculates or backpaints signals; This is FREE demo version of the indicator and works only on " USDCHF M30" . The demo version does not work on SUFFIX OR PREFIX brokers ! Trend Reversing PRO All other details about the indicator her
FREE

The Awesome ATR Indicator is a technical analysis tool developed for the MetaTrader 4 (MT4) platform. This indicator is designed to assist traders in determining stop loss and take profit levels based on the average value of the Average True Range (ATR). By leveraging the market volatility data provided by ATR, this indicator offers more accurate and dynamic guidance in setting these crucial trading levels. Key Features: Dynamic Stop Loss Determination: Calculates stop loss levels based on the A
FREE

This simple yet remarkably effective trend-continuation and breakout indicator acts as a powerful tool designed to aid traders in distinguishing genuine trend extensions from false breakouts. Through the utilization of a unique three-time-unit correctional phase guideline, it provides clear signals, offering trading opportunities with attractive risk-reward ratios.
Key Features Reliable Signals: The indicator confirms a genuine trend continuation or breakout if the price continues to trade

The Prop Trading Scalper indicator is a tool used for manual traders to assist in passing prop trading challenges, which are evaluations set by proprietary trading firms to determine a trader's skill and discipline. This indicator is particularly designed for scalping, a strategy that involves making numerous small trades to capitalize on minor price movements.
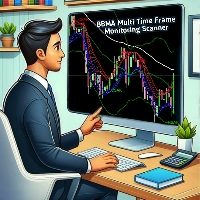
Indicator BBMA FULL SETUP Scanner ini berbasic Multi Time Frame Monitoring dan dapat di gunakan untuk entry secara langsung saat sinyal muncul Aturan Penggunaan Indicator : 1. Tunggu Full Setup BBMA / EMA 50 Cross Mid BB 20
2. Tunggu Reentry / Reetes CANDLE saat terjadi CSAK / CSM
3. Stop Loss Candle CSAK / CSM yang terbentuk
4. Take Profit = 2-5 x Jarak Stop Loss Jika ingin menggukan indicator ini secara Free dan unlimited dapat join di bawah IB ARFX dan jangan lupa informasikan no akun an
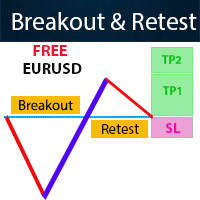
It is free on EURUSD chart.
Contact me for any questions All Symbols version! Introduction The breakout and retest strategy is traded support and resistance levels. it involves price breaking through a previous level. The break and retest strategy is designed to help traders do two main things, the first is to avoid false breakouts. Many false breakouts start with a candlestick that breaks out of a level but ends with an immediate candlestick that brings the price back into the level. Th
FREE

Using this indicator, you can see the moving average of 7 time frames in (one time frame) the same time frame you are.
You can also set orders to enter buy or sell positions automatically when the price hits Moving.
You can also set orders to risk free or close existing positions when the price hits Moving.
Also, receive a notification on your mobile phone when the price hits Moving.or position will be risk free or close .

PTW NON REPAINT TRADING SYSTEM + HISTOGRAM Non-Repainting , Non-Redrawing and Non-Lagging Trading System.
Does the following: - Gives Accurate Entry and Exit Points - Scalping, Day and Swing Trading - 95% Accuracy - Targets, where to take profits. - Shows Trends, Support and resistance levels - Works on All Brokers - Works on All Currencies, CFDs and Stocks - It does not place trades for you, it only shows you what trades to place. - It works on All Timeframes - It is for Trend or ra

POWER TO GET WEALTHY TRADING SYSTEMS.
NON REPAINT REVERSAL ARROW AND CHANNEL Intra-Day trading and Scalping Strategy: Designed for fast and accurate day trading and short-term trades.
Day and Swing Trading Strategy: Can be used as a reliable tool for day and swing traders who aim for the big moves of the price.
Multi Currencies and Markets: Works on different instruments and markets with its reliable precision.
Multi Timeframes: Can be used on multiple timeframes with good perfor

(Currently 30% OFF)
Before reading the description of this indicator, I just want to introduce to you following concept Moving Average Line - Typical moving average which is based on one chart alone. Currency Strength Line - The moving average of a certain pair in which the strength is based on 28 pairs. Can be said as the real moving average line.
Moving Average indeed is one of the most popular indicator which almost every trader use. Currency Strength Meter is also a trend indicator whic
MultiCharts - indicatore multivaluta per l'analisi visiva di diversi strumenti di trading. costruisce grafici degli strumenti selezionati in una finestra separata; mostra i livelli di eventuali ordini stabiliti; mostra profitto/perdita, numero e tipo di posizioni aperte; costruisce indicatori tecnici Moving Average, Trend filter e grafici Heiken Ashi; mostra lo spread, OHLC - prezzi della barra corrente; mostra la variazione di prezzo relativa per il giorno corrente *; * - per i periodi fino a

As you know, the price always moves in a certain channel and when the price goes out of the channel, it always tends to return back to the trading channel The Ind Channel Exit indicator will help you not to miss the price going out of the channel It can show an alert or send a message to the terminal on your smartphone that the next bar has closed above or below the channel levels It has a minimum number of settings and the main parameter is the Channel Multiplier , which determines the width o
FREE
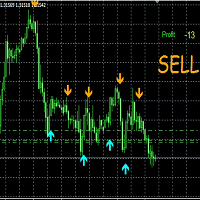
Your money-making tool is here!! This is an indicator that provides analysis and identification of the current trend in any time frame of any trading market, Broker recommened exness , Channel live trading Signal Vip : https://www.mql5.com/en/signals/2154351 Your job is to download it and drag and drop it into the indicator folder and wait for it to give you an opinion to help you decide to enter a better order and in the meantime it is completely free for those who want to trad
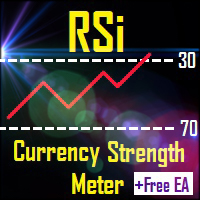
*NOTA : Sconto del 40% per i primi acquirenti! Il rilascio di EA gratuito avverrà la seconda settimana di novembre Lo sconto termina una volta disponibile l'EA GRATUITO
L'indicatore RSi è uno degli indicatori più popolari per indicare quando una determinata merce o coppia è ipercomprata o ipervenduta. Il misuratore di forza valutaria è anche un indicatore di tendenza basato su più valute. RSi Valuta Forza Meter è un indicatore grafico che ha l'algoritmo di RSi e Valuta Forza Meter. Ha anche u

ダイバージェンス はオシレーター系のテクニカル指標が、実際の相場とは逆方向に向かって動いている状態のことを指し、その後のトレンド転換の可能性を示す戦略として有効です。
このインディケータは特に有効性の高いMACDのダイバージェンスを利用した 裁量トレード用サインツールです。
高頻度かつ高い 勝率で サインを発信しますが、各種の強力なフィルターにより、さらに精度の高いサインに絞ることが出来ます。また、通常のダイバージェンスに加えリバーサル( 隠れダイバージェンス) によるサイン発信も可能です。
全通貨ペア、全タイムフレームで利用できます。勝敗判定機能により、このインディケータの直近の相場環境に対する有効性を確認できます。
設定項目は以下の通りです。 Enable Divergence...MACDのDivergenceによるサインの発信を有効にします。ピンクの矢印が表示されます Enable Reversal...MACDのReversal(Hidden Divergence)によるサインの発信を有効にします 。ブルーの矢印が表示されます Fast EMA
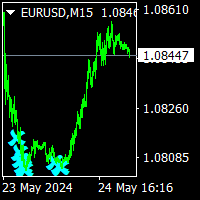
norepaint arrows indicator is a nrp indicator. never change signals or put signals back. when price up blue arrow is sell ,when price down aqua arrows are buy signals. thise indicator can use all time frames and for all pairs.. Mostly use lower timeframes. cnt value is 1000 bars. to see back signals ,cnt value can be increase if there is enough bars on charts. minimum value cnt is 500. dont use lower then 500. g value has been set to optimum value is 1. Increasing g value gives more signals.

Market Noise Il rumore del mercato è un indicatore che determina le fasi del mercato su un grafico dei prezzi e distingue anche i movimenti di tendenza chiari e fluidi dai movimenti piatti e rumorosi quando si verifica una fase di accumulazione o distribuzione. Ogni fase è adatta al proprio tipo di trading: trend per i sistemi trend-following e flat per quelli aggressivi. Quando inizia il rumore del mercato, puoi decidere di uscire dalle operazioni. Allo stesso modo, e viceversa, non appena il

Fractals Dynamic Fractals Dynamic – è un indicatore frattale gratuito modificato di Bill Williams, in cui è possibile impostare manualmente il numero di barre a sinistra e a destra, costruendo così modelli unici sul grafico. Ora tutte le strategie di trading basate o basate sull'indicatore Fractals Dynamic avranno un segnale aggiuntivo.
Inoltre, i frattali possono fungere da livelli di supporto e resistenza. E in alcune strategie di trading, mostra i livelli di liquidità. A questo scopo son
FREE
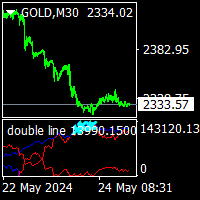
double line indicator is no repaint trend indicator. it can be use all pairs and all timeframes. it is wery ease to use.also beginner can use. it gives gold and aqua points on the double lines. aqua points is come when the prices is down. and gold points is come when the prices is on top. it can be used all time frames and all pairs. suitable for experienced and beginners traders.

Il nostro indicatore Basic Support and Resistance è la soluzione necessaria per aumentare l'analisi tecnica.Questo indicatore consente di proiettare i livelli di supporto e resistenza sul grafico/ MT5 gratuita
Funzionalità
Integrazione dei livelli di Fibonacci: Con la possibilità di visualizzare i livelli di Fibonacci insieme a livelli di supporto e resistenza, il nostro indicatore ti dà una visione ancora più profonda del comportamento del mercato e delle possibili aree di inversione.
Ott
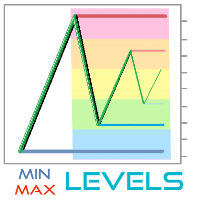
MinMax Levels MinMax Levels – è un indicatore dei livelli di prezzo massimo, minimo e di apertura per periodi di negoziazione importanti: giorno, settimana e mese.
Ogni partecipante al mercato Forex utilizza i livelli nel proprio sistema di trading. Possono essere il segnale principale per effettuare transazioni o un segnale aggiuntivo, fungendo da strumento analitico. In questo indicatore, giorni, settimane e mesi sono stati selezionati come periodi importanti, poiché sono i periodi chiav
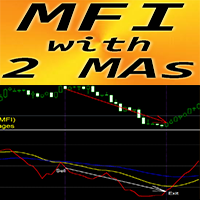
Forex Indicator "MFI and 2 Moving Averages" for MT4 M oney Flow Index (MFI) is a technical oscillator which uses price and volume data for identifying oversold and o verbought zones " MFI and 2 Moving Averages" Indicator allows you to see Fast and Slow Moving Averages of MFI oscillator Indicator gives opportunities to see the trend change very early It is very easy to set up this indicator via parameters, it can be used on any time-frame You can see Buy and Sell entry cond
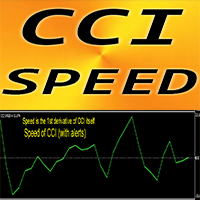
Forex Indicator " CCI Speed" for MT4 The calculation of this indicator is based on equations from physics. CCI Speed is the 1st derivative of CCI itself Commodity Channel Index (CCI) measures the difference between the current price and the historical average price
CCI Speed is good for scalping entries into the direction of main trend: u se it in combination with any suitable trend indicator CCI Speed indicator shows how fast CCI itself changes its direction - it is very sensit
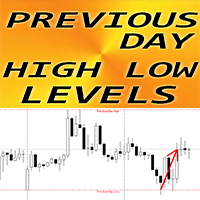
Forex Indicator "Previous Day High Low levels" for MT4 Indicator "Previous Day High Low levels" is very useful auxiliary indicator Yesterday High and Low levels are so important because price very often rebounds from them These levels can be considered as reliable Support and Resistance - price respects them very much It is useful indicator for intraday traders to who use Reversal trading methods and scalping Very good to combine with Price Action as well // More great Expert Advisors and I

Forex Indicator " ATR Trailing Stop" for MT4 Upgrade your trading methods with great auxiliary ATR Trailing Stop indicator for MT4. This indicator is perfect for Trailing Stop purpose ATR Trailing Stop is automatically adaptive to market volatility No delays and easy set up This indicator is excellent to combine with price action entries into the direction of main trend // More great Expert Advisors and Indicators are available here: https://www.mql5.com/en/users/def1380/seller //
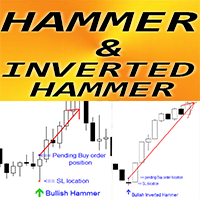
Forex Indicator " Hammer and Inverted Hammer pattern" for MT4 Indicator " Hammer and Inverted Hammer pattern " is very powerful indicator for Price Action trading : No repaint, No delays; Indicator detects bullish Inverted Hammer and Hammer patterns on chart: Bullish Inverted Hammer - Blue arrow signal on chart (see pictures) Bullish Hammer - Green arrow signal on chart (see pictures) P C, Mobile & Email alerts are included Indicator " Hammer and Inverted Hammer pattern

GAP DETECTOR
FVG in trading refers to "Fair Value Gap", . It is a concept used in technical analysis to identify areas on a price chart where there is a discrepancy or gap between supply and demand. These gaps can occur due to rapid movements in price, usually as a result of important news or economic events, and are usually filled later as the market stabilizes. The GAP DETECTOR indicator is designed to identify fair value gaps (FVG) on the price chart and filter them using volatility to det
FREE
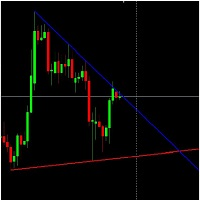
Standard Trend Lines (Automatic).
This indicator draws highly accurate trend lines.
It draws Trend Lines automatically.
This Trend Lines indicator was made by observing lot of discussions made about Trend Lines in forum.
The Trend Lines can also be used to create Expert Advisor.
Latest valid Trend Lines are drawn on Chart.
Trend Lines Work on basis of OHLC price data.
FREE

Interceptor - an arrow indicator shows potential market entry points in the form of arrows of the corresponding color: up arrows (blue) suggest opening a buy, down arrows (red) suggest selling. The appearance of arrows may be accompanied by sound signals if the sound option is enabled. It is assumed to enter on the next bar after the indicator, but there may be non-standard recommendations for each strategy. Interceptor visually “unloads” the price chart and saves analysis time: no signal - no d
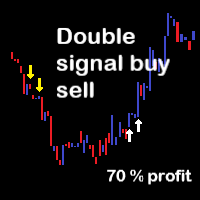
Semnal dublu cumpara vinde EURJPY EURUSD Bun venit! Indicatorul funcționează foarte bine pentru EURJPY și perechile EURUSD, în intervalul de timp H1. Reguli de intrare: Cumpărați când apare a doua săgeată albă într-un rând. Vindeți când se formează a doua săgeată galbenă consecutivă. Profitați atunci când prețul atinge suportul sau linie de rezistență. Noroc!

This indicator is the converted Metatrader 4 version of the TradingView indicator "ATR Based Trendlines - JD" by Duyck. This indicator works by automatically and continuously drawing trendlines not based exclusively on price, but also based on the volatility perceived by the ATR. So, the angle of the trendlines is determined by (a percentage of) the ATR. The angle of the trendlines follows the change in price, dictated by the ATR at the moment where the pivot point is detected. The ATR percentag
FREE
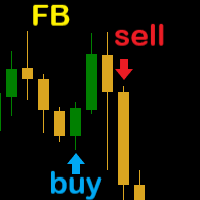
Cumpără Vinde FB Bine ați venit pe pagina noastră. Acest indicator funcționează foarte bine pentru EURJPY perechi mai întâi, apoi pentru perechea EURUSD în intervalul de timp de 60 de minute. Regulile sunt foarte simple, iar Rezultatele sunt remarcabile, după cum arată imaginile. Cumpărați când apare săgeata albastră. Vindeți când se formează săgeata galbenă. Profitați atunci când prețul atinge linie de sprijin sau rezistență. Profitați de acest indicator! Noroc!
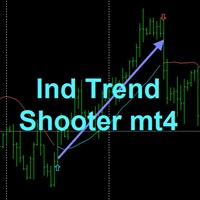
TREND SHOOTER With alerts
It is a trend indicator based on moving averages that very efficiently calculates changes in market direction.
This has the ability to anticipate changes of direction very early.
FEATURES
This indicator particularly draws two moving averages that are used only to show color changes. they can wear these moving stockings as they wish as they do not affect the color change behavior bullish blue color bearish red color where the line is interrupted it is not reco
GAP DETECTOR
FVG in trading refers to "Fair Value Gap", . It is a concept used in technical analysis to identify areas on a price chart where there is a discrepancy or gap between supply and demand. These gaps can occur due to rapid movements in price, usually as a result of important news or economic events, and are usually filled later as the market stabilizes.
The GAP DETECTOR indicator is designed to identify fair value gaps (FVG) on the price chart and filter them using volatility to d
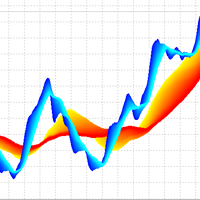
3D Trend Indicator is a non-repaint indicator using multiple moving averages with a 3D surface view. By using this indicator, you can remove uncertainties that can happen using a single and fixed moving average period. You can use a cloud area using a range of moving average periods. Also a wide range of visual settings are added to this indicator to have a better view from the cloud area. Alert and notification system added to the indicator to inform the trader about the action of candles on t

Binarias & Forex (+90% Ratio-Win Next Candle) Espere que el precio llegue a una buena zona (fuerte) sea soporte, resistencia, zona de oferta o demanda, fibonacci level key, cifra redonda. Haciendo lo anterior definitivamente habrá una reversión en el precio y obtendrá su ITM en primera vela dando una efectividad del 100% siguiendo la tendencia. Es muy importante estar atento a las noticias fundamentales en el mercado y estas no afecten tu trading. Sesiones comerciales: cualquiera (24 horas).
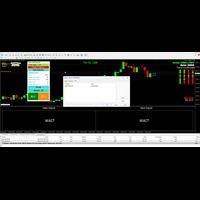
The Indicator Has signal with wait , Ready To Buy and Ready To Sell to make you ready to execute when signal coming , it very easy to use and very profitable , good for forex , Binary or crypto and GOLD , you just wait and execute , no need to analysis , because it already analysis by indicator , for exsample Wait than ready to buy or ready to sell than buy or sell you just entry as per instruction of indicator , very easy and usefull

It's a variation of mid of HH and LL since it compares the higher of HH or LL against a period and twice the number of bars back to avoid whipsaws.
I used to display this against lines on a chart, but made a histogram out of it and it looks interesting.
It looks good at gauging trend strength and general turns (see image below).
The name of the indicator is BAM, which is an acronym for "Below and Above Mid".
Ways to use it:
1. To see general trend on longer TFs (more than 60 ba

It's a variation of mid of HH and LL since it compares the higher of HH or LL against a period and twice the number of bars back to avoid whipsaws.
I used to display this against lines on a chart, but made a histogram out of it and it looks interesting.
It looks good at gauging trend strength and general turns (see image below).
The name of the indicator is BAM, which is an acronym for "Below and Above Mid".
Ways to use it:
1. To see general trend on longer TFs (more than 30 ba

ATR è un indicatore importante per qualsiasi mercato finanziario. L'abbreviazione ATR corrisponde all'acronimo di Average True Range. Questo indicatore è uno strumento per determinare la volatilità del mercato, questo è il suo ruolo diretto. ATR mostra il movimento medio del prezzo per il periodo di tempo selezionato. Il prezzo iniziale dell'indicatore è 63$. Il prezzo aumenterà ogni 10 vendite fino a 179$ . L'indicatore ATR originale è presente in molti programmi di trading. L'indicatore ATR no
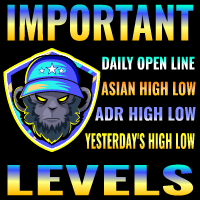
Questo indicatore ti disegnerà i seguenti livelli:
Linea aperta giornaliera: sotto è il mercato ribassista, sopra è rialzista. Intervallo medio giornaliero massimo e minimo Mercato asiatico alti e bassi Alti e bassi di ieri Questi livelli sono forti livelli di supporto e resistenza a cui tutti devono prestare attenzione.
Se non hai utilizzato il tempo per iniziare! È necessario prestare attenzione quando il prezzo è vicino a questi livelli!
Goditi il trading reso più semplice!
FREE

Graf Mason is a tool that will make you a professional analyst! The method of determining wave movements using inclined channels qualitatively conveys the schematics of the movement of any instrument, showing not only possible reversals in the market, but also the goals of further movements!Destroys the myth that the market is alive , clearly showing the schematics of movements from one range to another! A professional tool, suitable for the medium term with the definition of the current trend!
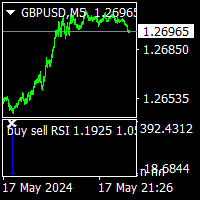
buy sell RSI is rsi version of buy sell star indicator. thise indicator no repaint and all pairs all timeframe indicator.
it need minimum 500 bars on charts. when the white x sign on the red histogram that is sell signals. when the white x sign on the blue histogram that is sell signals. this indicator does not guarantie the win.price can make mowement on direction opposite the signals. this is multi time frame indicator and need to look all time frames. sometimes after 1h buy signal ,sel

The "M1 scalping signal" is a scalping indicator designed for the M1 timeframe. The indicator displays arrows on the chart indicating price reversal points. A red arrow indicates a price reversal to a sell position, while a green arrow indicates a price reversal to a buy position. It can be used on all currency pairs. Advantages: No Redrawing: The indicator does not redraw signals on historical data, ensuring stable analysis. Ease of Use: It is easy to configure and visualizes important reversal
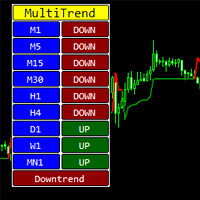
The indicator shows the direction of the trend on different timeframes.
Timeframes can be disabled in the settings.
The bottom line of the indicator reports the prevailing trend - up or down.
The indicator can be used on any trading instruments - currencies, stocks, futures, indices, metals, cryptocurrencies.
This indicator can be used as an independent trading system or as an addition to another system.

Precision Trend Signals is an indicator that shows price reversal points on the chart using arrows. A green arrow indicates when the price will reverse upward, and a red arrow indicates when the price will reverse downward. The indicator can be used on any timeframes and any currency pairs. Trading Strategy with this Indicator: Green Arrow : When a green arrow appears, close any previously opened (if any) sell position and open a buy position. Red Arrow : When a red arrow appears, close any prev

Best strategy,
Easy trade ,
Support of version update in the future MT My Way: Why are there fewer successful traders than failed traders????? The idea of this indicator is that at the point of opening an order,
if you ask other traders, they will trade on the opposite side. So you trade opposite other trader and (Hidden message: It is making profit along with the broker.) (^_^) (^-^) (^ ^) (^.^) "Trade opposite to others, You will win"
If this idea is true, You may not wan
123456789101112131415161718192021222324252627282930313233343536373839404142434445464748495051525354555657585960616263646566676869707172737475767778798081828384858687888990919293949596979899100101102103104105106107108109110111112113114115116117118119120121122123124125126127128129130131132133134135136137138
MetaTrader Market - i robot di trading e gli indicatori tecnici per trader sono disponibili nel tuo terminale di trading.
Il sistema di pagamento MQL5.community è disponibile per tutti gli utenti registrati sul sito MQL5.com che effettuano transazioni su MetaTrader Services. Puoi depositare e prelevare denaro usando WebMoney, PayPal o una carta di credito.
Ti stai perdendo delle opportunità di trading:
- App di trading gratuite
- Oltre 8.000 segnali per il copy trading
- Notizie economiche per esplorare i mercati finanziari
Registrazione
Accedi
Se non hai un account, registrati
Consenti l'uso dei cookie per accedere al sito MQL5.com.
Abilita le impostazioni necessarie nel browser, altrimenti non sarà possibile accedere.