Regardez les tutoriels vidéo de Market sur YouTube
Comment acheter un robot de trading ou un indicateur
Exécutez votre EA sur
hébergement virtuel
hébergement virtuel
Test un indicateur/robot de trading avant d'acheter
Vous voulez gagner de l'argent sur Market ?
Comment présenter un produit pour qu'il se vende bien
Indicateurs techniques pour MetaTrader 5 - 10

The balance of supply and demand is a simple and effective market analysis method. The supply and demand diagram can show you in advance, even before the trend reversal, where the supply ends and the demand is already emerging, where the demand ends and the supply is emerging, while substantially increasing the probability of making a deal in the right direction and with a high profit factor.
Indicator signals The indicator uses the price/volume values to generate signals: ED – excess demand.
This indicator is unstoppable when combined with our other indicator called Katana . After purchase, send us a message and you could get Katana for FREE as a BONUS!
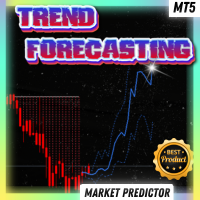
PROMO FOR THE MT5 version: $55 for a very limited time! Next price is $105. The Trend Forecasting indicator is a very unique & easy tool that is able to make prediction about future price movement based on the signals generated by MACD. It helps you have an estimation on the areas that the price may develop in
This indicator informs the user when the ATR is above a certain value defined by the user, as well as when the ATR prints a percentage increase or percentage decrease in its value, in order to offer the user information about the occurrence of spikes or drops in volatility which can be widely used within volatility-based trading systems or, especially, in Recovery Zone or Grid Hedge systems. Furthermore, as the volatility aspect is extremely determining for the success rate of any system based o
FREE

For those traders who really care about Volume as an important vector information on Price Action, here is an exclusive idea & creation from Minions Labs: Volume Speed . The Volume Speed indicator shows you visually how much time (in seconds, minutes, hours, you choose) the Volume took to reach the Average Volume of the past bars. This way you can have the exact idea of "what is happening right now with the Volume of the current bar..." and take action accordingly with your strategy, having even

Setup Tabajara was created by a Brazilian trader known as "The OGRO of Wall Street" .
The idea of this setup is to indicate to the trader the current trend of prices and the type of operation should be looked for in the graph.
Operation
It does this through the relation of the closing price position and the of 20 periods, by painting the candles in 4 possible colors : Green -> Price rising in upward trend (Search entry points for PURCHASE) Black -> Price correcting in Bullish Trend
FREE

Cet indicateur est une méthode d'analyse de marché basée sur l'article "Formule mathématique pour les prédictions de marché" écrit par W.D. Gann en fonction du carré de neuf et du carré de 144 méthodes.
Manuel de l'Utilisateur: Add Your review And contact us to get it
Vous pouvez acheter la version complète MT4 à partir de :
https://www.mql5.com/en/market/product/15316
Vous pouvez tester gratuitement sur MT4 :
https://www.mql5.com/en/market/product/15320?source=Site +Profile+Seller#!t

The market price usually falls between the borders of the channel .
If the price is out of range, it is a trading signal or trading opportunity.
Basically, Fit Channel can be used to help determine overbought and oversold conditions in the market. When the market price is close to the upper limit, the market is considered overbought (sell zone). Conversely, when the market price is close to the bottom range, the market is considered oversold (buy zone).
However, the research can be used

User Support
Paid subscribers may request to join the WTGS Workshop @DB_WTI after emailing your Twitter handle and the proof of subscription to wtg.system.international@gmail.com . The System WTGS Navigator Saturn consists of six components: TrendFinder Saturn: Internal Trending Confirmation Titan: Internal Trending Indicator Outer Ring: External Trending Indicator Inner Ring: External Trending Confirmation Data: The time-lapse of a trend on any given timeframe Disclaimers Although every

User Support
Paid subscribers may request to join the WTGS Workshop @DB_WTI after emailing your Twitter handle and the proof of subscription to wtg.system.international@gmail.com . The System WTGS Navigator Overlay consists of two components: Dynamic Butterfly Footprints Overlay Disclaimers Although every effort has been made when designing WTGS Navigator Overlay, WTG makes no warranties, expressed or implied, or representations as to the accuracy or profitability of the system. WTG assume

Automatic fibonacci with alerts is an indicator that automatically plots a fibonacci retracement based on the number of bars you select on the BarsToScan setting in the indicator. The fibonacci is automatically updated in real time as new highest and lowest values appear amongst the selected bars. You can select which level values to be displayed in the indicator settings. You can also select the color of the levels thus enabling the trader to be able to attach the indicator several times with d

MACD (short for M oving A verage C onvergence/ D ivergence) is a popular trading indicator used in technical analysis of securities prices. It is designed to identify changes in the strength, direction, momentum, and duration of a trend in a security's price.
History Gerald Appel created the MACD line in the late 1970s. Thomas Aspray added the histogram feature to Appel's MACD in 1986.
The three major components and their formula 1. The MACD line: First, "PM Colored MACD" employs two

"The trend is your friend" is one of the oldest and best-known sayings in financial markets. However, this message only represents half of the picture. The correct saying should be, "The trend is your friend only until it ends." KT Trend Filter solves this problem by clearly indicating the start of an Uptrend and Downtrend using an averaging equation on the price series. If the trend direction is not clear, it shows the trend as sideways showing the uncertainty in the market.
Features
Get a

An indicator to draw a graph of account current and historical state such as Balance, Equity, Margin, Free Margin, Margin Level, Drawdown, Account Profit, Deposit and Withdrawals.
Indicator Inputs : Draw Balance Graph Draw Equity Graph Draw Margin Graph Draw Free Margin Graph Draw Margin Level Graph Draw Drawdown Graph Draw Account Profit Graph Hide Data on Chart and Buffers Connect Gaps by Lines Sign of DDs on Profit Sign of DDs on Loss
Tips : The Indicator will draw historical balance gra

KT Coppock Curve is a modified version of the original Coppock curve published in Barron's Magazine by Edwin Coppock in 1962. The Coppock curve is a price momentum indicator used to identify the market's more prominent up and down movements.
Features
It comes with up & down arrows signifying the zero line crossovers in both directions. It uses a simplified color scheme to represent the Coppock curve in a better way. It comes with all kinds of Metatrader alerts.
Applications It can provide

KT Auto Fibo draws Fibonacci retracement levels based on the ongoing trend direction. The Highs and Lows are automatically selected using the Maximum and Minimum points available on the chart. You can zoom in/out and scroll to adjust the Fibonacci levels accordingly.
Modes
Auto: It draws the Fibonacci levels automatically based on the chart area. Manual: It draws the Fibonacci levels only one time. After that, you can change the anchor points manually.
Usage: Helps to predict the future p

Adaptive Moving Average (AMA) is a trend indicator using moving average and market noise filter. Indicator feature are blue and red points, showing the power of trend. Recommendations for trading: Auxiliary Indicator Detecting trend Detecting power of trend Detecting potential reversal points Main indicator Shows entry points for swing trading Serves as dynamic support and resistance Recommendations for use: Any instrument Any timeframe Input parameters: Period - AMA period Fast Period - fast MA
FREE

The Candle Countdown Timer for MetaTrader 4 (also available for MT5) is a vital indicator designed to help you manage your trading time effectively. It keeps you updated about market open and close times by displaying the remaining time before the current candle closes and a new one forms. This powerful tool enables you to make well-informed trading decisions. Key Features: Asia Range: Comes with an option to extend the range. Broker Time, New York, London Time: Displays the current broker time
FREE

MT4 Version MA Ribbon MT5 MA Ribbon is an enhanced indicator with 8 moving averages of increasing periods. MA Ribbon is useful to recognize trend direction, reversals and continuation points in the market as well as potential entry, partial take profit and exit points. Entry points for long and shorts position can be found when the price entries or leaves the Ribbon, at retest or a defined number of MA crossovers. It offers a good combination with mostly any volume or momentun indicators to
FREE

Daily session open lines shows the traders three important trading session opens. By default it is set up to show you: Zero GMT Open Line London Open Session Line New York Open Session Line The default times are set according to GMT+2 and as such you are able to change and customise according to your specific time zone. The Indicator is usefull specially for the trader who trades the London and NewYork sessions.
FREE

The OHLC indicator shows the current and historical values of High, Low, Open, Close and Mid for a specific time period. It can plot the current values or the values from the previous session. The indicator's range can be calculated from a daily, weekly, monthly, or user-specified session.
Levels High of the current or previous session. Low of the current or previous session. Open of current or previous session. Close of the current or previous session. Midpoint of the current or pre
FREE

Combination of Ichimoku and Super Trend indicators. 1. ARC (Average Range times Constant) The concept of ARC or Volatility System was introduced by Welles Wilder Jr. in his 1978 book, New Concepts in Technical Trading Systems . It has since been adapted and modified into the popular Super Trend indicator.
The fundamental idea behind ARC is simple: to identify support and resistance levels, you multiply a constant with the Average True Range (ATR) . Then, you either subtract or add the resultin
FREE

Savoir où sont les niveaux importants comme les plus hauts et bas du jours précédent ou de la semaine permettent une meilleur prise de setup de trading.
Cet indicateur permet d'afficher Haut et bas du jour précédent Haut et bas de la semaine précédente
Congifuration High & Low for: Previous day, week Line Style, color Label position, size, color Questions, commentaires, envoyez moi un message en direct ici: https://www.mql5.com/en/users/mvonline
FREE

Simple Super Trend indicator for MetaTrader 5. A trend indicator similar to moving averages. Use it for entry and exit signals. It gives accurate signals on precise time. Works as a Trailing SL/TP. This indicator can also be used on multiple timeframes where you place it on a larger timeframe then go to a lower timeframe. Super Trend needs to be used in conjunction with other indicators like rsi, Parabolic SAR, MACD, etc to receive filtered signals.
FREE

Descubre el poderoso aliado que te guiará en el laberinto de los mercados financieros. Este indicador revolucionario te llevará de la incertidumbre a la claridad, permitiéndote identificar con precisión los puntos de inflexión del mercado. Mejora tus decisiones de entrada y salida, optimiza tus operaciones y ¡multiplica tus ganancias con confianza.
Ahora con alertas en tu pc o móvil
¡Para más información, te invitamos a unirte a nuestro canal de Telegram en https://t.me/Profit_Evolution ¡
FREE

Highly configurable Stochastic indicator.
Features: Highly customizable alert functions (at levels, crosses, direction changes via email, push, sound, popup) Multi timeframe ability Color customization (at levels, crosses, direction changes) Linear interpolation and histogram mode options Works on strategy tester in multi timeframe mode (at weekend without ticks also) Adjustable Levels Parameters:
Stochastic Timeframe: You can set the lower/higher timeframes for Stochastic. Stochastic Bar
FREE

The Multi Asset Monitor Panel is a game-changer for traders who need to keep an eye on multiple markets simultaneously. This innovative panel allows you to monitor any symbol and any timeframe you need, all within a single, organized interface. With up to three lists of symbols and customizable MT5 templates, you can tailor your monitoring setup to fit your specific trading strategy. What sets the Multi Asset Monitor Panel apart is its flexibility and customization options. You can control the s

Divergence and Convergence are important harbingers of reversals in stock markets.
The Divergence Sync indicator is designed to automatically search for divergences on a large number of indicators with different parameters.
The search for divergences is carried out on these indicators: (CCI, CHO, DeMarker, MACD, MFI, Momentum, OBV, OsMA, RSI, Stochastic, WPR, Awesome Oscillator ).
To search for divergences, you can use one technical indicator or search simultaneously on any number of ind

Tabajara Rules for MT5 , baseado em Setup Tabajara do professor André Machado, indica a direção do mercado com base em médias móveis quando tem velas na mesma direção da média móvel.
O indicador contém a regra de coloração aplicada aos candles e a média móvel.
O indicador permite a alteração dos parâmetros: período e método de suavização da média móvel.
O indicador permite a alteração das cores dos candles ( contornos e preenchimento) e da média móvel.
O modelo do professor André Machado c
FREE

You get a moving average indicator with different methods (exponential, linear, smoothed and linear weighted) calculated on smooth Heikin Ashi candles included in 'Examples' folder of Meta Trader 5. This program is dedicated for everyone trader in the market who is collecting necessary indicators designed for work with reduced market noise to better identify trends and buy opportunity.
FREE

The Chart Overlay indicator displays the price action of several instruments on the same chart allowing you to evaluate how differently currency pairs fluctuate relative to each other. [ Installation Guide | Update Guide | Troubleshooting | FAQ | All Products ]
Find overbought or oversold currency pairs easily Plot up to six currency pairs overlayed on the same chart Display inverted symbols if necessary Adapt to chart size, zoom and timeframe Automatic price level calculation Customizable p
FREE

Time Range Separator is a useful tool to display a separator period on your platform.
You could go in the properties of the indicator, select the desired range and that's ALL. We believe it is a useful and necessary that we wish to share with you for free all our followers. Input Values: TimeFrame = Period Separator Separator_Color = Vertical Color Line Separator_Style = Vertical Color Style Separator_Width = Vertical Line Width Good trading to all and see you soon. Same indicator for MT4 her
FREE

Highly configurable Macd indicator.
Features: Highly customizable alert functions (at levels, crosses, direction changes via email, push, sound, popup) Multi timeframe ability Color customization (at levels, crosses, direction changes) Linear interpolation and histogram mode options Works on strategy tester in multi timeframe mode (at weekend without ticks also) Adjustable Levels Parameters:
Stochastic RSI Timeframe: You can set the lower/higher timeframes for Stochastic RSI. Stochastic RSI
FREE

Description: Strategy based around Open-Close Crossovers. Setup: I have generally found that setting the strategy resolution to 3-4x that of the chart you are viewing tends to yield the best results, regardless of which MA option you may choose (if any) BUT can cause a lot of false positives - be aware of this. Don't aim for perfection. Just aim to get a reasonably snug fit with the O-C band, with good runs of green && red. Option to either use basic open && close series data or pick your pois
FREE

L'indicateur Accurate Gold est un outil convivial, à la fois intuitif et simple à utiliser, quel que soit le niveau d'expérience des traders. Il est conçu pour les traders à la recherche de signaux précis sur le laps de temps M5 sur le marché de l'or. Cet indicateur utilise des algorithmes mathématiques avancés pour analyser les mouvements de prix et la dynamique du volume, générant ainsi des signaux d'achat et de vente précis. Les caractéristiques distinctives de cet indicateur, notamment s

Rejoignez le Canal Koala Trading Solution dans la communauté MQL5 pour découvrir les derniers signaux, les actualités sur tous les produits Koala. Le lien d'adhésion est ci-dessous : https://www.mql5.com/en/channels/koalatradingsolution Bienvenue sur l'indicateur de niveaux BTC Koala Indicateur de niveaux BTC Koala Cet indicateur est conçu pour ceux qui aiment acheter du BTC. Comme vous le savez, le BTC a été l'un des meilleurs objets d'investissement ces dernières années et continue de l'êtr
FREE

The ICT Concepts indicator regroups core concepts highlighted by trader and educator "The Inner Circle Trader" (ICT) into an all-in-one toolkit. Features include Market Structure (MSS & BOS), Order Blocks, Imbalances, Buyside/Sellside Liquidity, Displacements, ICT Killzones, and New Week/Day Opening Gaps. It’s one kind of Smart money concepts. USAGE: Please read this document ! DETAILS Market Structure Market structure labels are constructed from price breaking a prior extreme point. T

This is a simple trend strenght indicator that is based on 5 moving averages on five diferente timeframes. As for now, the end user has no access to the SMA configurations but ill implement that on the future.
This indicator has 7 diferents trend indexes they are. Strong bearish, bearish, slighly bearish, normal, slighly bullish, bullish and strong bullish. You can change the gauge colors to better fit your taste and the chart background.
FREE

VWAP, or volume-weighted average price, helps traders and investors observe the average price that major traders consider the "fair price" for that move. VWAP is used by many institutions to set up large operations.
In this indicator, you can enjoy the following features:
Daily VWAP, with option to display your current price next to the chart VWAP Weekly, with option to display your current price next to the chart Monthly VWAP, with option to display your current price next to the chart
FREE

A useful dashboard that shows the RSI values for multiple symbols and Time-frames. It can be easily hidden/displayed with a simple click on the X top left of the dashboard. You can input upper and lower RSI values and the colours can be set to show when above/below these values. The default values are 70 and 30. You can choose whether the dashboard is displayed on the right or left of the chart. If you want to have 2 dashboards on the same chart you must input a different name for each. The sca
FREE

We often need to know the sudden change in trend that happens on the graph and this can be confirmed through indicators.
This indicator shows the moments of trend reversal and how in which trend the price is shifting.
Custom background, no need to configure the colors in the chart, just drag the indicator!
Indication with arrows.
- Blue arrow: Upward trend.
- Pink Arrow: Downward Trend.
NOTE: Free indicator, support may take a while to respond.
FREE

Ichimoku Kinko Hyo is a purpose-built trend trading charting system that has been successfully used in nearly every tradable market. It is unique in many ways, but its primary strength is its use of multiple data points to give the trader a deeper, more comprehensive view into price action. This deeper view, and the fact that Ichimoku is a very visual system, enables the trader to quickly discern and filter "at a glance" the low-probability trading setups from those of higher probability. This i
FREE

Aggression Volume Indicator is the kind of indicator that is rarely found in the MQL5 community because it is not based on the standard Volume data provided by the Metatrader 5 platform. It requires the scrutiny of all traffic Ticks requested on the platform... That said, Aggression Volume indicator requests all Tick Data from your Broker and processes it to build a very special version of a Volume Indicator, where Buyers and Sellers aggressions are plotted in a form of Histogram. Additionally,
FREE

Ultron Candle Timer
Used for any timeframe to keep track of time remaining on current candle. User can change inputs and colors. Never wonder again about the time remaining until the next candle. Will work on any market and any chart. Adjust the color to blend in with any of your current chart template. Its a very simple and easy to use indicator but it comes in handy
FREE

Le comportement des différentes paires de devises est interconnecté. L'indicateur Visual Correlation vous permet d'afficher différents instruments sur 1 graphique tout en conservant l'échelle. Vous pouvez définir une corrélation positive, négative ou aucune.
Certains instruments commencent à bouger plus tôt que d'autres. Ces moments peuvent être déterminés en superposant des graphiques.
Pour afficher un instrument sur un graphique, vous devez saisir son nom dans le champ Symbole. Versio
FREE

The MACD 2 Line Indicator is a powerful, upgraded version of the classic Moving Average Convergence Divergence (MACD) indicator.
This tool is the embodiment of versatility and functionality, capable of delivering comprehensive market insights to both beginner and advanced traders. The MACD 2 Line Indicator for MQL4 offers a dynamic perspective of market momentum and direction, through clear, visually compelling charts and real-time analysis.
Metatrader4 Version | How-to Install Product | How
FREE

TransitTrendlines this is a automatically trendline drawer, it draw both horizontal and diagonal trendlines. The horizontal trendlines are the pivot points of the day timeframe and the diagonal trendlines are based on the current time frames. You can adjust the diagonal trendlines by increasing the number of bars to draw the diagonal trendline and can also adjust the steepness. Note that the Horizontal trendlines are based on the day pivot points not currant time frame. Join mql5 transitbk98 cha
FREE

Moving Average Convergence/Divergence — схождение/расхождение скользящих средних — технический индикатор, разработанный Джеральдом Аппелем (Gerald Appel), используемый в техническом анализе для проверки силы и направления тренда, а также определения разворотных точек. Встроенный в MetaTrader 5 индикатор MACD не соответствует задумке автора (Gerald Appel):
-линия MACD графически изображена в виде гистограммы, однако гистограммой отражается разница между линией MACD и сигнальной линией;
-сигнал
FREE

This Supertrend strategy will allow you to enter a long or short from a supertrend trend change. Both ATR period and ATR multiplier are adjustable. If you check off "Change ATR Calculation Method" it will base the calculation off the S MA and give you slightly different results, which may work better depending on the asset. Be sure to enter slippage and commission into the properties to give you realistic results. If you want automatic trade with Supertrend indicator, please buy following pr
FREE

The Indicator show Daily Pivot Points. It is possible to specify the number of days to display. For forex it doesn't consider the sunday session data. It is possibile to modify the color, style and width for every level. It is better to use this indicator with timeframe not higher than Н1. 4 Levels of support and resistance with also Intermediate Levels that is possible to hide.
FREE

It makes it easier for you to trade by providing trend charts in all frames from bottom to top. If it touches the upward trend, it is a good opportunity to sell, and the target is the downward trend, and vice versa. If it touches the downward trend, it is a good opportunity to buy, and the target is the upward trend. It can automatically redraw the trend. You can monitor higher frames and trade on lower frames for speculation .

九转序列,源自于TD序列,是因TD序列的9天收盘价研判标准而得名。 汤姆·德马克(Tom DeMark)技术分析界的着名大师级人物,创建了以其名字首字母命名的TD系列的很多指标,价格反转的这个指标就是其中重要的一个,即TD序列。 德马克原版TD序列指标要复杂一些,想研究就自行看关于德马克的资料吧。这里只说简单的TD序列(九转序列)。 九转序列分为两种结构,低九买入结构和高九卖出结构。 TD高九卖出结构:连续出现的九根K线,这些K线的收盘价都比各自前面的第四根K线的收盘价高, 如果满足条件,就在各K线上方标记相应的数字,最后1根就标记为9,如果条件不满足,则K线计数中断,原计数作废重新来数K线。如出现高9,则股价大概率会出现转折。 TD低九买入结构:连续出现的九根K线,这些K线的收盘价都比各自前面的第四根K线的收盘价低,如果满足条件,就在各K线下方标记相应的数字,最后1根就标记为9,如果条件不满足,则K线计数中断,原计数作废重新来数K线。如出现低9,则股价大概率会出现转折。
结构的本质是时间和空间的组合,时间是横轴,空间是纵轴,不同的时间周期和空间大小的组合,形成不同的结构形态,不同

US30 Ninja is a 5 minute scalping indicator that will let know you when there is a trade set up (buy or sell). Once the indicator gives the trade direction, you can open a trade and use a 30 pip stop loss and a 30 pip to 50 pip take profit. Please trade at own own risk. This indicator has been created solely for the US30 market and may not yield positive results on any other pair.

A useful scanner/dashboard that shows the RSI values for multiple symbols and Time-frames. It can be easily hidden/displayed with a simple click on the scanner man top left of the dashboard. You can input upper and lower RSI values and the colours can be set to show when above/below these values. The default values are 70 and 30. There are also input colours for when the RSI is above or below 50 (but not exceeding the upper/lower levels
Symbols and time-frames are input separated by commas.
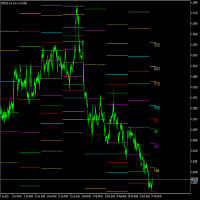
Fibonacci Pivots is a multi-timeframe indicator with custom alerts, designed to help traders easily identify key levels of support and resistance on any financial instrument. This advanced indicator uses the popular Fibonacci sequence to calculate pivot points based on the specified timeframe, depth, and backstep parameters. It also comes with customizable alerts. You can choose to be alerted when the price crosses any of the pivot points or when the price is within a specified frequency and pi
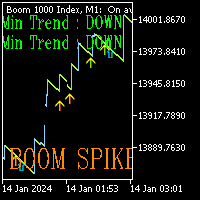
Boom Spike mater is the future for trading Boom markets. It has been designed to run on Boom 300 , 500 and 1000 markets on the 1 minute timeframe. It has 2 different trading modes (Aggressive and Normal) Aggressive mode will plot Yellow and blue arrows. 2 different conditions to help you make the right choice. Enter first trade on yellow arrow and second trade on blue candle. SL in this mode will be 10 Candles from the blue arrow. Normal mode will only plot red arrows on the chart. This mode is
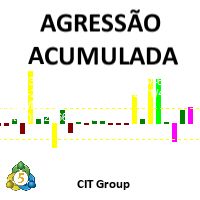
Apresentação:
- O Indicador "Agressão Acumulada" da CIT Group é um indicador especializado na bolsa brasileira (B3).
Objetivo:
- Especificamente desenvolvido para o perfil de pessoas que operam IntraDay.
Funcionamento:
- Calculado com base nos trades realizados durante o pregão, sendo atualizado a cada 1 segundo, tendo maior precisão da agressão
Funcionalidades:
- Entrega de um conjunto de parâmetros para calcular a média de agressão (Volume ou Quantidade), estes podendo

O LIVRO VISUAL é uma ferramenta que auxilia na identificação de escoras e renovação de ordens, para quem opera Tape Reading ou fluxo no gráfico é uma excelente ferramenta. Porem ele funciona somente em Mercados Centralizados ou com profundidade nível 2. É de fundamental importância você saber que ele não funciona em Mercado de FOREX. Porem pode ser utilizado no Mercado da B3.
The Donchian Channel Indicator helps to identyfy the market trend and the breakouts of the channel. Breaking above means the momentum of the market is highly bullish. Breaking below means the momentum of the market is highly bearish.
SETTINGS: PERIOD - default value 20. The number of last candles beeing taken into account when generating the line. OFFSET - default value 0. The percentage number that makes the channel bigger or smaller. LINE_COLOR - default color is set Blue. Here you can set w

RaysFX (Average Directional Movement Index)
Technical indicator (ADX) helps to determine the market trend. It was developed and described in detail by Welles Wilder.
The simplest trading method based on the system of directional movement implies comparison of two direction indicators: the 14-period +DI one and the 14-period -DI.
To do this, one either puts the charts of indicators one on top of the other, or +DI is subtracted from -DI.
W. Wilder recommends buying whenever the +DI crosses ab

Tick Speed Pro povides a charted record of tick speed to allow you to see the ebb and flow of market activity. Observing patterns in tick speed may allow you to better time entries to reduce slippage and re-quotes.
The tick speed plot updates it's entire position to show you only the last N seconds you choose, ideal for scalping and HFT approaches. An alert is provided to signal when the instrument is getting ticks at a higher rate than the alert limit. Multiple loadings are supported to compar

A flexible 2-Line MACD indicator The default MACD indicator inside MT4, limits you to using the MACD with a fast-EMA, slow-EMA. This MACD indicator allows you to set your own MA-Method choices for these 2 components, separately! You can select from SMA, EMA, SMMA, LWMA, ADAPTIVE MA, FRACTAL MA, DEMA, TEMA, VARIABLE INDEX DYNAMIC MA, and can even use a separate method for each 2 fast-slow. The signal line has options from SMA-EMA-SMMA-LWMA. On-chart colored candles, with drawing condition types i

** NOTE: This indicator uses realtime data. Thus DO NOT download Demo version. If you still need demo version, please refer to free version .
Symbol Chart Changer is an indicator/utility that offers you the option to switch between symbols and timeframes.
You can choose any symbol and timeframe on the same chart with just a few clicks. In addition, this indicator also shows the profit of the symbol through the color of the buttons.
Features: Click buttons on the chart to monitor all your
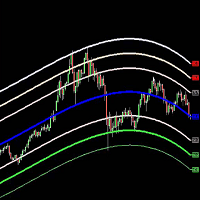
The Belkhayate center of gravity indicator is best used to confirm major turning points, and distinguish price extremes. Generally if price reaches the upper or lower levels one should expect a turn around coming soon, or at least a pull back towards the centre line if there is a strong trend. The upper and lower levels are red and green lines.
Our indicator use the same parameters as the well known trader M.Mostafa Belkhayate the inventor of the indicator, allow the use of buffers for your EA

The Bollinger Bands indicator drawn using a tick chart. After launching it, wait for enough ticks to come. Parameters: Period - period of averaging. Deviation - deviation from the main line. Price levels count - number of displayed price levels (no levels are displayed if set to 0). Bar under calculation - number of bars on the chart for the indicator calculation. Buffer indexes: 0 - BASE_LINE, 1 - UPPER_BAND, 2 - LOWER_BAND, 3 - BID, 4 - ASK.

Color Levels - удобный инструмент для тех, кто использует технический анализ с использованием таких инструментов, как Трендовая линия и Прямоугольник. Имеется возможность настройки двух пустых прямоугольников, трех закрашенных и двух трендовых линий. Настройки индикатора крайне просты и делятся на пронумерованные блоки: С цифрами 1 и 2 вначале - настройки пустых прямоугольников (рамок); С цифрами 3, 4 и 5 - настройки закрашенных прямоугольников; С цифрами 6 и 7 - настройки трендовых линий. Объ

Découvrez la puissance de l'indicateur Demark Trends pour une analyse complète des tendances et des perspectives de trading. Les indicateurs Demark sont réputés pour leur efficacité dans l'évaluation des tendances du marché et des points d'épuisement. Notre indicateur Demark Trends élève cette expertise à un niveau supérieur en traçant automatiquement des lignes de tendance précises sur vos graphiques. Avec des paramètres personnalisables, tels que le nombre de bougies dans les calculs, les régl
FREE

KT OBV Divergence shows the regular and hidden divergences build between the price and OBV - On Balance Volume oscillator.
Features
Unsymmetrical divergences are discarded for better accuracy and lesser clutter. Support trading strategies for trend reversal and trend continuation. Fully compatible and ready to embed in an Expert Advisor. Can be used for entries as well as for exits. All Metatrader alerts are available.
What is a Divergence exactly?
In the context of technical analysis, i

Introducing the revolutionary ICT Silver Bullet Strategy Indicator for MT5, a groundbreaking tool designed to usher in a new era of trading for beginners and experienced traders alike. This advanced indicator seamlessly translates the intricate ICT Silver Bullet strategy into a simplified visual representation on your charts, offering not just comprehension but a path to profitable trading. A Strategy Simplified: Navigating the complexities of the ICT Silver Bullet strategy has never been easie

Call/Put Ratio is one of the most well-known indicators of the market sentiment. The indicator has been developed by Martin Zweig. It is based on real volumes of the CBOE option market. As we know, a Call option gives its owner the right to buy the underlying asset at a predetermined price. A Put option gives the right to sell it. Thus, increasing volumes for Call options indicate the increasing demand. The growth of Put option volumes shows that supply starts exceeding demand. If we divide the
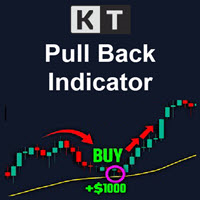
The KT Pull Back Arrows shows the pull back arrows using the RSI (Relative Strength Index) to identify suitable pull-back entry areas within the overbought and oversold zones. The indicator effectively pinpoints favorable moments for initiating pull-back trades by leveraging these RSI thresholds. Trend trading is often considered the most profitable strategy in the Forex market. It is the equivalent of riding the wave, going with the flow, and capitalizing on market momentum. However, timing is
Savez-vous pourquoi MetaTrader Market est le meilleur endroit pour vendre des stratégies de trading et des indicateurs techniques ? Pas besoin de publicité ou de protection logicielle, pas de problèmes de paiement. Tout est fourni dans le MetaTrader Market.
Vous manquez des opportunités de trading :
- Applications de trading gratuites
- Plus de 8 000 signaux à copier
- Actualités économiques pour explorer les marchés financiers
Inscription
Se connecter
Si vous n'avez pas de compte, veuillez vous inscrire
Autorisez l'utilisation de cookies pour vous connecter au site Web MQL5.com.
Veuillez activer les paramètres nécessaires dans votre navigateur, sinon vous ne pourrez pas vous connecter.