Regardez les tutoriels vidéo de Market sur YouTube
Comment acheter un robot de trading ou un indicateur
Exécutez votre EA sur
hébergement virtuel
hébergement virtuel
Test un indicateur/robot de trading avant d'acheter
Vous voulez gagner de l'argent sur Market ?
Comment présenter un produit pour qu'il se vende bien
Indicateurs techniques pour MetaTrader 5 - 79

PMax is a brand new indicator developed by KivancOzbilgic in earlier 2020.
It's a combination of two trailing stop loss indicators;
One is Anıl Özekşi's MOST (Moving Stop Loss) Indicator and the other one is well known ATR based SuperTrend. Both MOST and SuperTrend Indicators are very good at trend following systems but conversely their performance is not bright in sideways market conditions like most of the other indicators.
Profit Maximizer - PMax tries to solve this problem. PMax

The Fat and Slim indicator tracks strong and weak money in the market. It is derived from RSI, MFI and many similar indicators. Input values are closing prices and volumes. The RSI (yellow curve) is in the range -100 ... 100. It is additionally multiplied by a coefficient so that the curve is not compressed to the middle values at higher periods (a problem with the classic RSI with different periods). Strong/Fat red curve is RSI weighted by higher volumes. Weak/Slim blue curve is calculated so t
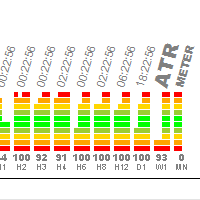
L'indicateur est conçu pour identifier rapidement la volatilité sur un instrument. Il est très pratique de changer les graphiques pour comprendre immédiatement sur quels instruments et périodes de temps il y a un commerce rapide, et où il y a une accalmie. L'indicateur utilise les données de l'indicateur ATR traduites en pourcentages. Si vous appliquez l'ATR sur le graphique, environ 100-300 barres seront visibles à l'écran, j'ai fait la moyenne de cette valeur et la valeur par défaut est 150 (

Suivez la tendance. Oui, attendez un signal d'entrée, que ce soit pour un achat ou une vente, et entrez avec le prix, et le profit est pris lorsque la ligne de dessin change, le profit est comptabilisé ou lorsqu'un signal opposé apparaît. C'est très simple et cela fonctionne sur tous. devises, métaux, indices et sur tous les supports. Comment entrer? Attendez un signal d'achat ou de vente et entrez avec lui. Vous pouvez prendre ou réserver un bénéfice après l'apparition d'un changement dans
>>> BIG SALE PROMOTION: 50% OFF + GIFT EA! - Promo price: $64 / Regular price $129 <<< - The promotion will end soon!
The Forex Trend Tracker is an advanced tool designed to enhance the trading capabilities of forex traders. This sophisticated indicator uses complex mathematical formulas alongside the Average True Range (ATR) to detect the beginnings of new upward and downward trends in the forex market. It offers visual cues and real-time alerts to give traders a competitive advantage in th

Volume plays a crucial role in trading, serving as a key indicator of market activity and investor sentiment. Here are some important roles of volume in trading:
Confirming trends: Dow Theory emphasizes the importance of volume in determining market trends. Larger volume usually indicates greater disagreement between bulls and bears, while smaller volume may indicate higher market agreement with the current price. Capturing institutional moves: By analyzing volume over a period of time, one c

Overview
In the evolving landscape of trading and investment, the demand for sophisticated and reliable tools is ever-growing. The AI Trend Navigator is an indicator designed to meet this demand, providing valuable insights into market trends and potential future price movements. The AI Trend Navigator indicator is designed to predict market trends using the k-Nearest Neighbors (KNN) classifier.
By intelligently analyzing recent price actions and emphasizing similar values, it help

The Boom300 Spike Indicator is a powerful tool designed to identify significant price spikes in the market.
Key Features: Real-time Spike Detection: The indicator continuously scans the market for sudden spikes in price action, providing timely alerts when significant spikes occur. Customizable Alerts: Traders can customize alerts to suit their preferences, including audible alerts, email notifications, and push notifications to mobile devices. User-Friendly Interface: The indicator offers a

Description: The Spike Sniper Crash Market Indicator is a sophisticated tool designed to identify and navigate volatile market conditions, often associated with sudden price spikes and market crashes. Leveraging advanced algorithms and technical analysis, this indicator serves as a vigilant guardian, alerting traders to potential market disruptions and providing actionable insights to mitigate risks and capitalize on opportunities. Key Features: Precision Spike Detection: The indicator employs c

The indicator determines the ATR value (points) in a classic way (taking into calculation paranormal bars/candles) and more correctly - ignoring paranormal movements of the Instrument. Correctly it is excluding paranormal bars from the calculation, extremely small bars (less than 5%( customizable ) of the standard ATR) and extremely large bars (more than 150% ( customizable ) of the standard ATR) are ignored. This is a Extended version - allows you to set calculation parameters a
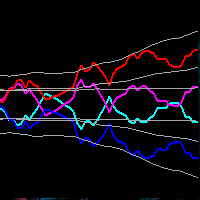
This indicator obeys the popular maxim that: "THE TREND IS YOUR FRIEND" Channel indicators incorporate volatility to capture price action. The Bollinger Bands is widely used, however, there are other options to capture swing action opportunities. Each study you will find here is unique, and reveals different types of price action.
https://www.mql5.com/en/market/product/116256
https://www.mql5.com/en/market/product/115553

MultiFractal Levels MultiFractal Levels – est un indicateur fractal modifié de Bill Williams avec des niveaux supplémentaires. Les fractales sont construites à partir de tous les TF autorisés dans les paramètres.
Les niveaux sont construits uniquement sur la base des dernières fractales qui n'ont pas encore été testées par leur prix. Avantages par rapport à l'indicateur de terminal d'origine: Commodité Visibilité Caractère informatif Derniers niveaux Fractale personnalisable Niveaux personna

This is the MT5 version of Ku-Chart.
This is an indicator devised by Ku-chan, a famous Japanese trader, based on the dealings of Lehman Brothers' discretionary traders. Unify the measuring stick of currencies to display the true value of currencies.
Although it is an indicator, it does not use a buffer and is displayed using objects such as trend lines. Also, instead of drawing on the subchart, it is drawn in an area far above the current price of the main chart, so you can switch from the
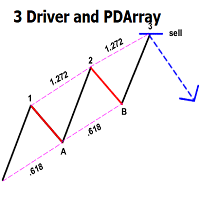
This indicator automatically identifies the SMC 3-Drive pattern and sends notifications to users when the pattern is detected. Additionally, the indicator identifies PDArray (including FVG and OB) and offers an option to combine the 3-Drive pattern with PDArray. This combination provides users with more reliable signals. What is the 3-Drive Pattern? This pattern is formed by three price pushes in one direction, providing a strong reversal signal (Figure 3). The key to identifying this pattern is

Introduction
The "Smart Money Concept" transcends the realm of mere technical trading strategies to embody a comprehensive philosophy on the dynamics of market operations. It posits that key market participants engage in price manipulation, thereby complicating the trading landscape for smaller, retail traders.
Under this doctrine, retail traders are advised to tailor their strategies in alignment with the maneuvers of "Smart Money" - essentially, the capital operated by market makers

Introducing our state-of-the-art Wave Indicator, meticulously designed for the discerning traders of the MQL5 community! At the core of this innovative tool lies an unmatched sensitivity to capture even the slightest market movements. Our Wave Indicator serves as the foundational element for constructing comprehensive trading strategies, providing you with an unwavering edge in the dynamic world of finance. Whether you're aiming to refine short-term tactics or develop long-term systems, this ind

TMA CG FAST MT4 REPLICADO PARA MT5 Cuenta con todas las caracteristicas del original con la funcion adicional de tener señal al fallo que consiste en que despues de una cantidad de velas establecida por el usuario emita una preseñal para una potencial entrada tiene alerta sonora para la posible entrada y la entrada definitiva tiene la posibilidad de repintar o no , queda a eleccion de usuario

Contact me for instruction, any questions! Introduction A flag can be used as an entry pattern for the continuation of an established trend. The formation usually occurs after a strong trending move. The pattern usually forms at the midpoint of a full swing and shows the start of moving. Bullish flags can form after an uptrend, bearish flags can form after a downtrend.
Flag Pattern Scanner Indicator It is usually difficult for a trader to recognize classic patterns on a chart, as well as sear

Contact me for instruction, any questions! Introduction V Bottoms and Tops are popular chart patterns among traders due to their potential for identifying trend reversals. These patterns are characterized by sharp and sudden price movements, creating a V-shaped or inverted V-shaped formation on the chart . By recognizing these patterns, traders can anticipate potential shifts in market direction and position themselves accordingly. V pattern is a powerful bullish/bearish reversal pattern
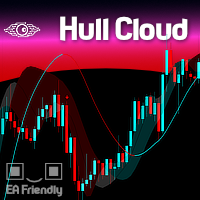
The Hull Moving Average is known for its ability to reduce lag and provide a clearer, more accurate depiction of market trends. By smoothing price data more effectively than traditional moving averages, it helps traders identify trend directions and reversals with greater precision. The Hull Cloud indicator elevates this by using four Hull Moving Averages working together like an orchestra. This combination creates a dynamic system that highlights short, medium, and long-term trends, giving trad
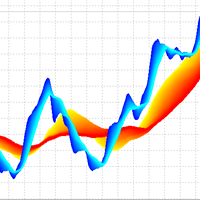
3D Trend Indicator is a non-repaint indicator using multiple moving averages with a 3D surface view. By using this indicator, you can remove uncertainties that can happen using a single and fixed moving average period. You can use a cloud area using a range of moving average periods. Also a wide range of visual settings are added to this indicator to have a better view from the cloud area. Alert and notification system added to the indicator to inform the trader about the action of candles on t
Apresentamos o Indicador de novo grafico - uma ferramenta poderosa para traders que buscam uma análise de preço suave e clara. Este indicador inovador calcula a média simples dos preços, oferecendo uma visão precisa e ajustada dos movimentos do mercado. Como Funciona : O Indicador de Média de Preços Simples (SMA) utiliza uma fórmula simples e eficaz: Ele soma o valor do último preço com o preço anterior. Em seguida, divide essa soma por 2 para obter a média. Fórmula : SMA = U ˊ ltimo Pre c ¸ o +

MinMax Levels MinMax Levels – est un indicateur des niveaux de prix maximum, minimum et d'ouverture pour les périodes de négociation importantes : jour, semaine et mois.
Chaque acteur du marché Forex utilise des niveaux dans son système commercial. Ils peuvent être soit le signal principal pour effectuer des transactions, soit un signal supplémentaire, agissant comme un outil analytique. Dans cet indicateur, les jours, les semaines et les mois ont été sélectionnés comme périodes importante
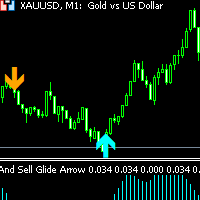
Buy and Sell Glide Arrow non-repaint and arrow appears on current candlestick orange arrow is a sell signal blue arrow is a buy signal Buy and Sell Glide Arrow works on 1 minute, 5 minutes and 15 minutes timeframes only as it is a scalping indicator. Pairs to trade: Forex pairs such as EURUSD,GBPUSD and other METALS: XAUUSD(GOLD) and other INDICES: Boom and crash 1000, Volatility Pairs such as VIX 10 - VIX 100 and other Lastly BTC AND LTC and other

Si vous avez besoin d’un indicateur qui montre les points d’entrée sur le marché, alors c’est votre indicateur.
L'indicateur n'est pas redessiné. Affiche les points d'achat et de vente pour n'importe quel TF (période) et n'importe quelle paire de devises. Les paramètres sont réglables pour tous les instruments. Vous pouvez configurer chaque paramètre pour n'importe quel courtier, pour n'importe quel compte.
C'est un OREILLER confortable :)) Il suffit de le vérifier.....

Conquistador is a fundamental technical indicator designed to assess the current market situation and determine the optimal entry and exit points in the currency pairs market with minimal risk. This indicator was created on the basis of original indicators for searching for extremes and is excellent for determining a reversal or sharp movement of the market. Thanks to Conquistador, you can recognize such moments in a timely manner and receive notifications in the form of colored dots on the cha

Description of the Indicator The indicator "BullsBearsPulse" is designed for MetaTrader 5 and provides a visual representation of the Bulls Power and Bears Power indicators. These indicators are useful tools for technical analysis, particularly for the EUR/USD currency pair, to help traders identify potential trading opportunities. Functionality Bulls Power : This indicator measures the strength of the bulls (buyers) in the market. It calculates the difference between the highest price and a 20

The Engulf Seeker indicator is a powerful tool designed to detect engulfing candlestick patterns with precision and reliability. Built on advanced logic and customizable parameters, it offers traders valuable insights into market trends and potential reversal points.
Key Features and Benefits: Utilizes revised logic to analyze previous candles and identify strong bullish and bearish engulfing patterns. Convenient arrow-based alert system notifies traders of pattern occurrences on specific symb

This spread indicator displays the actual spread of each candle. It highlights the maximum spread and the minimum spread of the chosen symbol. This indicator is very helpful to see in real time the spread evolution helping to avoid taking a trade when the spread is too high.
Inputs:
Print value in Points: if true displays the spread as a whole number
D isplay minimum and maximum spread of the past N days: select the number of days to consider the maximum and minimum spread
Automatically
=== > Que fait cet indicateur ? Il trace une seule moyenne SMA avec le choix du timeframe
Vous déposez cet indicateur sur vos graphiques autant de fois que vous avez besoin de moyenne.
Choisissez les paramètres et les caractéristiques de votre moyenne et c’est tout !!! **** Voir screenshot 01 à 02
N'hésitez pas à me demander le code iCustom pour intégrer facilement cette moyenne à vos propres codes, autre indicateur ou EA
Choisissez La timeframe cible Le nombre de période Le décalage
=== > Que fait cet indicateur ? Il trace une seule moyenne EMA avec le choix du timeframe
Vous déposez cet indicateur sur vos graphiques autant de fois que vous avez besoin de moyenne.
Choisissez les paramètres et les caractéristiques de votre moyenne et c’est tout !!! **** Voir screenshot 01 à 02
N'hésitez pas à me demander le code iCustom pour intégrer facilement cette moyenne à vos propres codes, autre indicateur ou EA
Choisissez La timeframe cible Le nombre de période Le décalage
=== > Que fait cet indicateur ? Il trace une seule moyenne SMMA avec le choix du timeframe
Vous déposez cet indicateur sur vos graphiques autant de fois que vous avez besoin de moyenne.
Choisissez les paramètres et les caractéristiques de votre moyenne et c’est tout !!! **** Voir screenshot 01 à 02
N'hésitez pas à me demander le code iCustom pour intégrer facilement cette moyenne à vos propres codes, autre indicateur ou EA
Choisissez La timeframe cible Le nombre de période Le décalag
=== > Que fait cet indicateur ? Il trace une seule moyenne LWMA avec le choix du timeframe
Vous déposez cet indicateur sur vos graphiques autant de fois que vous avez besoin de moyenne.
Choisissez les paramètres et les caractéristiques de votre moyenne et c’est tout !!! **** Voir screenshot 01 à 02
N'hésitez pas à me demander le code iCustom pour intégrer facilement cette moyenne à vos propres codes, autre indicateur ou EA
Choisissez La timeframe cible Le nombre de période Le décalag

Bienvenue dans le futur du trading avec le KMeans Price Zones Detector, un indicateur innovant pour MetaTrader qui utilise la puissance de l'apprentissage automatique pour identifier les zones de prix clés. Cet outil utilise l'algorithme de clustering KMeans pour détecter dynamiquement les centroïdes dans les données de prix, mettant en évidence les zones où les prix sont plus susceptibles de rencontrer un support, une résistance ou une consolidation. Algorithme KMeans innovant Le KMeans Price Z

Optimisez vos stratégies de trading avec l'indicateur RAR (Relative Adaptive RSI) ! Cet indicateur d'analyse technique avancé combine la puissance de l'indice de force relative (RSI) avec des techniques adaptatives, fournissant des signaux plus précis et fiables qu'un oscillateur commun. Qu'est-ce que l'indicateur RAR ? Le RAR est un indicateur conçu pour MetaTrader 5 qui utilise des moyennes mobiles exponentielles (EMA) et des moyennes mobiles adaptatives (AMA) pour lisser le RSI et l'ajuster d
=== > Que fait cet indicateur ? Il trace une ligne qui représente le Supertrend, base sur un ATR
Choisissez Le multiple d’ATR La période de l’ATR et c’est tout !!! **** Voir screenshot 01 à 2
N'hésitez pas à me demander le code iCustom pour intégrer facilement ce SuperTrend à vos propres codes
=== > Exemple sur le Bitcoin **** Voir screenshot 03
=== > Pour qui ? Que vous soyez trader discrétionnaire, trader algorithmique ou développeur, l’indicateur est conçu pour répondre à vos besoin
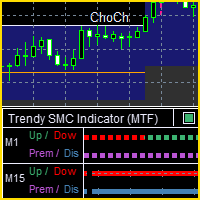
The Trendy SMC ( MTF ) indicator monitors trends and SMC concepts from multiple timeframes, allowing you to see what's happening from different perspectives, but on the one chart.
It is designed to help with a range of trading strategies related to trends and SMC concepts (such as Premium / Discount prices, Fib retracement levels and Fair Value Gaps). Features include:
Determining the trend based on market structure (breaks of highs and lows) Displaying the current trading range (between the

PyNinjaTrader - Connecteur API Python glisser-déposer pour NinjaTrader 8
PyNinjaTrader connecte de manière transparente vos scripts Python à NinjaTrader 8 à l'aide d'une simple stratégie de glisser-déposer. Cette solution entièrement testée, rapide et efficace utilise des websockets pour la communication, la stratégie agissant en tant que serveur et le script Python en tant que client.
Caractéristiques: - Connexion Python au terminal NinjaTrader 8 - Fonction Keep-Alive pour une connexion co
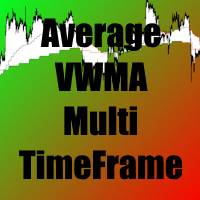
=== > Que fait cet indicateur ? C’est une moyennes mobiles pondérées par le volume, c’est un lissage précis en fonction des volumes échangés
Il trace une seule moyenne WWMA avec le choix du timeframe
Vous déposez cet indicateur sur vos graphiques autant de fois que vous avez besoin de moyenne.
Choisissez les paramètres et les caractéristiques de votre moyenne et c’est tout !!! **** Voir screenshot 01 à 02
N'hésitez pas à me demander le code iCustom pour intégrer facilement cette moyenn
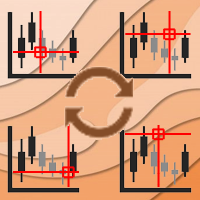
Async Charts is an indicator to synchronize charts and display a customized crosshair (cursor) on all selected charts. This is a useful utility for traders using multiple timeframes of analyzing multiple symbols for trade entry or exit.
Main Features : Real time Crosshair Synchronization on All Selected Charts
Supports Multiple Timeframes and Multiple Symbols at the same time
Auto Scroll Option
Graphical Adjustment of Color, Font, Size, ...
Locking All or Locking Specific Charts
More and

MSnR Lines est un indicateur personnalisé conçu pour afficher les niveaux de support et de résistance sur un graphique MetaTrader 5. Il utilise une méthode de détermination des niveaux de support et de résistance basée sur les pics (A-Levels), les creux (V-Levels) et les écarts de prix (Gap-Levels). Fonctionnement L'indicateur MSnR Lines identifie trois types de niveaux horizontaux : A-Level (Niveau A) : Il est situé au sommet du graphique linéaire et prend la forme de la lettre "A". V-Level (

Индикатор тиковых объемов представляет собой инструмент технического анализа, используемый для оценки активности трейдеров на рынке. Этот индикатор отображает количество тиков (изменений цен) за определенный временной период и показывает преобладание тиков, направленных на покупку или продажу.
Основные характеристики и функции индикатора тиковых объемов: Гистограмма объемов:
Белый цвет: Означает преобладание тиков, направленных на покупку. Когда количество покупок превышает количество прода
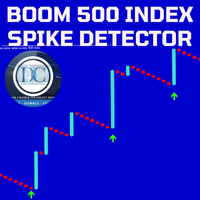
Our Spike Detector is specifically engineered to cater to the unique needs of traders in the Boom and Crash indices markets. This tool is optimized for M1 (1-minute) and M5 (5-minute) timeframes, ensuring you receive timely and actionable insights.
Key Features:
1. Non-Repainting**: Our detector guarantees accuracy with non-repainting signals, ensuring your data remains consistent and reliable. 2. Push Notifications**: Stay updated with real-time push notifications, so you never miss a cr

Our Spike Detector is specifically engineered to cater to the unique needs of traders in the Boom and Crash indices markets. This tool is optimized for M1 (1-minute) and M5 (5-minute) timeframes, ensuring you receive timely and actionable insights.
Key Features:
1. **Non-Repainting**: Our detector guarantees accuracy with non-repainting signals, ensuring your data remains consistent and reliable. 2. **Push Notifications**: Stay updated with real-time push notifications, so you never miss a
Spike Detector for Boom and Crash Indices
The Spike Detector is specifically designed to cater to the unique needs of traders in the Boom and Crash indices markets. Optimized for M1 (1-minute) and M5 (5-minute) timeframes, this tool ensures you receive timely and actionable insights. Below, you'll find a comprehensive guide on its key features, advantages, installation process, and how to use it effectively.
Key Features and Advantages
1. Non-Repainting: The Spike Detector guarantees accu

** Attention! This indicator is a market tool that can lead to substantial losses; use it at your own risk ** Operation: Histograms with positive or negative values, where positive means possible strength of the current movement, and negative means possible weakness. Colors: red indicates relative strength to the downside, green indicates an upward movement, and yellow indicates an alert state! The calculation period can be adjusted to your liking! I recommend using it on a demo account before u
The Interactive RSI indicator can generate RSI divergence with the availability of user defined filters. It can generate voice alerts for RSI oversold and RSI Overbought situations. Moreover it can also generate voice alerts for RSI Divergneces as well as when price breaks above or breaks below the support and resistances created upon divergence ouccurence. The voice alerts are generated in a way that you will know which market has reached the oversold and overbought conditions as well as the r
=== > Que fait cet indicateur ? Il trace une seule moyenne VEMA avec le choix du timeframe.
La moyenne mobile exponentielle pondérée en volume (VEMA) est une moyenne mobile qui accorde plus de poids aux données récentes et aux barres de volume élevé.
Cela signifie que les fluctuations de prix sur les barres à volume élevé auront un impact plus important sur VEMA.
Il trace une seule moyenne WWMA avec le choix du timeframe
Vous déposez cet indicateur sur vos graphiques autant de fois que

Bienvenue dans une nouvelle ère de trading avec l'indicateur AI Moving Average, un indicateur avancé MetaTrader 5 conçu pour fournir aux traders des insights prédictifs sur les mouvements du marché. Cet outil combine la puissance de l'IA avec la fiabilité d'une moyenne mobile exponentielle sans décalage pour offrir des prévisions précises et opportunes des tendances futures des prix. Modèle de Régression Linéaire Innovant Le AI Moving Average utilise un modèle de machine learning de régression l

This is the test product. Please, DO NOT BUY IT! This is the test product. Please, DO NOT BUY IT! This is the test product. Please, DO NOT BUY IT! This is the test product. Please, DO NOT BUY IT! This is the test product. Please, DO NOT BUY IT! This is the test product. Please, DO NOT BUY IT! This is the test product. Please, DO NOT BUY IT! This is the test product. Please, DO NOT BUY IT!
Le MetaTrader Market est la seule boutique où vous pouvez télécharger un robot de trading de démonstration gratuit pour le tester et l'optimiser à l'aide de données historiques.
Lisez l’aperçu de l'application et les avis d'autres clients, téléchargez-la directement sur votre terminal et testez un robot de trading avant de l'acheter. Seul MetaTrader Market vous permet de tester gratuitement une application.
Vous manquez des opportunités de trading :
- Applications de trading gratuites
- Plus de 8 000 signaux à copier
- Actualités économiques pour explorer les marchés financiers
Inscription
Se connecter
Si vous n'avez pas de compte, veuillez vous inscrire
Autorisez l'utilisation de cookies pour vous connecter au site Web MQL5.com.
Veuillez activer les paramètres nécessaires dans votre navigateur, sinon vous ne pourrez pas vous connecter.