Indicadores técnicos de pago para MetaTrader 5 - 52

Entry Pro Indicator is a powerful multi-functional trading tool designed to increase your market entry accuracy. It combines the power of several key market trend indicators, including ATR Trailing Stop and both fast and slow EMA, to provide comprehensive market insight. It offers easy-to-interpret market entry signals represented by colored arrows. Also, it's fully customizable, allowing you to adjust ATR and EMA periods to suit your trading strategy. Trend filters and alerts can be toggled on

Meet the Tweezer Hunter, an essential tool for every Forex trader looking to make accurate, trend-following trades. This powerful, intuitive indicator helps traders spot potential trend reversals before they happen, providing a significant advantage in the fast-paced world of Forex trading. The Tweezer Hunter is more than your average tweezer candle indicator; it's designed with a built-in trend identification feature that accurately detects whether the market is bearish or bullish. By integrat

Man Trend uses at its core the process of identifying the rate of change in price growth and allows you to find entry and exit points from the market.
The indicator was created on the basis of the original indicators for searching for extreme points, the indicator is well suited for determining a reversal or a large sharp jerk to one of the sides, thanks to it you will know when this happens, it will notify you with the appearance of a blue dot to buy red to sell.
This is a fundamental tech

Acerca de Presentamos nuestro indicador de análisis técnico de última generación que predice tendencias utilizando múltiples fuentes de gráficos técnicos, diseñado específicamente para los pares de divisas EURUSD, EURJPY y EURGBP en el mercado de Forex. Esta herramienta de vanguardia está diseñada para proporcionar a los traders información precisa y confiable sobre las tendencias y movimientos de precios potenciales, permitiéndoles tomar decisiones informadas sobre sus operaciones. Mediante el
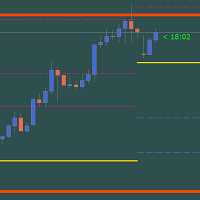
Gold PL MTF - this is a fine stock technical indicator. The indicator algorithm analyzes the movement of the asset price and automatically reflects the important Pivot Levels of the specified timeframe (TF) using the Fibonacci method (golden section).
The indicator perfectly describes the price trajectory of the selected timeframe (day, week, month, year), determines the beginning of a trend and the beginning of a correction, which may develop into an opposite trend. The indicator also shows t

Presentamos el Didi Index Volume, un indicador de análisis técnico desarrollado por el trader brasileño Odir Aguiar, que destaca por su enfoque avanzado y poderoso en la identificación de oportunidades en el mercado financiero. Disponible en diversas plataformas, el Didi Index Volume se ha convertido en una herramienta esencial para los traders que buscan información precisa y valiosa para sus estrategias de negociación.
El indicador combina el reconocido Didi Index, creado por Odir Aguiar, c
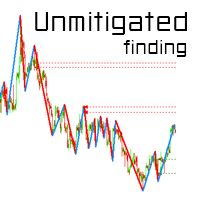
SMC Unmitigated Finding is a indicator for find unmitigated supply and demand in previous legs of price
Settings Zigzag Settings ZZDepth - by Default is 12.
ZZDeviation - by Default is 5.
ZZBackStep - by Default is 3. Horizontal Line Settings SupportColor- color for Support line.
ResistanceColor - color for Resistance line. Settings Num of Show - Number of Support & Resistance Show.

The DVV indicator is a multifaceted informative indicator for the Forex market or the Cryptocurrency market . The indicator gives clear and reliable signals without redrawin g. The indicator can be used in bots by taking readings from its zero buffer.
Please note that for different currency pairs, the settings must be selected separately, this is not difficult.
Changing the input parameters greatly affects the display. I will show four options for using the indicator. The indicator has only

C300 SYNTHETIC INDICATOR 1MIN CHART Update V2 No repaint
*The indicator will not give a sell sign if the market conditions are not in place. *With all 3 strategy criteria in place the strategy based indicator signals 1-3 trades per day. *The drawdown can range to very high you need to place your own target profit and stop loss according to your risk management system . *The indicator is designed for only C300 and the 1min chart .
NB :Note this strategy based indicator will be free only f

Gioteen Volatility Index (GVI) - your ultimate solution to overcoming market unpredictability and maximizing trading opportunities. This revolutionary indicator helps you in lowering your losing trades due to choppy market movements. The GVI is designed to measure market volatility, providing you with valuable insights to identify the most favorable trading prospects. Its intuitive interface consists of a dynamic red line representing the volatility index, accompanied by blue line that indicate

3 candel indicator in 1 !!! The 3 most important candel indicator in 1 packadge. Help trader in chart visualisation, prevent reversal !!! Doji : Gravestone Doji, Long Legged Doji, Dragonfly Doji. Engulfing : Bullish, Bearish. Hammer : red hammer, green hammer. Fully parametrable indicator icon color config and alarm. Free life time update !!! Just try our demo for free.

Crash 500 indicator Update V2 No Repaint
This indicator works with a custom build in strategy The indicator will only give a sell sign when market conditions are in place. Only for sell. Apply own risk management target profit and stoploss. When market conditions are met the sell sign will indicate you to enter a sell position and you will have to apply your risk management system accordingly. This is only for Crash 500 market and only 1min chart
NB: Please note this indicator will be fr

El objetivo principal del indicador es determinar los momentos de entrada y salida de las transacciones, por lo que ExactArrow no dibuja nada más que flechas que muestran los lugares para entrar y salir del mercado.
A pesar de la aparente simplicidad del indicador, en su interior hay algoritmos analíticos complejos, con la ayuda de los cuales el sistema determina los momentos de entrada y salida.
El indicador da señales precisas y oportunas para entrar y salir de una operación que aparecen

Make Sure to Read the Description! UT Bot Plus contains free EA!
The EA can be downloaded from telegram channel: https://t.me/ +NSOJTvH39fNhZmU0
Unlock the Power of Automated Trading with UT BOT Indicator, Integrated with a FREE EA! ( Limited time offer ) This version has been expanded to include multiple additional filtering options. These options are fully configurable and can be switched on and off.
This versatile UT BOT indicator is crafted and optimized to work seamlessly with the

El indicador Smart Binary Volume es una herramienta versátil que combina el análisis del volumen de negociación con el aprendizaje automático (machine learning). Puede aplicarse en diversos mercados y estrategias, incluyendo el scalping y otros tipos de operaciones a corto plazo. Utilizando algoritmos avanzados de aprendizaje automático, el indicador identifica patrones complejos, generando señales de compra y venta con mayor precisión.
Buffer to Create EA. Buffer Line Gold = 0. Buffer Line R
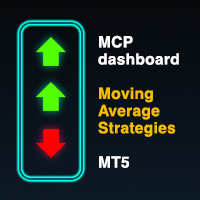
Multicurrency indicator in table format. Signals appear with confirmation, no repaints. Works on the current (open) timeframe. Notifications come for an open instrument. In the indicator settings, you can choose 1 of 4 Moving Average strategies. Strategies (represented in screenshots): Classic fast and slow moving average crossover Reverse signal of classic crossing (used for flat/sideways movement) Classic crossover relative to a slower moving average (Trend MA in settings) Price touching the f
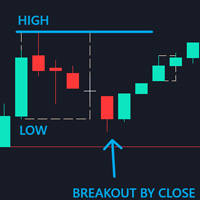
Control Candle is the candlestick which holds multiple inside bars and are in control until its high low range is broken by close of any candlestick. When control candle is broken, price may act on these control candle as support and resistance.
This indicator create rectangles on chart which will help you find control candles fast.
Control candle indicator box is customizable by color, style, width and other options in indicator settings.
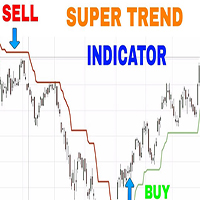
Como sugiere el nombre, indica la dirección del movimiento del precio en un mercado que está en tendencia, es decir, siguiendo un camino particular. Se traza en los gráficos de precios de las acciones para que los inversores vean la tendencia actual marcada que se muestra en rojo cuando los precios han bajado y en verde cuando los precios han subido.
Parámetros de entrada:
Período del indicador CCI Período del indicador ATR Nivel de activación de CCI Desplazamiento horizontal de las barra

KT Triple Top-Bottom identifies the triple top/bottom pattern with a breakout signal in the opposite direction. It is used to identify potential trend reversals.
A Triple Top pattern is formed when the price reaches a high point three times, while a Triple Bottom pattern occurs when the price comes to a low point three times.
Features The indicator detects the triple top/bottom pattern with high precision and accuracy. The indicator suggests a shift in momentum, with sellers or buyers takin

Introducing the Aroon Indicator - Your Ultimate Trend Analysis Tool!
Are you looking to take your trading game to the next level? Want to identify lucrative entry and exit points in the financial markets with ease? Look no further! The Aroon Indicator is here to revolutionize your trading strategy and help you make informed decisions like never before.
Developed by the brilliant mind of Tushar Chande, the Aroon Indicator is a powerful technical analysis tool designed to measure the strength

KT DMA is a modified and advanced version of the classic Displaced Moving Averages with buy/sell crossover alerts and a Multi-Timeframe scanner that shows DMA's direction across each real-time time frame. A Displaced Moving Average is a simple moving average that moves ahead or backward in a time frame (either short-term or long-term). It also allows you to predict price movement more accurately.
Features Depicts the trend direction using the alignment of three moving averages. Buy/Sell signa
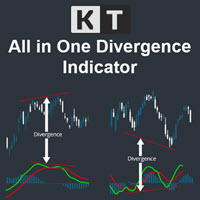
The KT All-In-One Divergence is designed to identify regular and hidden divergences between the price and 11 widely recognized oscillators. This powerful tool is indispensable for swiftly and accurately spotting market reversals. Its a must-have tool in any trader's arsenal, providing clear and accurate divergence patterns. Its accuracy and speed in identifying market reversals are remarkable, allowing traders to seize profitable opportunities confidently.
Features No Interference: You can a
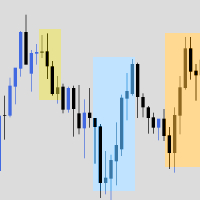
The indicator is a bundle of EIGHT different fundamental functions required for a trader: 1] Forex Session where you can determine your own timings/highlights. 2] High low marking from 1H to 1M 3] Sweetspot 4] Spread and Candle Stick Timer 5] Background logo for branding- You can place the images at any zone of the chart you want 6] Profit and Loss 7] Days names (SUN MON TUE…) on the chart 8] High/low break notification
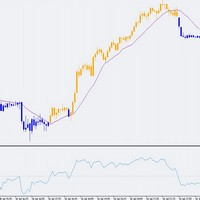
This indicator can be very important in any trading system. The Indicator colors candles above or below the 50 level of the RSI, which is a widely used indicator in technical analysis. With this indicator it is much easier to identify trends, helping with the entry and exit points of negotiations. It is a fact that in the financial market, simple things work. Este indicador pode ser muito importante em qualquer sistema de negociação. O Indicador colore as velas acima ou abaixo do nível 50 do

Hello There,
Today I want to show you my new researchable fore BUY SELL indicator,
it work all asset,
and also work Derive Volatility asset!
it work all time frame, but i recommend start 5 minute to H1
when you receive a signal just take trade and stay wait for your take profit
asset
All Major Pair And minor
IT WORK ALSO XAUUSD
Fantastic results,
for more info,,, message us
thank you
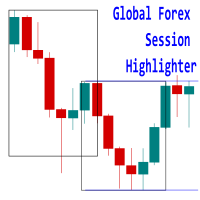
Introducing the 'Global Forex Session Highlighter' , a powerful tool designed to enhance your trading strategy by providing a visual representation of the Three major Forex trading sessions: Tokyo, London, and New York. This indicator is designed to help traders understand the dynamics of the global Forex market by highlighting the trading sessions directly on your MT5 chart. It provides a clear view of when each session starts and ends, allowing you to strategize your trades around the most act
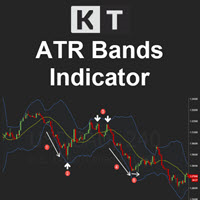
KT ATR Bands draws the volatility envelops and bands using a combination of Average True Range and Moving average. They are typically used to identify the potential reversal points and the periods of high and low volatility.
Features
Multi-Timeframe Ability: For example, you can have the atr bands from the daily timeframe on the H1 timeframe. Smart Alerts: You can turn on/off alerts for each band separately. Also, you can choose a minimum time interval between each alert to stop unnecessary,
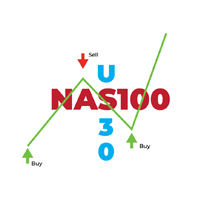
El Indicador NAS30 Scalper es una herramienta de vanguardia diseñada para proporcionar señales precisas de compra y venta para estrategias de scalping en NAS100 y US30. Este indicador utiliza algoritmos avanzados para identificar tendencias a corto plazo en el mercado y capitalizar movimientos rápidos de precios, lo que lo convierte en la opción ideal para traders que buscan aprovechar oportunidades de ganancias rápidas.
Características principales:
Señales en tiempo real: Reciba alertas in

The indicator is created using a unique algorithm that has no analogues. Based on the calculations, the contract price itself and the percentages displayed in it are calculated, which are displayed in the indicator in the form of histograms in two drawing options, as well as in six options for displaying prices on a chart in various combinations, which allows you to accurately see the interest of all trading participants in the form of drawing levels support and resistance. Trading decisions can
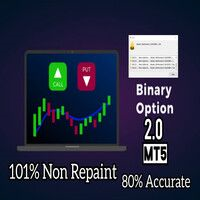
Alright. This indicator works on MT5 and is very easy to use. When you receive a signal from it, you wait for that candle with the signal to close and you enter your trade at the beginning of the next new candle. A red arrow means sell and a green arrow means buy. for easy identification of trade signal. Are you okay with that?
The indicator cost $500. We release new updates of the indicator every month and the updates are for free once you bought the indicator first time. This indicator was
Candle Scanner Dashboard is an incredibly powerful tool in the financial markets. It excels at detecting market reversals, trend changes, and retracements. The dashboard displays patterns as they are identified, and with a simple click on each pattern, you can view them on their dedicated charts to precisely locate their occurrences. With its capability to detect 11 popular bullish and 11 bearish patterns, you can trust the dashboard to handle pattern identification effortlessly. It provides an

1. GENERAL DESCRIPTION OF THE TREND RENEWAL INDICATOR The Trend Renewal Indicator (TRI) is a simple yet very powerful trend-following indicator that works on the MT5 trading platform of MetaQoutes (MLQ5). The TRI indicator suits small and large accounts, and is ideal for very large accounts. It has been used for decades by fund managers and institutional traders, but never offered to retail traders. The TRI works with any instrument, including currencies, crypto currencies, metals, hard and soft
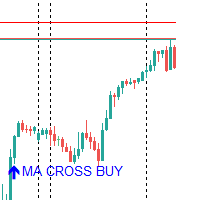
This indicator does not repaint, it is a trend indicator created to trade all financial instruments; go watch the video of the presentation on youtube https://youtu.be/OyhGcmgpzdQ you can do swin, day trading and scalping depending on the settings you will receive after your purchase, join my telegram channel @ASTBOSSA MY USERNAME FOR TELEGRAM GOOD LUCK TIMEFRAME: H1,H4,D1 (98% WIN RATE FOR ALL MARKET)
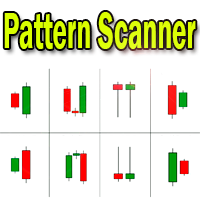
Candlestick pattern indicator - display found candlestick patterns on the chart. MT4-version: https://www.mql5.com/en/market/product/103345 Bearish patterns: Bearish Pattern Designations Pattern name SS
Shooting Star STR(S) Evening Star DJ(E) Evening Doji Star DC Dark Cloud Veil BEP Bearish Engulfing Bullish patterns: Designation of bullish patterns Pattern name HMR
Hammer pattern
STR(M) Morning Star DJ(M) Morning Doji Star PRL Piercing Line BEP Bullish Engulfing The S

Ali Levels Pro is an indicator designed to identify and draw levels of interest including: Opening Range High/Low with seconds precision, Previous Session High/Low (if you are a Intraday trader who trades Indices or Commodities maybe you want to know yesterday New York Session high and low), Overnight Session High/Low, Previous Day High/Low, Previous Week High/Low, and Previous Month High/Low.
Traders use this levels as support and resistance levels. By searching for confluences between
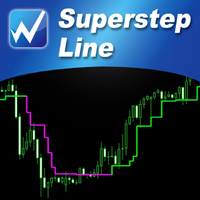
【SuperStep Line】Indicator Introduction : The color of the SuperStep line which is green and climbing up means that the price trend is going up.The color of the SuperStep line is purple and going down means that the price trend is going down.
It is very simple to use it to judge the market trend! What's even better is that the open parameters of the indicators allow investors to adjust. You can adjust 【SuperStep Line】 according to your needs. Adjust it faster to be closer to short-term market

【Super Scanner】Indicator Introduction : The color of the Super Scanner which is green and climbing up means that the price trend is going up.The color of the Super Scanner is red and going down means that the price trend is going down.
It is very simple to use it to judge the market trend! What's even better is that the open parameters of the indicators allow investors to adjust. You can adjust【Super Scanner】according to your needs. Adjust it faster to be closer to short-term market fluctuati

This indicator uses a mathematical calculation algorithm . This algorithm calculates the remainder between the updated model and the actual values and produces the possible progress of the graph on the graph. It is not a super prophet in trading, but it is very good for the trader when entering the market and to analyze it before entering. Applicable for all currencies. Данный индикатор использует алгоритм математических вычислений . Данный алгоритм вычисляет остаток между обновленной моделью и

Descripción del Indicador de Zonas de Desequilibrio FVG El Indicador de Zonas de Desequilibrio FVG es una poderosa herramienta diseñada para identificar posibles desequilibrios de precios en los gráficos financieros. Desarrollado por Pierre-Alexis Blond, este innovador indicador marca las áreas donde la oferta y la demanda pueden divergir significativamente, proporcionando a los traders información valiosa sobre posibles puntos de reversión en el mercado. Características principales: Detección d

Indicador Tipo Estrategia (Pullback), que aplica a todos los Simbolos y Periodicidad, preferiblemente a partir de 30M. Puede ser utilizado para trading manual. Su espacio de trabajo corresponde al canal de 3 barras del Maestro Bill Williams. Tambien se apoya en los indicadores Rsi y Atr. Comprar (Buy) cuando: hay una flecha de color verde STOPLOSS para comprar, colocarlo por debajo de la linea inferior del canal (linea de color rojo)" Vender (Sell) cuando: hay una flecha de color rojo. STOPLOSS
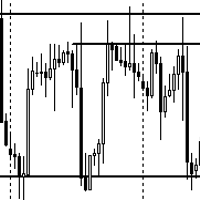
The Vice Supply and Demand Zones MT5 Indicator is a powerful tool designed to identify potential supply and demand zones on price charts. These zones represent areas where market forces of supply and demand are likely to cause significant price movements. The indicator helps traders to spot key support and resistance levels, aiding in making informed trading decisions. Indicator Features: Supply Zones: The indicator plots blue rectangles on the chart to identify potential supply zones. Supply z
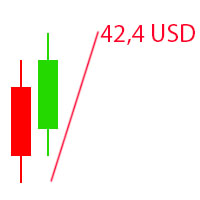
The Visual Result Calculator Indicator is a powerful tool designed to enhance your trading experience on the MetaTrader platform. This intuitive and user-friendly indicator allows you to visualize potential profits or losses on a trading chart, helping you make better-informed decisions and manage your trades with precision. The Indicator displays a dynamic line on the trading chart, representing the potential profit or loss of a trade based on the start and end of the line. Simply click and
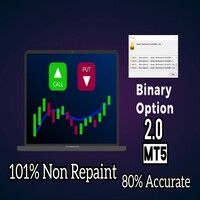
King Binary Profit System
1 minute candle
3-4 minute expire
Alright. This indicator works on MT5 and is very easy to use. When you receive a signal from it, you wait for that candle with the signal to close and you enter your trade at the beginning of the next new candle. A red arrow means sell and a green arrow means buy. All arrows comes with a long dotted like for easy identification of trade signal. Are you okay with that?

Presenting breakout strategy indicator, influenced by the insightful Smart Money Concept. This sophisticated tool aims to assist traders in spotting potential trading opportunities characterized by breakouts in the market. The foundation of the Smart Money Concept lies in the actions of seasoned investors and astute market participants. It's important to clarify that this indicator does not guarantee profits; rather, it's designed to empower traders with valuable insights into
Introducción:
La "Zona de giro" es un indicador de mercado MQL5 sofisticado e innovador diseñado para proporcionar a los operadores una poderosa herramienta para detectar posibles cambios de tendencia en los mercados financieros. Al utilizar el concepto atemporal del análisis de horquilla, el indicador Turning Zone identifica las zonas clave de reversión donde es probable que cambie el sentimiento del mercado, ofreciendo a los operadores información valiosa para tomar decisiones informadas. Ver

¡Presentamos el revolucionario indicador MT5, DARWIN Assistant , su puerta de entrada definitiva al mundo del comercio exitoso! Diseñado con precisión y experiencia, DARWIN Assistant opera con una estrategia especial que aprovecha el poder de los indicadores técnicos avanzados (RSI, Estocástico, CCI y Tendencias) en todos los marcos de tiempo. Prepárese para una experiencia comercial extraordinaria, ya que este indicador de vanguardia le ofrece las señales de entrada más precisas, lo que le

Hidden Gap by MMD Hidden Gap by MMD is a unique indicator that detects hidden gaps between three consecutive candles. This observation isn't my own, but in the MMD methodology, it has its application alongside other original indicators. You can apply this indicator to the chart multiple times and set the interval from which you want to see the hidden gaps. You can show or hide these gaps as needed. For example, you can view the chart at an M5 interval and see hidden gaps from an M15 chart, etc.

Stochastic Scanner is a multi symbol multi timeframe Stochastic dashboard that monitors the indicator for price entering and exiting overbought and oversold in up to 28 symbols and 9 timeframes.
Download Demo here (Scans only M1, M5 and M10) Settings description here MT4 version here
Stochastic Scanner features: Signals price entering and exiting the overbought and oversold zones. Monitors up to 28 customizable instruments and 9 timeframes at the same time. Supports all 21 timeframes o
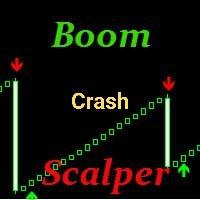
The indicator is designed for index trading mainly for Boom Crash Well detects long movements You can open trades from signal to signal against surges on long movements It can also be configured to detect surges, but for this it is recommended to use additional filters such as support and resistance levels, it goes well with them This indicator is well suited as a basis for creating a good trading strategy for indices.

Neural Bar Impulse is an indicator based on a neural network created and specially trained to predict the potential impulse of each next market bar. By bar impulse we mean the tendency of the market price to update the maximum or minimum of the bar relative to its opening price.
We chose this particular feature of market bars because, based on our own research, we discovered an interesting feature of bar impulses to be harbingers of a change in price trend movements.
The neural network we c

Indicator for searching for price reversals Works well on commodity indices and currency pairs On charts such as Boom Cash, it shows the beginning of a protracted movement well. You can also catch splashes. The indicator uses algorithms, an oscillator and a trend indicator that work together. The indicator shows a candle opening signal (does not disappear, does not redraw and does not recalculate its readings) A good quality tool that can become the basis for creating your own trading system.

The ICT Silver Bullet indicator is inspired from the lectures of "The Inner Circle Trader" (ICT) and highlights the Silver Bullet (SB) window which is a specific 1-hour interval where a Fair Value Gap (FVG) pattern can be formed. A detail document about ICT Silver Bullet here . There are 3 different Silver Bullet windows (New York local time):
The London Open Silver Bullet (3 AM — 4 AM ~ 03:00 — 04:00)
The AM Session Silver Bullet (10 AM — 11 AM ~ 10:00 — 11:00)
The PM Session Silver Bulle
: Sólido].
Bajo menos 25% de ancho de línea [predeterminado en: 4].
Color de la línea abierta del mercado local [predeterminado en: DodgerBlue].
Estilo de línea abierta del mercado local [predeterminado en: discontinuo].
Ancho de línea abierta del mercado local [predeterminado en: 1].
Color de las líneas medias del mercado local [predeterminado en: DarkOrchid].
Estilo de líneas intermedias del mercado local [predeterminado en: discontinuo].

White Light POC (WLP)
Experience precision in trading analysis with White Light POC (WLP), a meticulously designed powerful tool for traders seeking accurate Point of Control (POC) calculations. This advanced indicator has been crafted with a focus on efficiency and adaptability, ensuring seamless integration into Expert Advisors or other indicators through a convenient copybuffer interface. Features: Lightweight Efficiency: White Light POC (WLP) offers a streamlined solution that provides POC

Based on the trading model/strategy/system of gold double-position hedging and arbitrage launched by Goodtrade Brokers, problems encountered in daily operations: 1. Account B immediately places an order immediately following account A. 2: After account A places an order, account B will automatically copy the stop loss and take profit. 3: Account A closes the position of Account B and closes the position at the same time. 4: When account B closes the position, account A also closes the position.

Considerando que os preços de OHLC de períodos anteriores são regiões importantes de negociação, criei um indicador que traça linhas de Open, High, Low e Close do dia, semana ou mês anterior no gráfico atual. Além de marcar essas regiões, linhas extras foram inseridas como opção que marcam os MEIOS (50%) dessas regiões e uma linha que marca a ABERTURA do dia. O usuário pode configurar a exibição das linhas que achar mais expressivas. Configurações: PERIOD RANGE Timeframe = Período de referência
A top and bottom indicator that can intuitively identify the trend of the band. It is the best choice for manual trading, without redrawing or drifting. Price increase of $20 every 3 days, price increase process: 79--> 99 --> 119...... Up to a target price of $1000. For any novice and programming trading friend, you can write the signal into the EA to play freely. Array 3 and array 4, for example, 3>4 turns green, 3<4 turns red. If you don't understand, please contact me. ====================P

Indicator for trend trading Doesn't redraw The algorithm uses reliable and proven time indicators It is recommended to use with common manufacturer's filters as resistance support levels Or standard Bollinger Bands or ZigZag indicators It can also be combined with the RSI indicator to determine whether a currency pair or index is overbought or oversold. The indicator is designed to work on small timeframes from m1 to m15
The "ZigZag_OsMA" indicator is a powerful tool designed to enhance price chart analysis within the MetaTrader 4 platform. This custom indicator amalgamates the strengths of two renowned indicators: ZigZag and OsMA (Moving Average of Oscillator), resulting in a comprehensive visualization that aids traders in making informed decisions.
The indicator employs color-coded candlesticks to represent market trends. It dynamically adjusts the high and low prices of each candlestick based on ZigZag va

The "Deviation Scaled Moving Average Crosses" indicator is a powerful technical analysis tool designed for the MetaTrader 5 trading platform. It facilitates informed trading decisions by visually presenting the interaction between two moving averages, both of which are smoothed and scaled to offer enhanced insights into market trends. This custom indicator is developed by mladen and is copyright-protected for the year 2023.
Using a unique approach, the indicator displays two types of deviatio

The "MA_Candles" indicator is a customizable technical tool designed for the MetaTrader 5 trading platform. It enhances price chart analysis by visually representing candlesticks with distinct colors based on a moving average (MA) calculation. This indicator helps traders identify potential trend reversals and market sentiment shifts.
The "MA_Candles" indicator enhances MetaTrader 5 charts by coloring candlesticks based on a moving average (MA) calculation. It helps traders quickly identify

Indicador tipo 2mv frequência mostra os níveis percentuais no mercado financeiro que tendem a ser zonas realmente importantes para os traders. Observem que o preço segue um fluxo e uma frequência que se enquadram em canais percentuais de movimento, tradicionalmente traçados por níveis Fibonacci. O indicador LevelsPercent traça linhas em pontos específicos de percentual configurados pelo usuário e "pode" anteceder possíveis níveis de SUPORTE e RESISTÊNCIA. A leitura do mercado e a identificação

Presentamos el Indicador Advanced SR. Un indicador diseñado para ayudarte a identificar los niveles clave más importantes en tu gráfico.
Tus Desafíos: No estás seguro de cómo señalar áreas significativas de precio. Estás dibujando zonas de oferta y demanda o niveles de soporte y resistencia como el 99% de otros traders. Encuentras que las zonas SD y SR que dibujas no son efectivas. No estás seguro de la seguridad de tus puntos de entrada y salida. Advanced SR aborda todos estos problemas. Con

Market Profile Heat indicator — is a classic Market Profile implementation that can show the price density over time, outlining the most important price levels, value area, and control value of a given trading session.
This indicator can be attached to timeframes between M1 and D1 and will show the Market Profile for daily, weekly, monthly, or even intraday sessions. Lower timeframes offer higher precision. Higher timeframes are recommended for better visibility. It is also possible to use a f

The Trenders indicator is very sensitive to current price activity and displays signals quite well. Quickly reacts to changes in the trend, clearly shows the price movement. The colored version of the indicator signals a trend change. The indicator allows you to see a rising or falling trend.
In addition to the direction of the trend, the indicator shows the change in the angle of inclination, the analysis of which allows you to filter signals with the help of angle filters, this can be used

The Wamek Support and Resistant (WSR) Indicator is a remarkable tool that stands out in the world of technical analysis. It sets itself apart by cleverly combining price action and leading indicators to delineate support and resistance levels with a high degree of accuracy. Its unique feature is its adaptability; users can fine-tune the indicator by adjusting input parameters, enabling them to create customized support and resistance levels that suit their trading strategies. Notably, one of WSR

Introducing the Ultimate Trading Tool: Arrow Scalper! Are you ready to take your trading game to the next level? Look no further, because we've got the game-changing indicator you've been waiting for – presenting the Arrow Scalper ! Unleash Your Trading Potential : Arrow Scalper is not just another indicator – it's your ticket to accurate and effective trading across any currency pair. Whether you're a seasoned trader or just starting out, Arrow Scalper's precision and reliability will
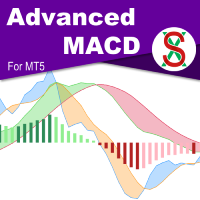
MACD ( M oving A verage C onvergence/ D ivergence) is a widely used indicator in technical analysis. What makes the MACD such a valuable tool for technical analysis is that it effectively combines two indicators into one. It can help to identify trends and measure momentum simultaneously. SX Advanced MACD for MT4 is available here . SX Advanced MACD indicator takes this concept further by plotting two distinct MACD indicators on a single chart, facilitating clear visual correlation betwe
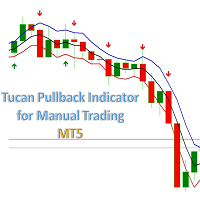
Indicador tipo estrategia (Pullback) para todos los simbolos y periodicidades, preferiblemente desde M30. La estrategia se basa en criterios para los indicadores Rsi, Atr y Force. La banda del canal corresponde al valor del indicador Atr. Los parametros (modificables) por defecto son : a) Precio = Median price b) Metodo de promedio = Simple c) Periodo promedio = 3 d) Coeficiente del indicador Atr = 1.0
BUY when there is a Green Arrow. StopLoss below the bottom line of the channel. SELL

All Symbols AND All Time frames Scan
Document Introduction
A breakout refers to when the price of an asset moves above a resistance zone or moves below a support zone. A breakout indicates the potential for a price trend to break.Break provides a potential business opportunity. A break from the top signals to traders that it is better to take a buy position or close a sell position. A breakout from the bottom signals to traders that it is better to take sell positions or close the
¿Sabe usted por qué MetaTrader Market es el mejor lugar para vender estrategias comerciales e indicadores técnicos? Con nosotros, el desarrollador no tiene que perder tiempo y fuerzas en publicidad, protección del programa y ajustes de cuentas con los compradores. Todo eso ya está hecho.
Está perdiendo oportunidades comerciales:
- Aplicaciones de trading gratuitas
- 8 000+ señales para copiar
- Noticias económicas para analizar los mercados financieros
Registro
Entrada
Si no tiene cuenta de usuario, regístrese
Para iniciar sesión y usar el sitio web MQL5.com es necesario permitir el uso de Сookies.
Por favor, active este ajuste en su navegador, de lo contrario, no podrá iniciar sesión.