Indicadores técnicos de pago para MetaTrader 5 - 3

BeST_Hull Single MA Strategy is an Metatrader Indicator based on the famous indicator Hull Mov.Average . This indicator can display the Single HMA Strategy of just 1 Hull MAvg. It uses added internal filters locating the most likely Entries while it can be used as a standalone system or as an add-on to other ones.
Generally the Hull Moving Average (HMA - developed by Alan Hull) is a directional trend indicator . It captures the current state of the market and uses recent price action to determi

"The Squeeze indicator attempts to identify periods of consolidation in a market. In general the market is either in a period of quiet consolidation or vertical price discovery. By identifying these calm periods, we have a better opportunity of getting into trades with the potential for larger moves. Once a market enters into a "squeeze," we watch the overall market momentum to help forecast the market direction and await a release of market energy." The Modified TTM Squeeze Indicator is a modi

The KT HalfTrend is a moving average-based trend indicator that draws zones. It marks a trend shift by drawing bearish and bullish invalidation zones on the chart. It also displays the trend buy-sell strength with arrows on the main chart. The indicator will be flat if no trend indicates accumulation, temporary price, or distribution zones. If there is a trend, there will be a slope in that direction. The trend signals are substantial if the slope is steep, either to the upside or the downside.

Desgloses de niveles de precios, estadísticas avanzadas, cálculo de TakeProfit y 3 tipos de notificaciones. Beneficios: No vuelvas a dibujar tus resultados Señal estrictamente al cierre de la vela. Algoritmo de filtrado de desglose falso Va bien con cualquier estrategia de tendencias. Funciona en todas las herramientas y series temporales. Manual e instrucciones -> AQUÍ / Resolución de problemas -> AQUÍ / Versión MT4 -> AQUÍ Cómo operar con el indicador Operar con AW Breakout Catcher
BUY INDICATOR AND GET A PIVOT POINT EA FOR FREE AS A BONUS + SOME OTHER GIFTS! Attention, the MT5 version of this application does not work on strategy tester, only on live accounts or demo accounts on live market. If you need an MT5 demo version of the Indicator send me a private message here: https://www.mql5.com/en/users/italobr ITALO PIVOTS INDICATOR is the best pivot point indicator for strong price reversals and continuations of price movements ever created, and why is that? You

Support And Resistance Screener está en un indicador de nivel para MetaTrader que proporciona múltiples herramientas dentro de un indicador. Las herramientas disponibles son: 1. Cribador de estructura de mercado. 2. Zona de retroceso alcista. 3. Zona de retroceso bajista. 4. Puntos pivotes diarios 5. Puntos de pivote semanales 6. Puntos Pivotes mensuales 7. Fuerte soporte y resistencia basado en patrón armónico y volumen. 8. Zonas de nivel de banco. OFERTA POR TIEMPO LIMITADO: El indicador de so

The ICT Unicorn Model indicator highlights the presence of "unicorn" patterns on the user's chart which is derived from the lectures of "The Inner Circle Trader" (ICT) .
Detected patterns are followed by targets with a distance controlled by the user.
USAGE (image 2) At its core, the ICT Unicorn Model relies on two popular concepts, Fair Value Gaps and Breaker Blocks. This combination highlights a future area of support/resistance.
A Bullish Unicorn Pattern consists ou

The Heikin Ashi Delta Pro leverages the refined elegance of Heikin Ashi candlesticks, renowned for their ability to filter market noise and highlight clearer trends and reversals. Building on a solid foundation, this advanced indicator integrates the Hull Moving Average method, enhancing its precision and responsiveness. Alongside an intuitive alert system, it transforms raw market data into actionable trading insights, empowering traders to make more informed decisions swiftly. Learn more about

I'm excited to introduce you to the fifth bar on Martin Armstrong's Forecast Array - The Trading Cycle .
This innovative tool represents a transverse form of cyclical frequency analysis, offering a unique perspective on market trends.
The model employs a color-coded system for easy interpretation. In this model, green signals the ideal timing for highs, red indicates ideal lows, and yellow signifies a convergence of highs and lows occurring simultaneously. This intuitive approach allows

*Non-Repainting Indicator Bruce Webb Explains How To Use Bruce's Price Predictor In Detail And Free Forex Strategy https://youtu.be/hfoB1tZZpTo Bruce's Price Predictor is an indicator that shows precise price reversals. A great arsenal to add to any chart. Bruce's Price Predictor points price reversals with high degree of accuracy and it is great for scalping on the 1min time frame, Or swing trading on the 1hr time frame. Buy and sell arrows are shown on the chart as for entry signals. They do

This indicator shows the engulfing pattern, which is the most direct manifestation of capital flow. Engulfing Pattern is a common price reversal pattern in technical analysis, which usually appears at the end of a price trend or at key support and resistance levels. It can be divided into two types: Bullish Engulfing Pattern and Bearish Engulfing Pattern. Bullish Engulfing Pattern feature: Previous K-line: This is the negative line of a small entity (the opening price is higher than the closing
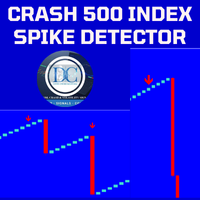
Spike Detector for Boom and Crash Indices
The Spike Detector is specifically designed to cater to the unique needs of traders in the Boom and Crash indices markets. Optimized for M1 (1-minute) and M5 (5-minute) timeframes, this tool ensures you receive timely and actionable insights. Below, you'll find a comprehensive guide on its key features, advantages, installation process, and how to use it effectively.
Key Features and Advantages
1. Non-Repainting: The Spike Detector guarantees accu

Our Spike Detector is specifically engineered to cater to the unique needs of traders in the Boom and Crash indices markets. This tool is optimized for M1 (1-minute) and M5 (5-minute) timeframes, ensuring you receive timely and actionable insights.
Key Features:
1. **Non-Repainting**: Our detector guarantees accuracy with non-repainting signals, ensuring your data remains consistent and reliable. 2. **Push Notifications**: Stay updated with real-time push notifications, so you never miss a

This indicator determines the short-term and long-term trend. The analysis is based on the selected timeframe. Indicator shows the points of opening deals for sale or purchase, and also indicates the direction of the trend at: Short term Long term
This indicator not only signals an immediate purchase or sale. It indicates short term and long term trend. The indicator allows you to examine in more detail the real and historical market trends!

The Quantitative Qualitative Estimation (QQE) indicator is derived from Wilder’s famous Relative Strength Index (RSI). In essence, the QQE is a heavily smoothed RSI.
Modification of this version: ( converted from tradingview script by Mihkell00, original from Glaz)
So there are Two QQEs. One that is shown on the chart as columns, and the other "hidden" in the background which also has a 50 MA bollinger band acting as a zero line.
When both of them agree - you get a blue or a red bar.

The double top bottom pattern is arguably one of the technical analysis's most popular chart patterns. These patterns are used to capitalize on recurring patterns and identify trend reversal patterns, thereby creating well-placed entry and exit levels. The KT Double Top Bottom is based on these patterns and fine-tunes the trade signal development process for traders.
Features
It's based on one of the most reliable trading patterns and brings some fine-tuning and automation to the process. A

Addition to the standard Relative Strength Index (RSI) indicator, which allows to configure various notifications about the events related with the indicator. For those who don't know what this indicator is useful for, read here . This version is for MetaTrader 5, MetaTrader 4 version - here . Currently implemented events: Crossing from top to bottom - of the upper signal level (default - 70) - sell signal. Crossing from bottom to top - of the upper signal level (default - 70) - sell signal. Cro
The KT Risk Management Indicator provides a comprehensive overview of the profit/loss and risk management characteristics of your Metatrader account, offering valuable insights and information. It efficiently categorizes the displayed information at account and symbol levels, ensuring a clear and organized presentation of crucial data. Risk is inherent when trading the Forex market - a reality that seasoned traders acknowledge and beginners quickly realize. To succeed in this volatile market, t

Choose the best trading tool: The impact of news on the exchange rate of a currency pair! As a news source you can use: Terminal calendar or Investing.com website In the second case, you will additionally need the Get News5 utility. The indicator combines well with the Trade maker utility, providing multi-currency trading. Calculates: indices of the impact of current news on currency pairs, taking into account market expectations. actual trend directions for 5 customizable timeframes and levels

The indicator combines the features of both the Tick charts and Volume Bar charts. The mode can be selected in the indicator's settings.
Tick charts measure the number of transactions per bar. To give you an example if you have a 233 tick chart, each bar measures 233 transactions per bar and a new bar is plotted after 233 transactions. You can choose any number of ticks per bar but most traders choose Fibonacci numbers (1, 2, 3, 5, 8, 13, 21, 34, 55, 89, 144, 233...). Volume bar charts are desi

Smart Liquidity Levels is a valuable tool for identifying optimal liquidity levels, enabling retail traders like us to strategically set our stop-loss orders. T he essential tool for traders seeking to maximize their trading success. The liquidity level is a critical component of inner circle trading (ICT). It assists us in determining when and how we should enter the market. Watch the video for detailed instructions. Here's why understanding liquidity levels is crucial in trading and how our

MetaForecast predice y visualiza el futuro de cualquier mercado basándose en las armonías de los datos de precios. Aunque el mercado no siempre es predecible, si existe un patrón en el precio, MetaForecast puede predecir el futuro con la mayor precisión posible. En comparación con otros productos similares, MetaForecast puede generar resultados más precisos al analizar las tendencias del mercado.
Parámetros de entrada Past size (Tamaño del pasado) Especifica el número de barras que MetaForecas

Este tablero es una herramienta de alerta para usar con el indicador de reversión de la estructura del mercado. Su propósito principal es alertarlo sobre oportunidades de reversión en marcos de tiempo específicos y también para volver a probar las alertas (confirmación) como lo hace el indicador. El tablero está diseñado para ubicarse en un gráfico por sí solo y funcionar en segundo plano para enviarle alertas sobre los pares y marcos de tiempo elegidos. Fue desarrollado después de que muchas p
Order Flow Balance is a powerful indicator for Tape Reading (Time & Sales). It helps you analysis Order Flow Market, find where the players are moving in, market imbalance, possible reversal points and much more! The indicator works on MOEX, BM&FBOVESPA, CME, etc. It has 5 different indicator types Cumulative Delta: Also know as Cumulative Volume Delta, it is an advanced volume analysis method where traders can see the daily difference between aggressive buyers and aggressive sellers. Comparison

"Sentiments of traders" in the financial markets is a topic that has been of interest to us for a long time. In time, we could not find the right formula to define these sentiments. We went through many stages in the search for the right methodology - from taking data from external sources to calculate open positions of buyers and sellers to calculating tick volumes, but still we were not satisfied with the results. The calculation of open positions of buyers and sellers from external sources ha

In the "Masters of Risk" trading system, one of the main concepts is related to places where markets change direction. In fact, this is a change in priority and a violation of the trend structure at the extremes of the market, where supposedly there are or would be stop-losses of "smart" participants who are outside the boundaries of the accumulation of volume. For this reason, we call them "Reversal Patterns" - places with a lot of weight for the start of a new and strong trend.
Some of the im

The most crucial price level in any "Volume Profile" is the "Point of Control" . Is the price level with the highest traded volume. And mainly, is the level where the big guys start there their positions, so it's an accumulation/distribution level for smart money.
The idea of the indicator arose after the "MR Volume Profile Rectangles" indicator was made. When creating the "MR Volume Profile Rectangles" indicator, we spent a lot of time comparing the volumes with those from the volume profil

Easy Trend , as the name implies, is an indicator that easily shows the prevailing trend by bringing several indicators into one. The strategy is: when all indicators point in the same direction a signal is triggered. When red, is a signal to sell, when blue, signal to buy. It is that simple :) There are a total of 9 indicators: Moving Average, RSI, CCI, Parabolic SAR, William's Range, Stochastic, MACD, ADX and Heiken Ashi. It is possible to configure each of these indicators to suit your way of

Este indicador de panel de divergencia de múltiples marcos de tiempo y múltiples símbolos envía una alerta cuando se han identificado una o dos divergencias diferentes en varios marcos de tiempo y no en divergencias individuales. Se puede utilizar con todos los marcos de tiempo de M1 a MN. Se pueden mostrar un máximo de 9 períodos de tiempo en el panel de control al mismo tiempo. Es posible habilitar el filtro de tendencia de bandas de media móvil, RSI o Bollinger para filtrar solo las configura

A Swing Failure Pattern ( SFP ) is a trade setup in which big traders hunt stop-losses above a key swing high or below a key swing low for the purpose of generating the liquidity needed to push price in the opposite direction. When price 1) pierces above a key swing high but then 2) closes back below that swing high, we have a potential bearish SFP . Bearish SFPs offer opportunities for short trades. When price 1) dumps below a key swing low but then 2) closes back above that swing low, we have

The most crucial price level in any "Volume Profile" is the "Point of Control" . Is the price level with the highest traded volume. And mainly, is the level where the big guys start there their positions, so it's an accumulation/distribution level for smart money.
The idea of the indicator arose after the "MR Volume Profile Rectangles" indicator was made. When creating the "MR Volume Profile Rectangles" indicator, we spent a lot of time comparing the volumes with those from the volume profil

The indicator displays market profiles of any duration in any place on the chart. Simply create a rectangle on the chart and this rectangle will be automatically filled by the profile. Change the size of the rectangle or move it - the profile will automatically follow the changes.
Operation features
The indicator is controlled directly from the chart window using the panel of buttons and fields for entering parameters. In the lower right corner of the chart window there is a pop-up "AP" but

Este indicador encuentra cuñas , que son patrones de continuación identificados por líneas de tendencia convergentes que rodean un período de consolidación de precios. Señala intercambios utilizando una ruptura de donchian junto con la ruptura de formación. [ Guía de instalación | Guía de actualización | Solución de problemas | FAQ | Todos los productos ] Fácil de usar Colores y tamaños personalizables. Implementa señales de arranque Implementa alertas de todo tipo.
Uso óptimo Para ver cuñas

What Is Market Imbalance? Market Imbalance, also known as "IPA" or Improper Price Action, is when price moves so quick in one direction with no orders on the other side of the market to mitigate the price movement. We all know Big Banks, or "Smart Money", can move the market by placing huge orders which in turn can move price significantly. They can do this because Big Banks are the top 10 Forex traders in the world . But unfortunately, the Big Banks cannot leave these orders in drawdown and mu

Very powerful indicator! converted from TradingView with upgraded alerts and added notifications. Ideal use in EAs.
Use as a supplementary Indicator to confirm your entries, but it is as good on it's own.
The indicator consists of 3 different Trend Meters and a 2 Trend Bars which are used to confirm trend
How to Use:
The more Trend meters are lit up the better =>>
-more GREEN COLOR at one bar means more confirmation to open buy trade,
- more RED COLOR signals for one bar = more

Este indicador de panel de zona de oferta y demanda de múltiples períodos de tiempo y múltiples símbolos envía alertas cuando el precio ha alcanzado una zona de oferta / demanda. También es posible usarlo para recibir alertas sobre dobles techos / fondos regulares en lugar de zonas. Se puede utilizar con todos los marcos de tiempo de M1 a MN. Se pueden mostrar un máximo de 9 períodos de tiempo en el tablero al mismo tiempo. Es posible utilizar filtros de RSI, divergencia (MACD, OsMA, RSI

Was: $99 Now: $34 Blahtech Daily Range indicator displays the average daily range alongside the individual session ranges. Using the daily open price as a reference the indicator shows fixed range and dynamic range targets as lines on the charts. These lines clearly show when the average range has been exhausted. Daily and session ranges can be useful for confirming entries or setting targets and is an excellent odds enhancer for many trading systems. Links [ Documentation | Install |

Este es un indicador de sesiones de negociación que puede mostrar todos los niveles (Apertura-Alto-Bajo-Cierre) durante cuatro sesiones. El indicador también puede predecir los niveles de sesión. Las sesiones se pueden dibujar con líneas o rectángulos (vacíos o rellenos), las líneas se pueden extender a la siguiente sesión. Puede ocultar/mostrar fácilmente cada sesión presionando las teclas de acceso rápido (de forma predeterminada, '1', '2', '3', '4').
Puede ver líneas ASR (rango de sesión

¿Tiene un indicador realmente bueno... pero desearía que tuviera alertas? ¿Le resulta agotador mirar de cerca un indicador para ver si le ha dado una señal? ... Entonces, ¡este indicador puede ser para ti!
Universal Alerts analiza uno de los indicadores de su gráfico y proporciona alertas cuando dan una señal, de acuerdo con sus propios parámetros. Después de configurar este indicador, se mostrará un ícono cada vez que haya una señal de compra/venta, y cualquier señal que venga a continuación

This indicator builds upon the previously posted Nadaraya-Watson smoothers. Here we have created an envelope indicator based on Kernel Smoothing with integrated alerts from crosses between the price and envelope extremities. Unlike the Nadaraya-Watson estimator, this indicator follows a contrarian methodology.
Please note that by default this indicator can be subject to repainting. Users can use a non-repainting smoothing method available from the settings. The triangle labels are designed

Flag Pattern pro is a Price Action (PA) analytical tool that scans the continuation patterns known as "Flag and Pennant Patterns" .
Flag and Pennant patterns are continuation patterns characterized by a move in a previous trend direction after a shallow retracement usually below 50% of the original move . Deep retracements can however be sometimes found at the 61.8 % levels. The original move is know as the flag pole and the retracement is called the flag.
Indicator Fun

The Forex Master Pattern is an alternative form of technical analysis that provides a framework which will help you to find and follow the hidden price pattern that reveals the true intentions of financial markets. This algorithm here does a good job detecting the Phase 1 of the Forex Master Pattern cycle, which is the contraction point (or Value).
On Phase 2 we get higher timeframe activation (also called Expansion), which is where price oscillates above and below the average price defined

The indicator draws supply and demand zones. The zone timeframe can be set independently of the chart timeframe. For instance, it is possible to set M5 zones on an H4 chart. The importance of zones can be adjusted using the zone strength parameter. Demand zones are displayed if at least one candle in the range of the zone is entirely above the zone. Similarly, supply zones are displayed if at least one candle within the zone is entirely below the zone.

One of the most powerful and important ICT concepts is the Power of 3. It explains the IPDA (Interbank Price Delivery Algorithm) phases. PO3 simply means there are 3 things that the market maker's algorithm do with price:
Accumulation, Manipulation and Distribution
ICT tells us how its important to identify the weekly candle expansion and then try to enter above or below the daily open, in the direction of the weekly expansion.
This handy indicator here helps you keep track of the weekly

An indicator based on candlestick patterns
To catch short-term and long-term trends
If it gives a signal in the direction of the trend, it is long term
And if it gives a signal in the opposite direction of the trend, it is short term
Too many signals
Can be used in all symbols
Can be used in all time frames
Attributes: Too many signals Can be used in all symbols Can be used in all time frames Simple settings Simple and fast usage With author lifetime support
Settings: Candle back: Th
The idea of this trading system from the EMA with a Mediante price from the EMA indicators is based exactly 100% from Ripster47 trading system, me is just the person to create it on the MT5 platform, but with alerts for your own buy/sell settings. Hereby I make a copy from Ripster47 explanation for using that system: " EMA Cloud By Ripster
EMA Cloud System is a Trading System Invented by Ripster where areas are shaded between two desired EMAs. The concept implies the EMA cloud area

To get access to MT4 version please click here . This is the exact conversion from TradingView: "ZLSMA - Zero Lag LSMA" by "veryfid". This is a light-load processing indicator. This is a non-repaint indicator. Buffers are available for processing in EAs. All input fields are available. You can message in private chat for further changes you need. Thanks for downloading
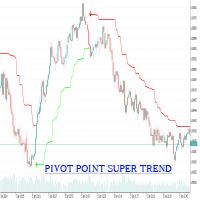
Introducing the Pivot Point SuperTrend MT5 version of the Trading View indicator by LonesomeTheBlue.
A revolutionary script designed to optimize your trading strategies by combining the power of Pivot Points with the precision of SuperTrend indicators. This unique algorithm offers an enhanced approach to identifying and staying within trends, delivering unparalleled performance in today's dynamic markets.
Key Features: Enhanced Trend Identification: By integrating Pivot Points and calculat

This all-in-one indicator displays real-time market structure (internal & swing BOS / CHoCH), order blocks, premium & discount zones, equal highs & lows, and much more...allowing traders to automatically mark up their charts with widely used price action methodologies. Following the release of our Fair Value Gap script, we received numerous requests from our community to release more features in the same category. "Smart Money Concepts" (SMC) is a fairly new yet widely used term amongst price a

The indicator is a trading system for short-term trading.
Scalper Assistant helps to determine the direction of the transaction, and also shows the entry and exit points.
The indicator draws two lines (possible points for opening positions).
At the moment of the breakdown of the upper line up (and when all trading conditions are met), an up arrow appears (a buy signal), as well as 2 goals.
At the moment of the breakdown of the lower line down (and when all trading conditions are met), a do

Elevate Your Trading Experience with the famous UT Bot Alert Indicator!
Summary: The UT Bot Alert Indicator by Quant Nomad has a proven track record and is your gateway to a more profitable trading journey. It's a meticulously crafted tool designed to provide precision, real-time insights, and a user-friendly experience.
Key Features: 1. Precision Analysis: Powered by advanced algorithms for accurate trend identification, pinpointing critical support and resistance levels. 2. Real-time Ale

Range Bars for MetaTrader 5 is a unique tool for conducting technical analysis directly on the charts, as the indicator is an overlay on the main chart and range bars are calculated using real tick data. The trader can place and modify orders directly on the range bar chart (even with the use of one-click trading). Apart from range candles, the indicator also includes the most commonly used technical studies which are 3 moving averages (Simple, Exponential, Smooth, Linear-weighted, Volume-weight

The market is unfair if only because 10% of participants manage 90% of funds. An ordinary trader has slim changes to stand against these "vultures". This problem can be solved. You just need to be among these 10%, learn to predict their intentions and move with them. Volume is the only preemptive factor that faultlessly works on any timeframe and symbol. First, the volume appears and is accumulated, and only then the price moves. The price moves from one volume to another. Areas of volume accumu

This is the forex visual orders tool & forex position size (lot) calculator with intuitive panel. Risk Reward Ratio Indicator works on all kind of symbols: currency pairs, indices, metals, commodities, cryptocurrencies, etc.
If you want to make sure that Risk Reward Ratio Indicator works on your favorite symbols contact us ( visit our profile ) and ask for 7-day free trial to test this tool without limits. If you want to place orders easier, faster and more intuitive? If you like to mark tr

Overview
The Volume SuperTrend AI is an advanced technical indicator used to predict trends in price movements by utilizing a combination of traditional SuperTrend calculation and AI techniques, particularly the k-nearest neighbors (KNN) algorithm.
The Volume SuperTrend AI is designed to provide traders with insights into potential market trends, using both volume-weighted moving averages (VWMA) and the k-nearest neighbors (KNN) algorithm. By combining these approaches, the indicat

Trend Chief es un algoritmo de indicador avanzado que filtra el ruido del mercado, determina la tendencia, los puntos de entrada y los posibles niveles de salida. Use marcos de tiempo más cortos para el scalping y marcos de tiempo más altos para el swing trading. Trend Chief es perfecto para todos los símbolos de Metatrader: divisas, metales, criptomonedas, acciones e índices * Cómo usar el indicador Trend Chief: - Obtenga la tendencia principal mirando los gráficos diarios y H4 - Si la tendenci

Optimice sus decisiones de trading con nuestro indicador de fuerza y sentimiento del mercado y deje de operar contra tendencia! Diseñado meticulosamente para los operadores serios que valoran la información precisa y oportuna, nuestro indicador proporciona una vista de pájaro de los 28 pares principales de una manera muy sencilla. Esta herramienta es capaz de clasificar los pares de divisas basándose en términos de popularidad, fuerza de tendencia alcista o bajista y porcentaje de compradores y
Telegramame https://t.me/ArielfxWyckoff
¿Como funciona? Wyckoff Wizard utiliza análisis de marcos de tiempo múltiples. En términos más simples, el indicador monitorea 2 marcos de tiempo. Un marco de tiempo más alto y un marco de tiempo más bajo. El indicador determina la tendencia analizando el flujo y la estructura de la orden en el período de tiempo más alto (4 horas, por ejemplo). Una vez que se han determinado la tendencia y el flujo de órdenes, el indicador utiliza la estructura del merc

Swing Trading es el primer indicador diseñado para detectar oscilaciones en la dirección de la tendencia y posibles oscilaciones de reversión. Utiliza el enfoque de intercambio de línea de base, ampliamente descrito en la literatura comercial. El indicador estudia varios vectores de precios y tiempos para rastrear la dirección de la tendencia agregada y detecta situaciones en las que el mercado está sobrevendido o sobrecomprado y listo para corregir. [ Guía de instalación | Guía de actualización

Canal King of Dragon, indicador King of Dragon, sistema King of Dragon, King of Dragon MT5, indicador clásico King of Dragon, sistema de deslizamiento King of Dragon, Rey del dragón todo en uno
El sistema de comercio de canales King of Dragon, que es un sistema de comercio de canales clásico, muchos usuarios solicitan encarecidamente la versión MT5. Este programa ha sido optimizado para el rendimiento en múltiples versiones, y ya es un sistema relativamente fluido. 49$ → 59$ Zona roja, tenden

Este es un indicador claro para juzgar máximos y mínimos, y funciona bien para el mercado Oscilante.
Precio promocional 49$ → 59$
características bueno para juzgar los mejores y los peores Sin redibujar, sin deriva Cálculo rápido, sin retrasos Modo de recordatorio enriquecido Se pueden ajustar múltiples parámetros y colores.
parámetro "======== Principal ========" PeriodoAltoBajo1 = 9 PeriodoAltoBajo2 = 60 PeriodoAltoBajo3 = 34 HighLowEMAPeriod = 4 MASignalPeriod = 5 "======== Notificar =

BUY INDICATOR AND GET EA FOR FREE AS A BONUS + SOME OTHER GIFTS! ITALO TRIANGLE INDICATOR is the best triangle indicator ever created, and why is that? Using Geometry and Fibonacci the Indicator works on all time-frames and assets, indicator built after 7 years of experience on forex and many other markets. You know many triangle indicators around the internet are not complete, does not help, and it's difficult to trade, but the Italo Triangle Indicator is different , the Italo Triangle Indi

Divergence indicator 10 different indicators. Finding and displaying classic and hidden divergences.
Indicators in which divergences are searched: MACD MACD Histogram; RSI; Stochastic; CCI; momentum; OBV; VWmacd; Chaikin Money Flow; Money Flow Index. This is a replica of the indicator from the tradingview resource, adapted for the MT5 terminal.
MT4 version available here: https://www.mql5.com/en/market/product/87846
Settings: Bars in history for analysis - number of bars for analysis

El indicador muestra divergencia alcista y bajista. El indicador en sí (como el estocástico normal) se muestra en una subventana. Interfaz gráfica : En la ventana principal, se crean objetos gráficos "línea de tendencia", producidos desde el precio "bajo" hasta el precio "bajo" (para divergencia alcista) y desde el precio "alto" hasta el precio "alto" (para divergencia bajista). ). El indicador dibuja en su ventana exclusivamente utilizando buffers gráficos: “Principal”, “Señal”, “Punto”, “Co

Contact me for instruction, any questions! Introduction The breakout and retest strategy is traded support and resistance levels. it involves price breaking through a previous level. The break and retest strategy is designed to help traders do two main things, the first is to avoid false breakouts. Many false breakouts start with a candlestick that breaks out of a level but ends with an immediate candlestick that brings the price back into the level. The second thing that the breakout and rete

Documentation for connecting Metatrader 5 with Python with a simple drag and drop EA.
A full end-to-end solution ,fully tested ,fast and efficient!
The Pytrader ecosystem consists of a python script and a MT5 or MT4 version EA.
Further for the licensing an indicator is used.
The communication between the python script and the EA is based on sockets.
EA is the Server and the python script the Client .
It is always query(function / python script) and output(data / serv

Un indicador que depende de la liquidez y la media móvil > que te dan el 98% de decisión correcta de compra y venta. y el tiempo para cerrar la operación. El PRECIO aumentará de vez en cuando > y cuando se lance el primer EA dependerá de este indicador será más de 2k. 1-cuándo abrir posiciones de compra o venta (depende del cruce de dos líneas X y los cálculos de puntos dependen del marco seleccionado) (la cruz debe estar fuera del área coloreada) la vela debe tocar la cruz durante o (primero o

El Indicador de Cuadrados de Gann es una herramienta poderosa de análisis de mercado basada en el artículo "Fórmula Matemática para Predicciones de Mercado" escrito por W.D. Gann, que se basa en conceptos matemáticos para el análisis. Incorpora elementos de las técnicas de Gann relacionadas con los cuadrados de 144, 90 y 52, así como el cuadrado de 9. Además, incluye el método del sobre cómo combinar el cuadrado de 9 con canales y patrones de estrellas. Manual del Usuario y Modo de Uso: Antes d

The UT Bot Alert MT5 Indicator is an advanced technical analysis tool designed to help traders optimize their trading performance. This indicator is MT5 conversion of the UT Bot alerts indicator by “QuantNomad “ in Trading View website and some alert methods are added to provide real-time alerts when a trading signal is generated, in order to allow traders to act quickly and efficiently. Key Features: Alert Types: in addition to the terminal pop-up alerts, the mobile notification sends the alert

Dark Oscillator is an Indicator for intraday trading. This Indicator is based on Counter Trend strategy, trying to intercept changes in direction, in advance compared trend following indicators. We can enter in good price with this Indicator, in order to follow the inversion of the trend on the current instrument. It is advised to use low spread ECN brokers. This Indicator does Not repaint and N ot lag . Recommended timeframes are M5, M15 and H1. Recommended working pairs: All. I nst
Compruebe lo fácil y sencillo que es comprar un robot en la MetaTrader AppStore, la tienda de aplicaciones para la plataforma MetaTrader.
El Sistema de pago MQL5.community permite efectuar pagos con ayuda de PayPal, tarjeta bancaria y los sistemas de pago más populares. Además, le recomendamos encarecidamente testar el robot comercial antes de la compra, para así hacerse una idea más completa sobre él.
Está perdiendo oportunidades comerciales:
- Aplicaciones de trading gratuitas
- 8 000+ señales para copiar
- Noticias económicas para analizar los mercados financieros
Registro
Entrada
Si no tiene cuenta de usuario, regístrese
Para iniciar sesión y usar el sitio web MQL5.com es necesario permitir el uso de Сookies.
Por favor, active este ajuste en su navegador, de lo contrario, no podrá iniciar sesión.