Indicadores técnicos para MetaTrader 5 - 27

The Oscar, one of my favorite indicators. This is my enhanced Version of it with more options and better visuals. Many different averaging methods Oscar changes color on signal cross, but not too volatile (3% extra threshold) Adaptable Divisor, higher numbers lead to more signals, due to higher fluctuations. Its a fast but quite accurate trend direction indicator. Play around with the settings and make it match to your setup. GL trading Please follow me on Twitter https://twitter.com/semager and
FREE
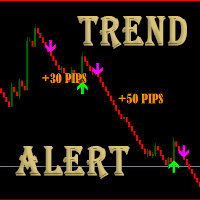
Characteristics of Trend Alert Platform: Metatrader4 Currency pairs: Any (recommended major) Trading Time: Any Timeframe: M5 or higher In-built Alert System Trend Alert is easy to use.
ITS FREE, GIVE ME A GOOD RATING!
Trend Alert indicator can be added to the existing trading systems , or used in combination with other indicators , filters its signals.
Send me a mail for further details.
FREE

The indicator is built on a principle similar to neural networks, and it calculates a multidimensional polynomial. When you install it on a chart or make changes to the indicator's parameters, or when you switch the chart period, the indicator is initially initialized. During initialization, not only the entire period of the chart is recalculated, but also the indicator is self-trained. The indicator's parameters include Sensitivity, Forecast, and degree of harmonization. The indicator theoretic
FREE

Standard PVSR is based on Pivot Points.
Steps to Setup the Indicator: Install the Custom Indicator; Set all the Lines Color, Width and Styles; Set visualization to All Timeframe; and DONE
It can be used for: All Pairs: Forex, Cryptocurrencies, Metals, Stocks, Indices etc. All Timeframe All Brokers All type of Trading Style like Scalping, Swing, Intraday, Short-Term, Long-Term etc. Multiple Chart
-->> For any Type of Support, Guidance, Setup Issue, EA Optimization, Input Setup etc.
FREE

This is the Full Version, to get the free version please contact me.
The free version works on “AUDNZD” and “XAUUSD” charts.
All symbols and time frames scanner
Head and Shoulder
One of the most popular Price Action patterns is the Head and Shoulders pattern. The pattern has three local tops that resemble the left shoulder, head, and right shoulder. The head and shoulders chart pattern appears in all kinds of markets, including Forex, cryptocurrency, commodities, stocks, and bonds. The

An indicator for analyzing different currency pairs simultaneously Forex is a complex market that requires several currency pairs to be analyzed simultaneously Determine the number of currency pairs yourself Determine the currency pair you want to analyze to analyze 4 of the most important and similar currency pairs at the same time. For direct and simple analysis, some currency pairs have changed (EURUSD>>>USDEUR) Do not doubt that to succeed in this market, you must analyze several currency pa
FREE

Este indicador está destinado para reconocer y marcar en el gráfico 1-2-3 patrones de compra y de venta. El indicador ayudará al trader a detectar los fractales de inicio y de señal, indicar los posibles puntos de entrada en el mercado en todos los períodos de tiempo del programa МetaTrader 5. En el gráfico se dibujan las líneas de Fibonachi que indican supuestos objetivos del movimiento partiendo de la teoría de ondas. Las formaciones 1-2-3 adquieren una especial importancia después de la forma
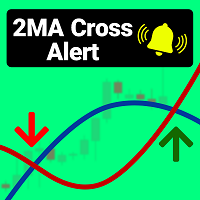
This indicator setup two Moving Average indicators and when the smaller Moving Average (2) crosses the larger one (1) , you will be notified by Popup alert, mobile notification, or Email.
If your strategy works with two Moving Average indicators, you do not need anymore to constantly and tediously look at the chart. You should just add this indicator to the chart according to your required settings, and whenever the defined cross (up or down) is done, it notifies you and you wouldn't miss the

A simple tick indicator of Bid and Ask prices. The period separator (1 minute) is displayed as a histogram. Parameters Show Bid Line - show/hide the Bid line; Show Ask Line - show/hide the Ask line; Show Labels - show/hide the last price values.
FREE

Simple alternate MACD version like the one used in tradingview. Two lines (MACD & signal line) and a histogram. This MACD version can be used in many different ways. Potential trades are the crossing of the MACD & signal line, the crossing of the MACD through the 0-line of the histogram, the MACD being under the 0-line of the histogram or the movement of the histogram itself. A combination of these potential signals on different timeframes can be very precise, but always needs additional confirm
FREE

Calculates pivot levels. It paints the histogram depending on the location of prices relative to these levels.
Parameter values: style - select the type of display (Histogram, Line, Arrow) price - price, has little effect on the final look, but this can be customized timeframe - select a timeframe for calculating levels. color over pivot line - color of everything above the pivot level color under pivot line - color of everything below the pivot level pivot line intersection color - the color
FREE
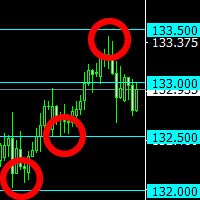
The indicator plots "round" levels, the step of which is specified in the settings. Perfect as an addition to any trading systems.
Very low price - only $30! Round levels often become price support or resistance. MT4 version: https://www.mql5.com/en/market/product/67245
This allows you to either fix a profit, or open a position after a breakdown of the level, work towards a rebound in price. Support: https://www.mql5.com/en/channels/TrendHunter The indicator will be an excellent tool in a
A professional tool for trading - the divergence indicator between the AC and the price, which allows you to receive a signal about a trend reversal in a timely manner or catch price pullback movements (depending on the settings). The indicator settings allow you to adjust the strength of the divergence due to the angle of the AC peaks and the percentage change in price, which makes it possible to fine-tune the signal strength. The indicator code is optimized and is tested very quickly as part
FREE

The new version of MirrorSoftware 2021 has been completely rewriten and optimized.
This version requires to be loaded only on a single chart because it can detect all actions on every symbol and not only the actions of symbol where it is loaded.
Even the graphics and the configuration mode have been completely redesigned. The MirrorSoftware is composed of two components (all components are required to work): MirrorController (free indicator): This component must be loaded into the MAST
FREE

Numa folha qualquer
Eu desenho um sol amarelo
E com cinco ou seis retas
É fácil fazer um castelo
Corro o lápis em torno da mão e me dou uma luva
E se faço chover com dois riscos, tenho um guarda-chuva
Se um pinguinho de tinta
Cai num pedacinho azul do papel
Num instante imagino uma linda gaivota a voar no céu
Vai voando, contornando
A imensa curva norte-sul
Vou com ela viajando
Havai, Pequim ou Istambul
Pinto um barco à vela
Branco navegando
É tanto céu e mar num beijo azul
Entr
FREE

Displays previous months Highs & Lows. You can set the number of months to display levels for, also the line style, color and width. This is very useful for traders using the BTMM and other methods like ICT. I'll be creating more indicators for MT5 for the BTMM. Send me your suggestions to my Telegram: https://t.me/JDelgadoCR Take a look at my other products at: https://www.mql5.com/en/users/jdelgadocr/seller
FREE

Free version of https://www.mql5.com/en/market/product/44815 Simple indicator to calculate profit on fibonacci retracement levels with fixed lot size, or calculate lot size on fibonacci levels with fixed profit. Add to chart and move trend line to set the fibonacci retracement levels. Works similar as default fibonacci retracement line study in Metatrader. Inputs Fixed - select what value will be fix, lot or profit (available in full version, lot is set on free version) Fixed value - value tha
FREE

Indicador de noticias. Muestra la tasa de interés de 12 países (Australia, Brasil, Canadá, México, zona euro, Reino Unido, India, Nueva Zelanda, Suiza, Estados Unidos, Corea del Sur, Japón). Ayudará a analizar el impacto de la tasa de interés en el tipo de cambio. Tiene sentido establecer un indicador en grandes plazos. Para mejorar el contenido de la información, tiene sentido cambiar el estilo de configuración del indicador del país deseado, para que la línea se destaque de la masa total de in
FREE

Session Volume Profile is an advanced graphical representation that displays trading activity during Forex trading sessions at specified price levels. The Forex market can be divided into four main trading sessions: the Australian session, the Asian session, the European session and the favorite trading time - the American (US) session. POC - profile can be used as a support and resistance level for intraday trading.
VWAP - Volume Weighted Average Price.
ATTENTION ! For the indicator to

Esta herramienta profesional de los mejores corredores de bolsa ahora está disponible en la plataforma MetaTrader 5 . El indicador Actual depth of market chart visualiza la Profundidad del Mercado (DOM, por sus siglas en inglés) en forma del histograma que se coloca en el gráfico del precio y se actualiza en tiempo real. ¡Atención! ¡La actualización reciente ha sido hecha a petición de nuestros usuarios!
Ahora el indicador Actual Depth of Market visualiza la relación actual de los volúmenes de

The " Pure View " indicator is designed to quickly display and hide indicators on the chart. Description
1. Currently Pure View works with Stochastic, MACD, RSI indicators 2. Displaying and hiding indicators occurs using hot keys 3. The key combination Shift + C will display or hide the "Stochastic" indicator on the chart 4. The key combination Shift + V will display or hide the "RSI" indicator on the chart 5. The key combination Shift + B will display or hide the "MACD" indicator on the chart
FREE

This indicator show color of trend. And combined with the average line, but be used on the hightest price and the lowest of the 26 period. The target entry at the level and the point of the route between 2 line for entry and exit position This is a first version, many problems is not supported and fine. Expected a contected from your friends To continue to follow the good products
FREE

Indicador Monte Carlo Simulation Indicador faz uma regressão linear nos preços de fechamento do ativo escolhido e gera uma simulação de Monte Carlo de N preços aleatórios para definir 3 níveis de sobrecompra e 3 níveis de sobrevenda. O primeiro processo é a Regressão Linear dos preços de fechamento do ativo, no qual é regido pela equação: Y = aX + b + R Onde Y é o valor do ativo escolhido, X é o tempo, a é a inclinação da reta, b é a intersecção da reta e R é o resíduo. O resí
FREE

RSI Scanner, Multiple Symbols and Timeframes, Graphical User Interface An indicator that scans multiple symbols added from the market watch and timeframes and displays result in a graphical panel. Features: Multi symbol Multi timeframe Alerts and Notifications Live Monitoring Sorting modes One click to change symbol and timeframe Inputs for RSI and scanner settings
FREE

Highly configurable Average True Range (ATR) indicator.
Features: Highly customizable alert functions (at levels, crosses, direction changes via email, push, sound, popup) Multi timeframe ability Color customization (at levels, crosses, direction changes) Linear interpolation and histogram mode options Works on strategy tester in multi timeframe mode (at weekend without ticks also) Adjustable Levels Parameters:
ATR Timeframe: You can set the lower/higher timeframes for ATR. ATR Bar Shift: y
FREE

Spread Indicator MT5 - NS Finanças. (http://www.nsfinancas.com.br) Auxiliary tool to give Spread visibility to all types of currency pairs and timeframes. The labels are well positioned in the upper right corner of the chart so as not to disturb the visualization during the trade, however it is also possible to drag the indicator to the best place on your screen. In addition to the current spread, this indicator also monitors the minimum, maximum and average spread of the selected currency pair
FREE

El indicador dibuja dos media móviles simples usando los precios High y Low. La línea MA_High se muestra cuando la media móvil se dirige hacia abajo. Se puede utilizarla para colocar la orden Stop para la posición de venta. La línea MA_Low se muestra cuando la media móvil se dirige hacia arriba. Se puede utilizarla para colocar la orden Stop para la posición de compra. Este indicador se utiliza en el Asesor Experto TrailingStop . Parámetros Period - período de cálculo de la media móvil. Deviati
FREE

Volume Cross Over is an indicator that measure positive and negative volume flow in a financial instrument, such as a stock, commodity, or index. It is base on the idea of On-Balance Volume developed by Joseph Granville. However instead of trending lines, this indicator shows volume cross over. When the closing price of an asset is higher than the previous closing price, then the Bull volume is greater than zero and Bear volume is negative. It suggests that buying volume is dominating, and
FREE
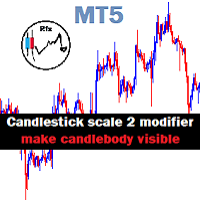
Chart Candlestick scale 2 zoom will visible instead of just a tiny unrecognized line make it look neat and tidy Instruction.
If you don't like the candles colors, you can do so by changing color. read below:
-Colors must be changed in the indicator setting.
-It won't change through the Chart properties to modify.
-After changing the color, save it as template so it wont change the colors to default value.
FREE

La barra Time End de MMD es un indicador simple que muestra la cantidad de segundos restantes en los tres intervalos seleccionados. De acuerdo con la metodología MMD, el momento en que ocurre un movimiento direccional del precio es importante. Este indicador le permite usar esta relación de manera más efectiva en el comercio de Forex y Futuros.
Descripción de la funcionalidad:
Marco de tiempo 1 Período: definición del primer intervalo de tiempo Time Frame 1 Color - especificando el color pa
FREE

The concept is simple: Plotting Price behavior within several periods of time. Some Symbols behave very well during the trading day - with this I mean Intraday trading - and this behavior ends up plotting effectively well with the proposed Exponential Moving Averages in this indicator... Obviously that this behavior could not be seen in all Symbols, but you can give it a try... Just drop this indicator in a chart and you will see for yourself...
This indicator is intended for "Feeling the Trend
FREE

This is a rate of change chart from the baseline. features. comparison of max 5 symbols. free baseline with drag. free timeframes of the sub window. reverse chart selectable if you need.
i.e. set symbols "-US100" notes In the sub window, you can't believe datetime on the chart, because the numbers of bars are different. You can check the baseline if you click symbol name. The dragged baseline is temporary. You must set it to indicator's parameter if you need.
FREE

This indicator is designed based on the Moving Origin indicator
When the moving origin indicator breaks the price, this indicator gives a signal
It is useful for better viewing of signals and analysis on them
Attributes: Can be used in all symbols Can be used in all time frames Too many signals Simple and quick settings Easy way to work
Settings: period: like moving average settings alarmShow: If you want to receive an alert in Metatrader after receiving the signal, enable this setting
a
FREE

BeST_Trend Exploiter is a Metatrader Indicator based on a smart proprietary algorithm which can detect the market Median Trend while it filters out the noise providing Buy and Sell Signals and also wherever it is applicable it provides us with TP Levels of High Probability. Additionally as it has Built Inside all the necessary features it can be used as a Complete Strategy of very Impressive Results. Essential Advantages of the Indicator
Clear and Easily Understandable trading rules. Real

--- StudentK Sync Chart --- 1. Move charts at the same time 2. Cross check among different Symbols and Timeframes 3. Plan your own trading strategies
=== Simple (Free) Version ===
1. Allow USDJPY only
2. Support M5 and M15
3. * Contact StudentK for unlocking all timeframes *
--- Context --- StudentK is not indicated as a master or K Sir for knowledgeable person who claims for winning all the time. (But lots of traders should know the fact that it is rarely truth, especially in fluctuat
FREE

It is the very same classic Stochastic indicator, but with a little twist: NO NAME and data is shown in the sub window. It could be stupid, BUT, if you are running out of space in Micro windows like Mini Charts, where the indicator's name is totally useless, you came to the right place. And that's it! I know it seems stupid but I needed the classical version of Stochastic indicator without that annoying name on my Mini Chart, so I did it that way... The original formula is right from Metaquote's
FREE

This is a multi-timeframe indicator that detects and displays support and resistance (S&R) lines using the ZigZag indicator.
Features
The support and resistance lines are not redrawing. The indicator is capable of adding new support and resistance levels as they appear. Each S&R line has a tooltip that displays the price level and start time. Shows the start time, price level and number of touches of all S&R lines when pressing the shortcut Shift+I Save time for multi-timeframe analysis on

El volumen es un indicador muy utilizado en el análisis técnico, sin embargo, existe una variación que es incluso más útil que el volumen en sí: la media móvil del volumen.
No es más que un promedio móvil aplicado al popular indicador de volumen.
Como su nombre lo indica, Volume + MA sirve para mostrar el volumen de transacciones (compras y ventas ejecutadas) de un determinado activo financiero en un momento dado junto con la media móvil de ese mismo volumen a lo largo del tiempo.
¿Para q
FREE

Привет. Сегодня представляем индикатор корреляции - SynchroWindowTomson. Индикатор в одном окне показывает движение нескольких инструментов, по отношению друг к другу, удобно определять направление и изменение, особенно когда вы работаете с целым портфелем разных инструментов и нужно определить какой из них тянет результат назад и движется в другую сторону. Так же видны точки разворота спреда.
FREE

Что такое MACD? Обычный MACD – это осциллятор хотя его часто называют трендовым индикатором, или даже «трендовым осциллятором». Происходит это потому, что MACD строится на основе показаний двух скользящих средних. Чем отличается MACD DA?
В MACD DA используется специальный ценовой фильтр. Только после фильтрации строится индикатор. Гистограмма отображает степень расхождения двух скользящих средних: если одна удаляется от другой, то растут и столбики гистограммы, если сближаются, тогда столбц
FREE
移動平均線クロス、ボリンジャーと移動平均線のクロス、移動平均線の角度でサイン表示
MT5インジケータ こちらに サイト があります。 このインジケータは3つのパターンでサインを表示(切り替え可能)します。 ① 移動平均線のクロス ② ボリンジャーバンドと短期移動平均線とのクロス ③ ボリンジャーバンドと短期移動平均線とのクロスと、中期移動平均線と長期移動平均線の角度 ⓸ ボリンジャーバンドと短期移動平均線とのクロス(サインを交互に表示) 移動平均線のクロス 指定した短期移動平均線と長期移動平均線のゴールデンクロスでは買いサイン、デットクロスでは売りサインを表示します。 ディフォルトでは短期は5,長期は20となっています。 もちろん変更可能になります。 移動平均線の種類をEMA(指数平滑移動平均線)やSMMA(平滑化移動平均)などに変更可能で適する価格も変更可能になります。 ボリンジャーバンドと短期移動平均線のクロス ボリンジャーバンド(以降BB)と短期移動平均線のクロスでサインを表示します。 ディフォルトではBB+1σと5MAのゴールデンクロスで買いサイン、BB-1σと5MAのデ

Fractals Direction ST Patterns MT5 is a modification of Bill Williams' Fractals indicator, which allows you to specify any number of bars for finding a fractal. In the settings, it is also possible to set the number of points for determining the trend direction. The upward direction is determined if the last upper fractal is higher than the penultimate upper fractal. The downward direction is determined if the last lower fractal is lower than the penultimate lower fractal. This simple indicator
FREE

Moving average indicator to work with the F12 Replay simulation and replay tool.
In this way, the F12 Replay tool now supports the moving average indicator.
F12 Replay: https://www.mql5.com/pt/market/product/38313
This is a product developed by Renato Fiche Junior and available to all MetaTrader 5 users!
Partners: "Águia Traders" team ( Eagle Traders ) by Larissa Sihle #aguiatraders #larissasihle
Input Parameters
Period Shift Method
FREE

VWAP BAR It´s power full indicator of candle by candle when lined up with greate analysis, you have great opportunity, finder defense candle. Is a good ideia from order flow method, now your meta trader 5 inside you time frame chart .
What is the Volume Weighted Average Price (VWAP)?
The volume weighted average price (VWAP) is a trading benchmark used by traders that gives the average price a security has traded at throughout the day, based on both volume and price. It is important
FREE

El indicador ColorCandlesDaily dibuja las velas de diferente color, dependiendo del día de la semana.
FREE

Стратегия форекс «Гора» основана на одном довольно сложном индикаторе. С его помощью генерируются вполне неплохие сигналы и, в принципе, автор указывал возможность торговли и на остальных инструментах, однако, мы решили взять изначальный вариант — торговлю только по GBP/USD. Так же следует сказать, что по ходу развития тренда торговая стратегия пропускает большое количество неплохих точек входа, но это только на первый взгляд. Фильтрация сигналов показала себя достаточно неплохо и в итоге торгов
FREE

i-Orders is a simple indicator to monitor your own trade/analyze others' trades. I use it for a long time and do not imagine a chart without these arrows, lines and trade result numbers. The features allow you to: change the size and location of the control buttons ( Control buttons size , Control buttons corner ), disable display of opened and closed positions ( Show OPENED , Show CLOSED , Show PENDING ), change colors of arrows and lines for profitable and unprofitable buy and sell positions s

Esta es la versión MT5. Compruébyéndolo y si te gusta simplemente disfrutarlo. Pruebe varios valores para encontrar el ajuste que mejor se adapte a su comercio. Señal ascendente si el indicador es de color verde césped y señal bajista si el indicador es gris. Puede utilizar la propia línea para trailing stop al abrir órdenes. Esto es sólo una herramienta. Un complemento. No es una estrategia. Combínalo con tu propio análisis Sólo tienes que descargarlo y probarlo, es gratis.
FREE

A flexible BB indicator You're no longer limited to the built in default of using BB off a SMA method, now you can choose from: SMA - SMMA - EMA - LWMA - ADAPTIVE - FRACTAL ADAPTIVE - DEMA - TEMA - VARIABLE INDEX DYNAMIC
You now also have 2 standard deviation levels. A more featured version is available with 5 deviation levels, color gradients to lines and filling as well as candles, with full alerts too: Bollinger Bands Max MT5
Options: - MTF - 9 choices of MA to base the BB off
- 2 adjust
FREE

Description of ADTGroup_Oscillator.mq5 Indicator
The ADTGroup_Oscillator.mq5 indicator is a custom technical analysis tool created by avydel. It is designed to provide insights into market trends and potential trading opportunities. Here is an overview of its key features and functionality:
- **Indicator Type:** This oscillator is designed to be displayed in a separate window on the trading platform. - **Indicator Plots:** It utilizes one buffer for plotting data. - **Plot Style:** The indi
FREE

It is the simplest indicator in existence. It has only one function: report the seconds elapsed since the last minute end in a very convenient way, with a label that can be moved in the chart, so that the trader does not have to take his eye off the forming candle. It is used on M1, but also on larger intervals, for those interested in opening/closing positions at the best time. Sometimes an intense movement in the last 10" of the minute gives indications of future trend, and can be used for sc
FREE
Indicador impulsado por IA de regresión lineal:
La regresión lineal es una técnica de inteligencia artificial simple pero efectiva que es la base de redes neuronales complejas. Este indicador se basa en un análisis de regresión lineal e intenta hacer predicciones sobre el próximo evento en el mercado.
Entradas: train_bars: Esto controla la cantidad de barras en las que se recopilará la información de precios y se usará para entrenar la IA dentro de ella. Cuanto mayor sea este valor, mejor y

A professional tool for trading - the divergence indicator between the AC and the price, which allows you to receive a signal about a trend reversal in a timely manner or catch price pullback movements (depending on the settings). The indicator settings allow you to adjust the strength of the divergence due to the angle of the AC peaks and the percentage change in price, which makes it possible to fine-tune the signal strength. The indicator code is optimized and is tested very quickly as part
FREE

This indicator draws price channels. Easy to use. It has various settings, for example, you can configure it to show channels only for buy or sell, you can display trend lines instead of channels. There are many trading strategies that are based on trading in channels, you can trade on the rebound from the borders of the channels, or the breakdown of the channel. Parameters History - the maximum number of bars for building channels; Distance - the minimum distance from one maximum (or minimum

The indicator shows the current spread of the symbol, the minimum, average and maximum values for the current bar in the form of digital, analog and graphic indicators. Has two modes of operation: fixing the system spread, or calculating the spread as the difference between the "Bid" and "Ask" prices on each incoming tick. Parameters The indicator has a single input parameter: Type of calculation - type of spread calculation. It can take the following values: System spread - the spread value
FREE

The commodity channel index (CCI) is an oscillator originally introduced by Donald Lambert in an article published in the October 1980 issue of Commodities magazine (now known as Futures magazine). Since its introduction, the indicator has grown in popularity and is now a very common tool for traders in identifying cyclical trends not only in commodities, but also equities and currencies. The CCI can be adjusted to the timeframe of the market traded on by changing the averaging period. This indi

This is HTF (or MTF) of original Kolier SuperTrend indicator. On this version, you can use 4 Lines of supertrend to define the trend, it will be more powerful. Remade signals on smalls timeframes, the indicator will not repaint if used on small timeframes.

Weiss Wave with lots of functionality and lightweight. The same can be used both in markets that have access to volume (REAL=Contracts, Tick=Business) or points!
You will be able to:
- Analyze the volume of the market by swings made!
- Define the source of the data presented in the graphic, its size and color! Or simply hide this information!
- Define whether or not to show the swings in the graph and how many swings! In addition to setting the trend line color, thi

Several techniques use volume as an important point in the trade. Whether to indicate strength, exhaustion, pullback weakness, among others.
In chief I quote Richard Wyckoff's theory, which said about the importance of looking price and volume.
However, there are several possibilities to filter what is volume that should be noticed.
PVRSA/PVA users use an indicator with specific colors, which assist in identifying the volume and type of movement that the price has made.
Will the high
This indicator show several candle patterns. Very useful to learn and to trading some stocks or forex.
The supported patterns are: bullish spinning top, bearish spinning top, bullish marubozu, bullish force, bearish marubozu, bearish force, bullish kicker, bearish kicker, bullish engulfing, bearish engulfing, bullish harami, bearish harami, piercing line, dark cloud cover, morningstar, evening star, bearish abandoned baby, bullish abandoned baby, three white soldiers, three black soldiers, mo
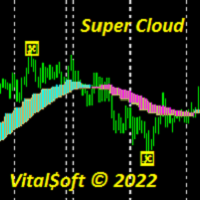
The Super Cloud indicator helps to determine the direction of the trend when trading. Shows on the chart signals about a possible upcoming trend change. The indicator provides an opportunity to detect various features and patterns in price dynamics that are invisible to the naked eye. Based on this information, traders can anticipate further price movement and adjust their strategy accordingly. Works on all timeframes except MN.

This is the famous Sunflower indicator for Metatrader5. This indicator marks possible tops and bottoms on price charts. The indicator identifies tops and bottoms in the asset's price history, keep in mind that the current sunflower of the last candle repaints, as it is not possible to identify a top until the market reverses and it is also not possible to identify a bottom without the market stop falling and start rising. If you are looking for a professional programmer for Metatrader5, please

Do you like trade Technical Analysis like I do? Then you will like this indicator, because it automatically calculates the support and resistance of the asset in simultaneous timeframes, or the famous MTF (Multi Time Frame). In addition to support and resistance, it is possible to have alert signals when the price breaks or touches (or both). Its configuration is very simple. The visual is fully configurable. Enjoy it!
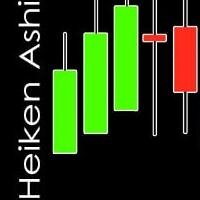
Heiken World es una estrategia de velas heikin ashi , para facilitar la vista del grafico y captar tendencias para todo tipo de par , funciona ala perfeccion en indices sinteticos tanto como para forex ! la estrategia consta en sacarle las velas comunes y colocarle solo las heiken world , mas sumarle algun otro canal como el Critical Channel ya que facilita hacia donde va a rebotar el mercado y poder facilitar el profit , funciona para cualqier tipo de temporalidad !
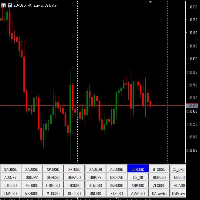
"Symbol Changer" is an indicator created for the Metatrader 5 (MT5) platform, providing the ability to change symbols. To perform all operations with this indicator, use the following characteristics:
Characteristics: Installation: To install the indicator on the MT5 platform, place your .mq5 code in the Indicators folder and restart MT5. Visualization: On the chart, the "Symbol Changer" indicator places special buttons to change symbols. Initial Settings: There are no additional settings for

The best quality application of the famous Super Trend indicator that requires no introduction. It is completely faithful to the original algorithm and powered by the CCI indicator.
- easy to trade - It implements all kinds of warnings. - It implements a multi-timezone dashboard. - It cannot be repainted or backpainted.
Input parameters - ATR Period – This is the average true range period. - ATR Multiplier - The ATR multiplier that defines the trend. - CCI - Makes trend following powerful. -
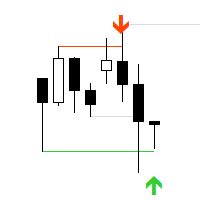
"AV Stop Hunter MT5" is an indicator for MetaTrader 5, which draws entry arrows for long and short after so-called Stop Hunt candles and has several notifications about them. Since this is a smart money concept , the periods H1 and H4 are the best. Increasing volume improves the signal, lines and arrows are then thicker. The MQL5 variant has colored stop-hunting candles. NEW: Signal Buffer: 1, 0 or -1
Definition :
Stop hunting, also known as stop running, is the practice of institutional

El indicador MACD Histogram es una versión actualizada del indicador MACD, diseñada para facilitar a los traders la comprensión de las tendencias del mercado y los cambios de impulso. A diferencia del MACD original, esta versión incluye un histograma, que es un gráfico de barras que muestra la diferencia entre dos líneas: la línea MACD y la línea de señal. Así es como funciona: cuando la línea MACD está por encima de la línea de señal, sugiere que el mercado es alcista, y las barras del histogr

If you consider the extremes of the daily price as important points, this indicator will help in your trades.
Now, instead of manually drawing lines that mark daily highs and lows, you can use the O (HL) ² C Lines indicator.
Thus, the OHLC Lines indicator automatically plots the lines O (Open for the current day), H (High for the current day), L (Low for the current day) and C (Close for the previous day). Plot also the high and low of the previous day.
Thus, we have 4 static lines

Buy and sell signals based on the Day Trade Trap Strategy for failed breakouts, popularized in Brazil by Alexandre Wolwacz (STORMER).
How does the indicator work? The indicator activates the buy and sell signal when their respective conditions are met. For a buy signal, we need a bar making a low lower than the previous day low. On this moment, the signal is plotted with the secondary color. For a sell signal, we need a bar making a high higher than the previous day high. On this moment, the
¿Sabe usted por qué MetaTrader Market es el mejor lugar para vender estrategias comerciales e indicadores técnicos? Con nosotros, el desarrollador no tiene que perder tiempo y fuerzas en publicidad, protección del programa y ajustes de cuentas con los compradores. Todo eso ya está hecho.
Está perdiendo oportunidades comerciales:
- Aplicaciones de trading gratuitas
- 8 000+ señales para copiar
- Noticias económicas para analizar los mercados financieros
Registro
Entrada
Si no tiene cuenta de usuario, regístrese
Para iniciar sesión y usar el sitio web MQL5.com es necesario permitir el uso de Сookies.
Por favor, active este ajuste en su navegador, de lo contrario, no podrá iniciar sesión.