Nuevos indicadores técnicos para MetaTrader 5 - 25

Premium Signal es un oscilador que marca claramente cuando se agota la tendencia y esta por arrancar la nueva lleva 1 linea green que va marcando donde esta llendo el precio y 2 barras 1 de color azul y la otra de color coral la de color azul muestra la fuerza de la vela de subida y el color coral muestra la fuerza de la vela de bajada . se usa en los mercados de forex y en los mercados de indices sinteticos ideal para cualqier temporalidad !

MA Project es un indicador con un conjunto de medias moviles programado en arcoiris donde en 1 cruze te marca tendencia larga para agarrar , es ideal para hacer largos en h1 o h4 ! sirve para los mercados de Forex sirve para los mercados de indices sinteticos tambien funciona muy bien en los volatilitys jumps ! de adapta a cualqier temporalidad ! pero esta programada para hacer largos y agarrar tendencias ! Buen Profit !

Crossing Signal , Es un indicador programado para cazar tendencias y cortos , esta programado tambien para cazar soportes y resistencias , donde da tambien señal sniper con circulo verde y rojo , para la venta o para la compra , da señales con flechas amarillas para la venta , da señales con flechas aqua para la compra ! funciona muy bien para los mercados de forex y indices sinteticos ! se adapta a cualquier temporalidad !

Volatility Premium ! es un oscillador que sirve para cazar la fuerza de la vela y agarrar sniper la tendencia el oscillador te muestra niveles de altura donde capta la fuerza de la vela acompañando la tendencia se ve claramente ! sirve para los mercados de forex sirve para los mercados de indices sinteticos se adapta a todos los pares y a todas las temporalidades ! Buen Profit !

Rsi Project es un Rsi programado para hacer scalping en m1 , m5 y m15 , ideal para cazar revotes y a simple vista el rsi te marca los picotazos en los techos y pisos para agarrar esas velas ! sirve tambien para hacer a largas temporalidades ! Sirve para los mercados de forex sirve para los mercados de indices sinteticos se adapta a todos los pares ideal para los volatilitys y jumps ! Buen profit !

Trend Volatil Es un indicador programado para cazar romputas de indices , viene con 2 colores de ropturas , el primero es el Blue que caza la roptura hacia el ALZA el segundo es el color LightBlue que caza la roptura hacia la BAJA . es muy facil de usar y muy completo , se adapta a los mercados de Forex a los mercados de indices sinteticos ! Se usa en caalquier temporalidad ! Se puede hacer scalping y largos ! Buen Profit !

Drop Volatil , es un indicador donde te marca entradas perfectas con la linea de color tomato , donde ay una linea de bajo de esa que te marca el SL Stop loss , y una linea por arriba que te marca TP Take Profit , es linea es color Blue , donde te marca entrada , tp y sl muy facil de usar ! se usa en los mercados de forex y indices sinteticos todos los pares estan aptos ! se usa en todas las temporalidades tambien ! Facil para hacer scalp o largos Buen Profit !

BB Premium , es una nueva tecnica de bandas de bollinger , pero esta es la 2,0 donde te marca rebotes de venta , rebotes de compra , y ropturas , donde en el medio toca la linea dorada , y muestra señal de venta marca la mancha roja como que ay tendencia bajista , donde rebota en el piso que se sale de la banda , marca señal de compra y marca la mancha gris muy facil de usar y facil para cazar scalp o tendencias largas apta para todas las temporalidades y los mercados de Forex y indices si

Price Channel ! Es un indicador Programado para captar entradas de piso y ventas de techo ! da multiples entradas segun la temporalidad que lo uses sirve para soporte y resistencia tambien ! FUnciona en cualquier temporalidad , funciona para los mercados de divisas de forex ! para los pares de indices sinteticos ! Ideal para los volatilitys y jumps ! sirve tambien para crash y boom ! Buen Profit , World Inversor.

Range Target ! indicador que te marca las agotadas de fuerza de la vela donde toca piso y agarra tendencia sea alza o baja el indicador cuenta con dos lineas de soporte donde te marca el piso y el techo donde en la misma linea te marca la entrada para alza o baja , las lineas cuentan con colores Gold y Blue la linea gold muestra la compra la linea blue muestra la venta sirve para cualquier temporalidad , sirve para los mercados de forex sirve para los mercados de indices sinteticos ! Bu

MMA Target es un indicador que indica sessiones de medias moviles donde ay cruzes claros que marcan entradas perfectas va en un conjunto de colores de agresivo a pasivo donde el cruze de verde arriba del rojo da entrada en compra donde va el cruze de rojo a verde da entrada en venta , ideal para hacer entradas en largo ! sirve para hacer scalping tambien ! sirve para los mercados de forex sirve para los mercados de indices sinteticos ! Buen Profit , World Inversor .

Positions panel
This is a panel for counting current icon holdings. Convenient traders at any time to view the position and profit and loss situation. Perfect for traders who like to hold multiple orders at the same time. Main functions: Position statistics Total profit Average price calculation TP price calculation ST price calculation Positions valume
FREE

Indicador Monte Carlo Simulation Indicador faz uma regressão linear nos preços de fechamento do ativo escolhido e gera uma simulação de Monte Carlo de N preços aleatórios para definir 3 níveis de sobrecompra e 3 níveis de sobrevenda. O primeiro processo é a Regressão Linear dos preços de fechamento do ativo, no qual é regido pela equação: Y = aX + b + R Onde Y é o valor do ativo escolhido, X é o tempo, a é a inclinação da reta, b é a intersecção da reta e R é o resíduo. O resí
FREE

MT4 Version Kill Zones
Kill Zones allows you to insert up to 3 time zones in the chart. The visual representation of the Kill Zones in the chart together with an alert and notification system helps you to ignore fake trading setups occurring outside the Kill Zones or specific trading sessions. Using Kill Zones in your trading will help you filter higher probability trading setups. You should select time ranges where the market usually reacts with high volatility. Based on EST time zone, f
The Essential Trader indicator is more comfortable with whipsaw/ranging market conditions. It is not a complicated trading indicator and can be used on any timeframe with high level of confidence. Besides, it has notifications and alerts. The dotted essential points show spots where you can make immediate entries and benefit from breakout on either side of the region. On the other hand, the color filled points display reversal regions. These are important in that you can trade along the trend
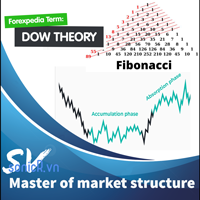
This indicator combine DOW theory with Fibonancy level to determine the structure of financial markets. It include resistance determine to provide an overview of the market. The Dow Theory is an approach to trading developed by Charles H. Dow, who, with Edward Jones and Charles Bergstresser, founded Dow Jones & Company, Inc. and developed the Dow Jones Industrial Average in 1896. In summarize, DOW theory is: + Technical framework that predicts the market is in an upward trend if one of its aver

Supply and demand zones are at the heart of supply and demand trading . These zones are areas that show liquidity at a specific price. The supply zone is also called the distribution zone, while the demand zone is called the accumulation zone. Our indicator automatically draw supply and demand zones in Metatrader 5. It give opportunity to understand trading zone and avoiding risk.

To get access to MT4 version please click here . - This is the exact conversion from TradingView: "Stochastic Momentum Index" By "UCSgears". - This is a popular version of stochastic oscillator on tradingview. - This is a light-load processing and non-repaint indicator. - Buffers are available for the lines on chart. - You can message in private chat for further changes you need. Thanks for downloading

This indicator can be considered as a trading system. It offers a different view to see the currency pair: full timeless indicator, can be used for manual trading or for automatized trading with some expert advisor. When the price reaches a threshold a new block is created according to the set mode. The indicator beside the Renko bars, shows also 3 moving averages.
Features renko mode median renko custom median renko 3 moving averages wicks datetime indicator for each block custom notificatio
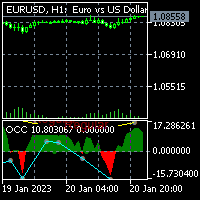
For MT4 version please click here . This is the exact conversion from TradingView: "Open Close Cross Alert R6.2 by JustUncleL" By "JayRogers". - This indicator implements Alerts as well as the visualizations but does not support multi-time frame. - Hidden/Regular divergences supported. - This is a non-repaint and light processing load indicator. - You can message in private chat for further changes you need.

Introduction Poppsir is a trend-range indicator for metatrader 5 (for now), which distinguishes sideways phases from trend phases.
With this tool it is possible to design a trend following-, meanreversion-, as well as a breakout strategy.
This indicator does not repaint!
The signal of the Poppsir indicator is quite easy to determine. As soon as the RSI and Popsir change their respective color to gray, a breakout takes place or in other words, the sideways phase has ended.
Interpret
FREE

Critical Trading, Omni-Channel This indicator lets you create a unique channel from a base type and a range type. Channels are great for spotting over-extensions or the start of new trends. With an ever changing market it is important to create your own edge in the market that no one else has. Let Omni-Channel add to your unique trading strategy. Please contact criticaltrading@outlook.com for more info or advice on adding any other functionality.
FREE

Daily VWAP, continues for a period of hours (eg, 10 hours of history),
with color to indicate change of direction and bands to map good entry and exit points. The indicator was created to map the center of the market, and find good buying moments, trend analysis or market correction points are easily detected, allowing you to understand moments of exhaustion and buying and selling points Copyright (c) <year> <copyright holders> Permission is hereby granted, free of charge, to any person obtain

El Indicador de Tiempo de Sesiones de Trading:
El "Indicador de Tiempo de Sesiones de Trading" es una poderosa herramienta de análisis técnico diseñada para mejorar su comprensión de las diferentes sesiones de trading en el mercado de divisas. Este indicador integrado de forma transparente proporciona información crucial sobre los horarios de apertura y cierre de las principales sesiones, incluidas Tokio, Londres y Nueva York. Con el ajuste automático de la zona horaria, atiende a los traders
FREE

** All Symbols x All Time frames scan just by pressing scanner button ** ***Contact me after the purchase to send you instructions and add you in "Swing scanner group" for sharing or seeing experiences with other users. Introduction: Swing Scanner is the indicator designed to detect swings in the direction of the trend and possible reversal swings. The indicator studies several price and time vectors to track the aggregate trend direction and detects situations in which the market is o

Esta señal DYJ es UN sistema de comercio completo basado en las especificaciones de ATR. Estos indicadores registrarán El Estado actual de cada tendencia de fuerza en cada Marco de tiempo y par de moneda analizado. DYJ power signal al al evaluar estos datos, Cree profesionalmente una visualización de la lista de señales de intensidad de tendencia y punto de entrada. Si alguno de los pares coincide exactamente, aparece una alerta para indicar esta situación. Los datos de la lista incluyen Symbol

¡¡¡ ÚLTIMA COPIA A 75$ ---> Siguiente: 99$ !!! Versión MT4
Golden Hunter ha sido desarrollado para los traders que operan manualmente en los mercados. Se trata de una herramienta muy poderosa formada por 3 indicadores diferentes: Potente estrategia de entrada: Formada por un indicador que mide la volatilidad del par de divisas e identifica la tendencia del mercado. LSMA: Suaviza los datos de precios y es útil para detectar la tendencia a corto plazo. Heikin Ashi: Una vez se adjunta el indic
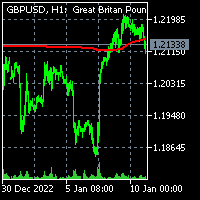
To get access to MT4 version please click here . - This is the exact conversion from TradingView: "Trend Regularity Adaptive Moving Average","TRAMA" By " LuxAlgo ". - This is a light-load processing and non-repaint indicator. - Buffer is available for the main line on chart. - You can message in private chat for further changes you need. Thanks for downloading

This indicator labels swing highs and swing lows as well as the candle pattern that occurred at that precise point. The indicator can detect the following 6 candle patterns: hammer , inverse hammer , bullish engulfing , hanging man , shooting star and bearish engulfing .
The notations HH, HL, LH, and LL you can see on the labels are defined as follows:
HH : Higher high
HL : Higher low
LH : Lower high
LL : Lower low
Setting
Length: Sensitivity of the swing high/low de
Texto traducido con GOOGLE INDICADOR El Signo Para MT5
Indicador de tendencia para el comercio discrecional con tres tipos de estrategias configurables que envía señales comerciales. Indicador para Traders que trabajan, incluso con poca experiencia en la configuración.
HISTORIA
Este indicador nació de mi necesidad, al tener poco tiempo durante el día por motivos de trabajo, no podía realizar operaciones rentables, o perdía excelentes oportunidades.
CARACTERÍSTICAS Marcos de tiempo óptim

the AK CAP toolbox free to use;
it includes the same indicators we use for our daily trading and we think the simpler the better. Lightweight indicator for use on all timeframes. that includes VWAP with vwap value indicator on top right. 3 EMA: FAST, MEDIUM, SLOW the candle timer to show how much time left in a candle.
colors and positions are fully customizable.
enjoy
FREE

Moving Level , Indicador especial para cazar tendencias y hacer scalping ! programado para usarlo en cualquier temporaliadad, cuenta con la extrategia del volumen de tendencia marcando una flecha si es long o short acompañado por los colores azul yellow y rojo cuando marca la linea yellow con la flecha hacia arriba y va acompañado por lineas azules es tendencia alcista Cuando marca la flecha hacia abajo con la linea yellow y va acompañado de lineas rojas es tendencia bajista , Se usa en

This is a derivative of John Carter's "TTM Squeeze" volatility indicator, as discussed in his book "Mastering the Trade" (chapter 11).
Black crosses on the midline show that the market just entered a squeeze ( Bollinger Bands are with in Keltner Channel). This signifies low volatility , market preparing itself for an explosive move (up or down). Gray crosses signify "Squeeze release".
Mr.Carter suggests waiting till the first gray after a black cross, and taking a position in

Profit Aqua , es un indicador que pertenece al proyecto selva que cuenta con 3 indicadores en esta ocacion toca con el indicador profit aqua , que cuenta con la estrategia de una media movil programada profesional mente para facilitarte todo tipo de entrada cuenta con la estrategia de cambio de color , como se ve en la foto cuando cambia de color rojo te esta marcando clara mente una entrada en short cuando te marca el color verde clara mente en long , se puede hacer scalping y a largas temp

Stochastic Selva . cuenta con un nuevo pack que se llama selva en esta ocacion traigo el indicador , stochastic selva que cuenta con la estrategia de rangos altos y rangos bajos para cazar mejor las tendencias y las entradas segun su temporalidad esta programado profesional mente para hacer entradas con altos porcentajes de efectividad , donde toca el techo verde y va cambiando de color a naranja marca entrada en baja donde es alreves y toca el piso con el color naranja a cambiando a verde e

This is the MT5 version of the absolute OCD tool that delivers Position Size Calculator and many more other options of the matured PSI Position Smart Indicator NEW check the FULL Version Including the private ICT tools limited so far until the release of the full 2016 Mentorship Core Content to the public. Indicator type: Money Management Calculator; Forex Position Size Calculator; Fixed or ATR value for Stop Loss and Take Profit levels; Average Position Size Indicator (True Average Price); Acc

Dmi Selva es el ultimo indicador del pack selva en esta ocacion cuenta con el indicador DMI selva , que va de la estrategia del oscillador con el cruze de linea , y los cambios de colores , cuando da un cruze de linea y un cambio de color de gold a lightgreen es un cambio de tendencia viceversa es lo mismo siempre con el cruce de la linea ! sirve para los mercados Forex y indices sinteticos ! Apto para todas las temporalidades ! Buen Profit !

Strength Safari , Primer indicador del pack safari en esta ocacion contamos con un oscilador que da cruces perfectos indicando donde esta la entrada clara en dos puntos esta la linea green y la linea gold donde la entrada te marca donde toca piso o techo en el cruce de lineas la verde encima de la gold marca zona de subida , la gold cruzando la verda marca zona de bajada , ideal para agarrar tendencias largas ! se usa en cualquier temporalidad en los mercados de Forex y Indices Sinteticos

Renko Profesional , Indicador 2 del pack Safari . En esta ocacion cuenta con el indicador renko profesional , que cuenta con la estrategia de soporte , resistencia , linea verde alcista y linea roja bajista . marca muy bien los puntos de entrada y puntos de acumulacion ! Sirve para todas las temporalidades ! Para los mercados de forex y indices sinteticos ! Sirve para todos los pares ! Buen Profit !

Filter Profesional , Indicador 3 del pack Safari , Cuenta con un indicador que es un tipo de media movil con color que te va marcando la entrada perfecta a distintas temporalidades , cuando marca la linea verde se viene tendencia alcista y es entrada en compra , cuando marca la linea gold es tendencia bajista da zona de entrada bajista . Sirve para los mercados de Forex y Indices sinteticos todo los pares ! Todas las temporalidades ! Buen Profit !

Candles Profesional Es el indicador 4 Del pack Safari Cuenta con un oscilador que marca cada punto de las fuerzas de las velas no solo eso si no que lo mide por color para poder entrar perfecto Sirve para hacer scalping y intra day , funciona para los mercados de forex y indices sinteticos sirve para todos los pares ideal para los volatilitys y jumps ! sirve para todas las temporalidades ! Buen Profit !

MA Safari , Indicador numero 5 Del Pack Safari . cuenta con una serie de medias moviles donde llega el cruze y da entrada muy clara , perfecta para grandes temporalidades , para agarrar tendencias largas . sirve para todas las temporalidades . Ideal para mercados de divisas forex y indices sinteticos ! Ideal para volatilitys y jumps , anda en todos los pares ! Buen Profit !!

Bandas Bolinger Profesional , Ultimo indicador del Pack Safari . en este ultimo indicador nos encontramos con una programacion unica , de bandas de bolinger donde se pueden cazar mejor los rebotes en las bandas de arriba y abajo , sirve para los mercados de divisas de forex ! los mercados de indices sinteticos y tambien crypto ! Funciona en todas las temporalidades y todos los pares ! Buen Profit !

This is addition of Effective SV squeeze momentum that add bolliger band and Keltner channel to chart window. Squeeze momentum introduced by “John Carter”, the squeeze indicator for MT5 represents a volatility-based tool. Regardless, we can also consider the squeeze indicator as a momentum indicator, as many traders use it to identify the direction and strength of price moves. In fact, the Tradingview squeeze indicator shows when a financial instrument is willing to change from a trending ma
FREE

The RSI2.0 indicator uses normalized price data and signal processing steps to get a normal distributed oscillator with no skew (mean is zero). Therefore, it can give much better reads than the traditional RSI. Areas/Levels of reversal: Overbought or oversold levels from traditional RSI have no statistical significance, therefore the standard deviation bands are implemented here, which can be used in similar way as possible reversal points. Divergence: As the indicator is nearly normal dist

My Pivot Pro is the Pro Version of the Indicator " My PIVOT " ( Link: https://www.mql5.com/en/market/product/90336 ) This indicator will help you a lot to decide the Market Range and Movement. This Indicator is based on Pivot Lines and Support-Resistance zones. Now we can Plot Standard/Classic; Fibonacci; Demark; Camarilla nd Woodies Pivot Levels as per our requirements.
Steps to Setup the Indicator: Install the Custom Indicator; Set the Pivot Type; Period and Time ( We recommend to use

Indicador Regressão Linear – Par de Ativos Indicador é um oscilador que faz o plot do Resíduo resultado da regressão linear entre os dois ativos inseridos como input do indicador, representado pela fórmula: Y = aX + b + R Onde Y é o valor do ativo dependente, X é o valor do ativo independente, a é a inclinação da reta entre os dois ativos, b é a intersecção da reta e R é o resíduo. O resíduo representa a quantidade da variabilidade que Y que o modelo ajustado não consegue explicar. E os resíduos
FREE

Standard PVSR is based on Pivot Points.
Steps to Setup the Indicator: Install the Custom Indicator; Set all the Lines Color, Width and Styles; Set visualization to All Timeframe; and DONE
It can be used for: All Pairs: Forex, Cryptocurrencies, Metals, Stocks, Indices etc. All Timeframe All Brokers All type of Trading Style like Scalping, Swing, Intraday, Short-Term, Long-Term etc. Multiple Chart
-->> For any Type of Support, Guidance, Setup Issue, EA Optimization, Input Setup etc.
FREE

Indicador Regressão Linear – Par de Ativos - INTRADAY Indicador é um oscilador que faz o plot do Resíduo resultado da regressão linear entre os dois ativos inseridos como input do indicador, representado pela fórmula: Y = aX + b + R Onde Y é o valor do ativo dependente, X é o valor do ativo independente, a é a inclinação da reta entre os dois ativos, b é a intersecção da reta e R é o resíduo. O resíduo representa a quantidade da variabilidade que Y que o modelo ajustado não consegue explicar. E
FREE
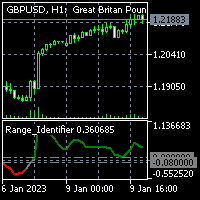
To get access to MT4 version please click here . - This is the exact conversion from TradingView: "Range Identifier" By "Mango2Juice". - All twelve averaging options are available: EMA, DEMA, TEMA, WMA, VWMA, SMA, SMMA, RMA, HMA, LSMA, Kijun, McGinley - This is a light-load processing and non-repaint indicator. - Buffer is available for the main line on chart and not for thresholds. - You can message in private chat for further changes you need.
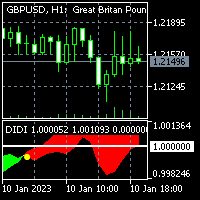
To get access to MT4 version please click here . - This is the exact conversion from TradingView: "Didi Index" by " everget ". - This is a popular version of DIDI index on tradingview. - This is a light-load processing and non-repaint indicator. - Buffer is available for the lines on chart and arrows on chart. - You can message in private chat for further changes you need. Thanks for downloading

Lets dabble a bit into Elliot Waves.
This is a simple indicator which tries to identify Wave 1 and 2 of Elliot Impulese Wave and then projects for Wave 3.
Ratios are taken from below link: https://elliottwave-forecast.com/elliott-wave-theory/ - Section 3.1 Impulse
Wave 2 is 50%, 61.8%, 76.4%, or 85.4% of wave 1 - used for identifying the pattern. Wave 3 is 161.8%, 200%, 261.8%, or 323.6% of wave 1-2 - used for setting the targets
Important input parameters
MaximumNumBars : To calc

The Accumulation / Distribution is an indicator which was essentially designed to measure underlying supply and demand. It accomplishes this by trying to determine whether traders are actually accumulating (buying) or distributing (selling). This indicator should be more accurate than other default MT5 AD indicator for measuring buy/sell pressure by volume, identifying trend change through divergence and calculating Accumulation/Distribution (A/D) level. Application: - Buy/sell pressure: above

Equal Highs and Lows Indicator
Find and Mark Equal Highs and Lows on chart of Selected Multi Time frames. Options:
set min and max bars between Equal High's / Low's bars set max points difference between High's / Low's ( Sensitivity )
Select time frames by buttons on chart Select / Filter only High's or Low's by a button Extend Equal High's / Low's line forward for chart reference
Manual
MT4 version
MT5 version
Other Indicators

Identify Engulfing candle pattern with Arrows & Alert ( built-in RSI filter). This indicator helps you to identify Engulfing candle pattern or Outside bar (OB) on the chart with arrows, along with an alert when a new Engulfing candle appears. Engulfing candle pattern is one of the most important reversal Price Action signals. You can choose between standard Engulfing (Engulfing based on candle body) or non standard Engulfing (Engulfing based on candle high - low )
Alerts can be turned on
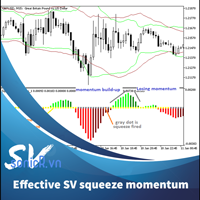
Introduced by “John Carter”, the squeeze indicator for MT5 represents a volatility-based tool. Regardless, we can also consider the squeeze indicator as a momentum indicator, as many traders use it to identify the direction and strength of price moves. In fact, this squeeze indicator shows when a financial instrument is willing to change from a trending market to another that trades in a considerably tight range, and vice versa. Moreover, it indicates promising entries as well as exit points For

Identify Pinbar Candle Pattern with Arrows & Alert (built-in RSI filter).
This indicator helps you to identify Pin bar Candlestick Pattern (or shooting star & hammer pattern) on the chart with arrows, along with an alert when a new Pin bar appears. Pin bar pattern is one of the most important reversal Price Action signals.
You can set Minimum Percent of Wick (or Tail) Length over full bar length (Recommended: 60%, 70%, 75%).
Alerts can be turned on and off: Popup Email Push Notification S

Gold Reaper Scalper.
This is a simple indicator that will help you in scalping gold. It will eliminate the waiting for a setup which will give you more time to do other things. This indicator works best on 5 minute and 15 minute charts. Arrows will appear indicating direction of price. Use proper risk management when entering and exiting trades. Works best on GOLD.

Get the best out of your forex trading experience with our Superb Trend indicator! Our revolutionary technology helps you make smarter and more successful trades, no matter your skill level. With a simple and intuitive interface, you'll be able to analyze trends and make wiser decisions in no time. Stop gambling with your money; start leveraging our Superb Trend Indicator to outperform the market!
Trend Signals: Bullish trend will show as Green line. Bearish trend will show as Red line.
Su

The Price Action Finder Multi indicator is an indicator of entry points that searches for and displays Price Action system patterns on dozens of trading instruments and on all standard time frames: (m1, m5, m15, m30, H1, H4, D1, Wk, Mn). The indicator places the found patterns in a table at the bottom of the screen. By clicking on the pattern names in the table, you can move to the chart where this pattern is located. Manual (Be sure to read before purchasing) | Version for MT4 Advantages
1. Pa
El indicador se utiliza para el auge comercial y Crash, es un superdetective de tendencias. Cuando el mercado tenga una tendencia alcista, utilice la señal fuerte para capturar el pico, cuando esté en una tendencia bajista, use la señal normal para capturar más picos.
El indicador es una base de acción del precio por naturaleza con algunas lógicas matemáticas. Se usa solo para atrapar picos.
El indicador posee la siguiente salida
1. Señal fuerte
2. Señal regular
3. Alerta por correo e
¿Qué es la doble parte superior e inferior?
Los patrones de doble techo y suelo son patrones gráficos que ocurren cuando la inversión subyacente se mueve en un patrón similar a la letra "W" (doble fondo) o "M" (doble techo). El análisis doble superior e inferior se utiliza en el análisis técnico para explicar los movimientos en un valor u otra inversión, y se puede utilizar como parte de una estrategia comercial para explotar patrones recurrentes.
Puedes encontrar la versión MT4 aquí.
E

The volatility scanner indicator is a tool that helps traders identify and analyze volatility in all the market timeframes for the current chart. This way you can find potentially profitable trades on every timeframe for the current symbol.
What It Does? Scan all timeframes to find a volatility contraction. Color the button yellow if there is a volatility squeeze at that timeframe. Clicking on the button instantly changes timeframe.
How To Use It? Just put it on the chart and click on the y
FREE

This indicator shows OutsideBars (OB) and InsideBars(IB) in the chart in candle form.
The colors of the candles can be set individually. Also different colors for bearish and bullish IBs or OBs are possible.
In addition, the color of the wicks or Outlines can also be set.
OutsideBars and InsideBars often show good zones for support or resistance. See the Screenshot for some examples.

Better Period Separators For MetaTrader 5 The built-in period separators feature doesn’t allow users to specify the time period, so you can use this indicator to create more customizable period separators. On intraday charts, you could place period separators at a specific time, you could also place extra period separators at a specific time on Monday to mark the start of a week. On higher timeframe charts, this indicator works the same as the built-in period separators, On the daily chart, per
FREE

Percentile of Historical Volatility and Correlation Coefficient shows if the asset is cheap or expensive based on the volatility. It is used to determine a good entry point. It has two indicators built in: Historical Volatility is ranked percentile wise and its correlation to price action which gives an indication of the direction of a possible future move. Together the both indicators can give good entries and direction. Historical Volatility is a statistical measure of the dispersion of retu

This is an indicator meant to catch trends as they are coming from a retracement .it can be used for any symbol . We can use this indicator to catch spikes or sculp for Boom , Crash ,Range Break . it offers a sell signal and buy signal and an exit signal which can also be used to enter price reversal if you see fit the indicator has a higher time frame filter system which can go up to 2 levels of time filtering which will give you more accurate signals based on the trend ,this feature can be tur
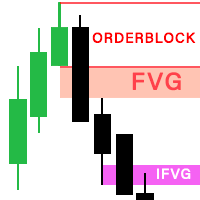
The latest version 2.0 of the FVG Indicator is fully integrated into an all-in-one package, including: Fair Value Gaps (FVG). See more => How to trade with FVG Implied Fair Value Gap (IFVG). See more => How to trade with IFVG OrderBlock (OB). See more => How to trade with OrderBlock The options in the settings section are relatively easy to navigate, and you can even use them right away upon activation without encountering difficulties when using the default configuration. The indicator utilize
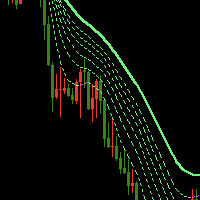
The Waterfall Trend Indicator MT5 uses line regression algorithm, using "Waterfall" in its name is in that it like waterfall when there is a strong down market trend. The indicator draws seven lines, one of which is sold line, others are dash line, the sold line is more stable. Indicator introduction The indicator can effectively filter price noise since it is calculated with line regression. It can be used to analyze market trend and design new expert that is based on trend. When the trend lin

This z-score indicator shows the correct z-score of an asset, as it uses the normalized price data for calculation, which is the only correct way. Z-score is only applicable for normal distributed data, therefore not the actual price is considered, but the normalised returns, which were assumed to follow a normal distribution. Returns are mean reverting and assumed to follow a normal distribution, therefore z-score calculation of returns is more reliable than z-score on price, as price is NOT m
MetaTrader Market - robots comerciales e indicadores técnicos para los trádres, disponibles directamente en el terminal.
El sistema de pago MQL5.community ha sido desarrollado para los Servicios de la plataforma MetaTrader y está disponible automáticamente para todos los usuarios registrados en el sitio web MQL5.com. Puede depositar y retirar el dinero a través de WebMoney, PayPal y tarjetas bancarias.
Está perdiendo oportunidades comerciales:
- Aplicaciones de trading gratuitas
- 8 000+ señales para copiar
- Noticias económicas para analizar los mercados financieros
Registro
Entrada
Si no tiene cuenta de usuario, regístrese
Para iniciar sesión y usar el sitio web MQL5.com es necesario permitir el uso de Сookies.
Por favor, active este ajuste en su navegador, de lo contrario, no podrá iniciar sesión.