Robots comerciales e indicadores para MetaTrader 4 - 44

Scanner Dashboard for Best Heiken Ashi VQZZ Arrows Indicator here: https://www.mql5.com/en/market/product/45900 Updated description and all extra indicators/templates are here: https://abiroid.com/extras/best-heiken-ashi-vqzz-system-extras
Please note that if you are using too many pairs/timeframes, then VQZZ calculations might slow down the dashboard. So be careful not to use too many VQZZ Higher timeframes if you are using too many pairs.
Dashboard Symbols:
Please refer to Screenshots f
This is a general purpose indicator that displays colored lines at fixed and customizable price intervals, entered as parameters. It offers universal, constant, and familiar price ranges that allow quick and precise price analysis of a currency pair. With default parameters, this indicator implements The Quarters Theory , as described originally by Ilian Yotov . [ Installation Guide | Update Guide | Troubleshooting | FAQ | All Products ] Easy to use No optimization needed Customizable price inte
FREE
The SD Indicator is a powerful tool in the world of Forex trading, that combines two classical strategies: Support/Resistance levels and Supply/Demand zones. The indicator helps traders to identify potential trading opportunities in the market with high accuracy.
Support and resistance levels are key price levels where buying and selling pressure converge, leading to potential price reversals. The SD Indicator identifies these levels in real-time and provides traders with a clear picture of wh

The YK-LOT-SIZE is an indicator that displays the total Lot Size and profit/loss of all trade orders for the current symbol on the price chart. It has the following features: Shows the total Lot Size of buy orders (BUY) and sell orders (SELL) on separate lines. Displays the profit/loss of buy orders (BUY) and sell orders (SELL) by calculating the sum of profit, commission, and swap. Users can customize the color of the displayed text through the input parameter. The information is displayed at t
FREE

Индикатор отображает различными цветами на фоне графика три торговые сессии. Открытие - закрытие Лондон, Нью Йорк, Токио по умолчанию. Применение Для успешной торговли важно знать начало и конец торговых сессий с наибольшей ликвидностью, так как именно в это время цена делает самые большие движения.
Особенности Настройки по умолчанию - торговые сессии по Лондону, Нью Йорку, Токио. Возможность выставить свои рамки тоговых сессий Алерт при открытии сессии Показ открытия дня по GMT Настройки для
FREE
THE CONCEPT - EARLY ADOPTER PRICE @ $499.99 ONLY!!!
There are 3 terms that you'll normally come across in trading: Support and Resistance / Supply and Demand Trend Crossovers Many traders use a combination of one or two of the above mentioned to form their unique trading strategies because with them included, traders are able to make sound analysis and therefore predictions. RangeMAX trades based on a strategy that uses ALL THREE elements mentioned above!
SETFILE: https://www.mql5.com/e

This indicator shows the latest untouched support and resistance as horizontal lines. The indicator can show support/resistance from higher timeframes. With this indicator you can e.g. easily see the support/resistance of the timeframes H4, D1 and W1 on a H1 chart, which can be a big advantage while time your entry on H1. This is the FREE version of the indicator: Support Resistance Multi Time Frame The free version works only on EURUSD and GBPUSD!
Parameters referenceTF: the timeframe from wh
FREE

PREVIOUS INDICATOR’S DATA MA CROSSOVER https://www.mql5.com/en/users/earobotkk/seller#products P/S: If you like this indicator, please rate it with 5 stars in the review section, this will increase its popularity so that other users will be benefited from using it.
This indicator notifies and draws an arrow on the chart whenever the MA line has crossed over its previous indicator’s data MA filtered by MA Trend. It also displays total pips gained from all the entry set-ups. Setting · You
FREE
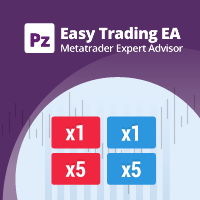
Un asistente comercial simple que permite comprar y vender fácilmente con el apalancamiento deseado. Fue creado para el comerciante eventual o novato e inspirado en plataformas comerciales populares basadas en la web como eToro o Binary.com. Cuenta con un conjunto de botones comerciales que implementan diferentes opciones de apalancamiento y un botón adicional para cerrar todas las operaciones. Todas las operaciones se colocan con un stop-loss de acuerdo con el apalancamiento utilizado. Será pa
FREE

You've probably heard about the Dow trend Theory, where higher highs and lows indicate an uptrend, and lower highs and lows indicate a downtrend. This indicator determines this trend based on the Dow Theory. You just need to enter a number representing the number of candles between extremes. The optimal solution is the number 3, unless you want to have the trend from M5 but you're on M1, then you need to multiply this number by 5. Check various combinations to trade with the trend. In the scree
FREE

Engulfing candlestick patterns are comprised of two bars on a price chart. They are used to indicate a market reversal. The second candlestick will be much larger than the first, so that it completely covers or 'engulfs' the length of the previous bar.
By combining this with the ability to look at trend direction this indicator eliminates a lot of false signals that are normally generated if no overall trend is taken into consideration
FREE
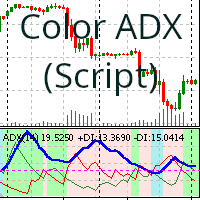
Script (de arrastrar y soltar) que colorea el fondo del indicador Average Directional Movement Index (ADX) según la sea tendencia de compra o venta
El indicador ADX es un indicador técnico que se utiliza para medir la fuerza de una tendencia. Este script (de arrastrar y soltar) colorea el fondo del indicador ADX según la tendencia. El color del fondo se determina en función de los parámetros del script.
Parámetros que puede modificar:
Period: El período de tiempo del indicador ADX. Tre
FREE

Super Buy Sell is a combination of Hedging and Martingale strategy. Buy and Sell at the same time and open order every 20 pips (default setting) with customized Target Profit. It was backtested and optimized using real ticks with high quality. The Expert Advisor has successfully passed the stress test with slippage approximate to the real market conditions. This EA can run on several instruments simultaneously. This EA is recommended for cent accounts.
Real account monitoring https://www.mql5
FREE

The Candle High Low Exit indicator uses the highest high and the lowest low of a range to draw trailing stop lines (orange under buys, magenta over sells) that advance with the trend until the trend changes direction. Moreover, the trailing stop lines are generated to support the order’s trend direction (long or short): In an upward trend, the long trailing stop line (orange line under buy) appears and advances upward until the close crosses under the line.
In a downward trend, the short tra
FREE

Vertical time lines. A simple indicator that draws on the graph vertical lines of time. 1,3,5,10,12,15,20,30,60 minutes. You can change the line color, line style, select a time period from 1 to 60 minutes. Applies to any chart, timeframe. Incoming parameters: Minute_Num = 20; // step 3,5,12,10,20,15,30,60 minutes color Line_Color = clrYellow; // color line Line_Dash = 2; //0,1,2,3,4... solid, dash, dot, dash dot,dash dot dot
FREE

Search for an entry with low risk for trading by Lisek Waves Indicator. Using Lisek Waves Indicator can improve your trading performance. In it’s simplest form, this trading tool make it easy to s earch for an entry with low risk and to manage your trade and risk. Lisek Wave analysis is based on the notion that markets follow specific patterns called waves which are the result of a natural rhythm of crowd psychology that exists in all markets. You can avoid the loss from taking trades that are
FREE

Targets is an indicator to determine potential turning points , targets are calculated to determine levels in which the sentiment of the market could change from "bullish" to "bearish." This indicator can be used in any timeframe and any currency pair: IN CASE YOU DON'T SEE THE INDICATOR WHEN YOU ADD IT TO YOUR CHARTS JUST OPEN THE INDICATOR MENU AND CLOSE THE MENU AGAIN PLEASE TAKE NOTICE: For best results use this indicator as an extra tools after you have completed your regular analysis an
FREE

Hello This EA (expert advisor) will open orders from Telegram "Auto Open orders from Telegram" (Telegram to MT4). Please watch our video for more details: https://www.youtube.com/watch?v=p06o1xgsD5c
download instructions from here https://drive.google.com/file/d/1rwZnvgaWoi3gSkEwsi7s5jeatjJLGTWc/view?usp=sharing
Good luck -------------------------------------------------------------- السلام عليكم هذا الاكسبيرت سيفتح صفقات آلية وفورية من تليجرام (Telegram إلى MT4) يرجى مشاهدة الفيديو لمزيد من
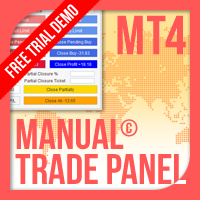
Panel de Comercio Manual EA MT4 es el panel de comercio más sencillo y fácil de usar que puede encontrar para MT4. Tiene todas sus opciones y funciones en una sola superficie, sin necesidad de abrir ventanas o paneles adicionales. Es una utilidad de gestión de pedidos, calculadora de riesgos, cierre parcial y protector de cuenta, ¡todo en una interfaz extremadamente conveniente de usar!
Al utilizar el Panel de Comercio Manual EA MT4 , puede operar mucho más rápido y con mayor precisión que lo

This Robot was created to be used in backtesting and to be able to prove to yourself that it is possible to win in trading, you open and close operations in backtest being able to manipulate Take Profit and Stop Loss.
This means that you will be able to see and interpret your trading. Somos empresa pequeña donde hacemos robots por encargo contactanos y lo haremos posible lo que desees :)
https://t.me/iamrealjokr
FREE

Defining Range ( DR ) and Implied Defining Range ( IDR ) indicator Pro with added features from free version
Show DR and IDR ranges Sessions on the chart for RDR Regular defining range (New York Session)
ADR After defining range (Asian session) ODR Outside defining range (London Session)
Buttons on chart to enable / disable :
Show Imbalance ( IMB ) Show Volume Imbalance ( VIB ) Show Gap's between open and close
Show Standard Deviation ( SD )
Show last 3 Sessions
Strategy for trend trading. The indicator shows entry points and displays TakeProfit and StopLoss levels on the chart, as well as calculates the overall result. ATTENTION! TI Opti Pro – a powerful tool for testing the input parameters for the TrendImprovement indicator will allow you to quickly find the most profitable options for the input parameters. New project.
Description.
It is no secret to anyone that there is no universal indicator that would be profitable on all currency pairs and
FREE

BolingCustom is a Trend indicator designed for all Time frames and all currency pairs. For a better experience, it is recommended to use in time frames above 15 minutes.
Due to its understandable and simple presentation on the chart, even beginners can easily learn how to use it.
If you have any problems or questions, let us know. We will be happy to contact you: Direct massage
How this indicator works is that it shows the trend using a combination of several indicators such as the Bo
FREE
LEADING AND LAGGING INDICATORS DASHBOARD https://www.mql5.com/en/users/earobotkk/seller#products P/S: If you like this indicator, please rate it with 5 stars in the review section, this will increase its popularity so that other users will be benefited from using it.
This dashboard scans all time frames(M1,M5,M15,M30,H1,H4,D1,W1,MN1) and shows up trend and down trend for MACD, PSAR, RSI, STOCHASTIC, MOVING AVERAGE, BOLLINGER BANDS by changing the colours of the relevant boxes. It also shows c
FREE
El indicador Scalper Signal Tarek para mt4 (Metatrader 4) ofrece señales de especulación para cualquier par de divisas en cualquier período de tiempo, incluso en el gráfico diario.
El indicador es muy confiable, liviano y no ralentizará su plataforma comercial.
Las señales aparecen en la ventana principal del gráfico MT4 en forma de flechas de señal de color verde y rojo.
Señal de compra y venta:
Abra una posición de compra cuando la flecha verde se imprima en el gráfico. Abra una posic

Keltner MTF (Not repaint!!!) is a channel indicator that can display price channels from different timeframes on a single chart of quotes. For example, on the H1 chart, you can see at the same time the Keltner price channel from the M15 and H4 timeframe. This tactic makes it possible to more clearly understand the tendency of price movements, to determine trading goals and points for making deals. How the Keltner MTF Indicator Works The Keltner MTF indicator can be used both - for trading in

Concept
Market arranges in Time upcoming Phases according to the present Results of its Interest. Directing Modulations are an Interaction of immanent Periods, which show in Reference to Time cyclic Activity and to Price leveling Activity. PointZero is a projecting Price Mask of this Concept of Time and Price and categorizing developed Price Movements related to their own Range: how far moved ? indicating their Status by marking special Events: when which Action ? setting the Situation in a fu
FREE

In the "Masters of Risk" trading system, one of the main concepts is related to places where markets change direction. In fact, this is a change in priority and a violation of the trend structure at the extremes of the market, where supposedly there are or would be stop-losses of "smart" participants who are outside the boundaries of the accumulation of volume. For this reason, we call them "Reversal Patterns" - places with a lot of weight for the start of a new and strong trend. Some of the imp

Auto ZZ SR Indicator
This indicator automatically draws trend lines using ZigZag top and bottom points. The more ZigZag tops/bottoms that are used, the greater the number of possible combinations. Therefore, the more possible trend lines can be drawn. And vice versa too. The fewer ZigZag tops/bottoms that are used, the lower the number of possible combinations. And therefore, the fewer the possible trend lines can be drawn. The indicator constantly updates the trend lines on the chart as the ma
FREE

Chart Time: - El Indicador Hora del Gráfico es muy simple y fácil, pero puede ser muy importante controlar el tiempo antes de abrir cualquier operación manual. Este indicador muestra el tiempo en el gráfico entre 3 opciones diferentes. Parámetros de entrada : - Mostrar Tiempo : Seleccione todas las opciones de tiempo que desee ver. Hora local (Hora del equipo personal), Hora del servidor (Hora del intermediario) o Hora GMT. Recomendaciones: - Use solo un Indicador de tiempo de gráfico p
FREE

This tools is design to easily forecast the projection of the current trend through the inputs of Zigzag and get out of the market when the trend do not the ability to maintain it's volatility to go further... the indicator gets the initial and final price from the value of zigzag automatically by adjusting the intdepth of zigzag. You can also switch from Projection to Extension from the inputs tab of indicator.
FREE

Super Channels indicator is a channel indicator created by calculating support and resistance levels. It calculates by taking the average of support and resistance levels. After determining the number of candles, it takes the levels of the number of candles and creates an autonomous channel according to these levels. If you want to calculate how many candles, you must enter the number in the parameter section. Also, there are two types of modes in the indicator. The first is to calculate based o
FREE

IceFX Heatmap is a special indicator that shows the places where the price has been staying and ranging over the past few days. These sites will be displayed in a "Heatmap style", with which you can clearly see the main formed bands. The main rates (where the price has "lingered/stayed" much) are indicated in bright colors (in case of black-and-white view) or red color (in case of color view).
Settings Days - the number of days the heat(map) is calculated for. Resolution - resolution rate. 10
FREE

This indicator is based on the ADX indicator and indicates the trend very easily.
You can customize the indicator to your needs: ADXPeriod ADXSignal_Level BarWidth CandleWith HeikenAshi
The Adx color candles indicator is fully FREE and compatible with the other part of the system; the Acc arrow >>>> https://www.mql5.com/en/market/product/33770 ENJOY and check out my other indicator: https://www.mql5.com/en/market/product/32111
FREE
Public Signals using this EA:
https://www.mql5.com/en/signals/1016250 https://www.mql5.com/en/signals/1018964 The EA waits for the first executed order available and then opens a grid of pending stop-type orders in the same direction of the first one The first order that we usually call the master trade can be opened manually, on specified day and or via any other EA, indipendent from this one There is a dedicated Telegram Group with use cases and best settings, feel free to join and ask fo

Harami is a two candle pattern with recent candle formed inside the previous candle's high and low . It represents indecision in the market and is used for breakout price action trading strategy. This indi fires all signals to a dashboard on the chart including pop_up alert, push to phone notification and email. Harami has two types, bullish and bearish pattern. Enter long for bullish Harami and enter short for bearish Harami. Inputs : Currency Symbols: EURUSD,GBPJPY,USDJPY,USDCAD (default) , u
FREE

Tarantula is a trend Expert Advisor that looks for entry points based on the standard Moving Average indicator. It works with two timeframes selected in the settings. The EA looks for the points of trend change and opens an order when the signal matches on different timeframes. All orders are protected by stop loss. However almost all orders are closed by the EA on a signal change.
Parameters SL - stop loss. TP - take profit. OnWork_1 - enable/disable searching for signals on the first timefra
FREE

Are You Better than Monkey? Prove it...
The trade of this EA is based on random output with customizable lot size (use martingale or not), stop-loss, and take-profit levels. Easy to use and Simple Great for benchmarking tests against other EAs or manual trade. Works for ECN/Non-ECN brokers and 2-3-4-5 digit symbols Support us by open My recommended broker. Exness Tickmill robot monkey uses Adx trend filter for fair game no-trade unfavorable market ( you can turn off set adx = 0) . EA starts
FREE

It is another simple information indicator. This indicator shows the current spread of a financial instrument and the value of one point with a volume of 0.10 lot.
About the Spread Spread is the difference between the Ask and the Bid price of an asset in the stock or currency exchange. Let's refer to Central Banks and currency exchange in these banks, in order to understand why Spread is so important in currency trading. In Central Banks, we always see the difference between the buying and the
FREE

King Scalper is a smart ea that uses the Zigzag indicator to find out sensitivity situation of market price. with this point, King Scalper EA automatically create trend line that market movement reacted in this point. with zigzag find the highest and lowest price (support and resistance) and with this point EA trend line. it changes and updates automatically ... if price touches this line expert decide to act with it. BUY or SEll depended on the market situation. you can manage your time that

Double Exponential Moving Average ( DEMA ) is a moving average (MA) that gives the most weight to recent price data.Like exponential moving average (EMA), it is more reactive to all price fluctuations than a simple moving average (SMA) and so DEMA can help traders to spot reversals sooner, because it is faster responding to any changes in market activity. DEMA was developed by Patrick Mulloy in an attempt to reduce the amount of lag time found in traditional MAs. ( TASC_Feb. 1994 ). DEMA can al
FREE

Camarilla Pivots Historical plots the historical data of the camarilla pivot point levels on the chart. The Camarilla Pivot levels was originated in 1989 by Nick Scott. The levels are used as primary support and resistance levels by Intraday traders. The levels are calculated with the following formula: R4 = C + RANGE * 1.1/2 R3 = C + RANGE * 1.1/4 R2 = C + RANGE * 1.1/6 R1 = C + RANGE * 1.1/12 PP = (HIGH + LOW + CLOSE) / 3 S1 = C - RANGE * 1.1/12 S2 = C - RANGE * 1.1/6 S3 = C - RANGE * 1.1/4 S4
FREE

Broken Trends es un indicador para los scalpers y los traders de intradía. El indicador selecciona y muestra en el gráfico las líneas de tendencia en tiempo real. El indicador reacciona en los momentum del precio: las búsquedas de las tendencias empiezan en cuanto la amplitud del momentum supere el límite establecido en el parámetro especial. Además, el indicador puede enviar alertas sonoras cuando el precio cruce la línea de tendencia actual. En modo habitual, el indicador muestra sólo una tend
FREE

CPR Pivot Lines It Will Draw Pivot Point R1,R2,R3 S1,S2,S3 Tc Bc Best Part Is That You Can Even Add Values Of High,Low,Close Manually Also To Get Your All Levels On Chart. So If Your Broker Data Of High ,Low ,Close Is Incorrect Then You Don’t Have To Depend On Them Anymore. You Can Even Modify All Lines Style. It Will Show Line In Floating Style And Not Continues Mess.
FREE
Waddah Attar Statistical Predictor
This indicator show you the Statistical Forecast for any symbol. it depends on a history data . the result show on a new day and still with no change until end of the day . with this indicator you can : know the main direction . know the range of the movement . know high and low in the current day . use indicator levels in any expert you made to auto trade .
Preferably used with main symbols like EURUSD, GBPUSD, AUDUSD, NZDUSD, USDJPY, USDCHF, USDCAD, Gold,
FREE

Close Assistant (CA) is a full featured utility for monitoring and closing a set of positions placed by trader or EA. It closes filtered orders in specified time or level or candle patterns or when a certain profit or loss of the total positions is reached. CA uses Zero Profit Lock function to save deposit when total profit falls to zero. Profit and loss levels can be set in fixed amount of account currency or percentage of balance or equity or margin. CA only monitors and works on filtered po

Telegram Group: Find the link in my profile or contact me
Welcome.
Advanced Semi Auto Trading : You can use the EA at your own will BASED ON YOUR ANALYSIS. ANALYZE THE MARKET and then just press the sell or buy buttons of the EA. The EA will manage the trades based on an advanced algorithm of market analysis,Take profit systems AND A VERY ADVANCED AND SOPHISTICATED OVERLAPPING SYSTEM for avoiding big drawdowns in case YOUR ENTRY is BAD. You can test this in strategy tester and using v

Moving Average Cloud draws 4 MAs on chart simultaneously in histogram style. Indicator uses 4 MAs: slow sma & ema 200 and fast sma & ema 50. the range between 2 slows MAs and Fasts, represented by histograms on the MAs boundaries - creating kind of "cloud" that can be traded by all kind of MA strategies like support & resistance or other... Change of color of the same histogram points to momentum changing.
Combined with other market analysis, can greatly improve trading results.
FREE

GTAS FidTdi is a trend indicator using combination of volatility and potential retracement levels. This indicator was created by Bernard Prats Desclaux, proprietary trader and ex-hedge fund manager, founder of E-Winvest.
Description The indicator is represented as a red or green envelope above or under prices.
How to use Trend detecting When the envelope is green, the trend is bullish. When it is red, the trend is bearish.
Trading Once a trade is opened, GTAS FibTdi shows retracement zones
FREE
Daily Monitoring : The indicator automatically calculates and displays the daily drawdown on your trading chart, allowing you to see how well you're performing on a daily basis. Risk Management : By monitoring daily drawdown, traders can better manage their risk. It helps to keep daily losses within acceptable limits. Real-Time Information : Daily drawdown is updated in real-time, providing accurate and up-to-date information about your trading performance. How to Use: Activate the "Daily Drawd
FREE

The "MACD Trend Follower" is an indicator based on the MACD oscillator. It serves to spot the trend direction by giving it a fixed color until the trend changes (the trend direction colors are customizable). The default MACD settings for the indicator has been changed to adapt to the fast moving Forex market, but they can be changed to suit the trader.
Recommended settings for the indicator : - MACD Fast EMA : 8 Periods. - MACD Slow EMA : 13 Periods. - MACD SMA : 5 Periods.
Indicator inputs
FREE
Counterattack EA is a fully automatic Grid Expert Advisor for Trend Scalping Trading on XAUUSD timeframe M1 but also in others.
Recommendations The Expert is programmed to work on XAUUSD M1, but you can use all others timeframes also. An ECN broker is always recommended A low latency VPS is always recommended. The recommended Leverage is 1:100 or more. The recommended capital is 10000 ($/cent) per 0.01 Lots or more. For higher Lots please test by yourself Please test Demo before you
FREE
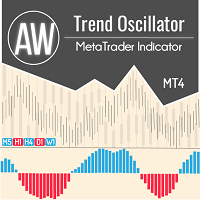
Oscilador de tendencia con sistema de filtrado avanzado. Determina la tendencia, su debilitamiento y fortalecimiento. Tiene un panel de múltiples marcos de tiempo incorporado. AW Trend Oscillator funciona en cualquier período de tiempo y en cualquier símbolo (divisas, índices, petróleo, metales, acciones). MT5 version -> HERE / Problem solving -> HERE Características y Beneficios:
Filtrado de tendencias avanzado Cambiar la sensibilidad del indicador en un clic Configuración fácil Panel de
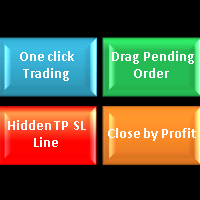
"All in one on Ultimate Panel" Helping in opening and manage orders with "one click trading" system. Note: Demo version for testing can be found here: https://www.mql5.com/en/market/product/11563
Features
1. Speed Trading / One Click Trading. Just set Lot Size, Stop Loss,Take Profit level. Then click the "BUY!" / "SELL!" button. Order will open immediately.
2. Drag line to place pending order. Just click "BUY LINE" or "SELL LINE" button. Then 3 horizontal lines will appear on the
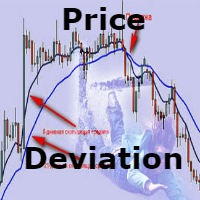
A very simple and intuitive indicator that shows the deviations from the moving average in percent. The default is a 50-day moving average. Just throw on the chart and the indicator build in a separate window under the graph.
This can be very convenient if your strategy implies a certain deviation in percentage of the moving average. It is not very convenient to calculate it manually. The method of averaging, the period of the moving average and at what prices to build all this is selected in
FREE

Indicator description. The “ Alligator Analysis ” ( AA ) indicator allows you to build various (by averaging types and by scales) “ Alligators ” and their combinations, i.e. allows you to analyze the state of the market based on the correlation of this state with a whole range of different " Alligators ". The classic " Alligator " by Bill Williams is based on moving averages and Fibonacci numbers, which makes it one of the best indicators now. The classic " Alligator " is based on
FREE

MTF Heiken Ashi MA is a multiple timeframe Heiken Ashi & Moving Average indicator. Fully customizable for advanced & unique Heiken Ashi & Moving Average calculations.
Key Features Modified appearance and appeal from the traditional using only H eiken Ashi MA bodies. MTF Higher or lower timeframes available making this it great for trends and scalping. There are many settings that can be non-repaint for signals at a new bar and at bar 0.
Inputs Timeframe = PERIOD_CURRENT - timeframe of Movin
FREE

The indicator searches for and displays Doji candlesticks on the chart and signals the appearance of such a candle. The direction of the signal depends on the direction of the previous candles, as the Doji signals a reversal or correction. In addition to the possibility of signaling, the power of the reversal is graphically shown (the more green, the more likely growth, the more red, the price will fall). In the indicator settings, you can change the parameters of the Doji candlestick, the closu
FREE

Daily pivot are relatively important in trading. This indicator have options to select 5 commonly use pivot point calculations. User input Choose Pivot Point Calculation ( Method Classic, Method Camarilla, Method TomDeMark, Method Fibonacci or Method Woodies. ) Choose Applied Timeframe for the calculation (M5, M15, H1, H4, D1, W1 etc) Can be attached to any timeframe Choose color of Pivot point For MT5 version, please refer here: https://www.mql5.com/en/market/product/38816
FREE
¿Qué es el EA Optimizador de Rompimiento? Seamos honestos por un momento. Muchos de los productos en MQL5 son muy prometedores, prometen rendimientos increíbles, comparten las pruebas retrospectivas más asombrosas que haya visto, etc. Sin embargo, normalmente o complican demasiado su funcionamiento o simplemente mienten en su descripción. Este bot es un EA de ruptura. Se utiliza para comprar o vender cuando se rompe un rango en un rango de tiempo de su elección. No es un bot milagroso, pero con

Exaado Capital care If you've been searching for ways to manage Drawdown control, Drawdown Control, Balance protection, or Daily Drawdown Limit related to trading with Prop Firms, FTMO, My Forex Fund, or Funded accounts, then you've come to the right place. Additionally, if you're looking to safeguard your trading account, we can help. Do you struggle with managing your drawdown while trading funded accounts? Our EA is designed specifically for those in your position. Many prop firms have a "Tra
FREE

Robo T El Asesor Experto Robo T es un sistema de comercio sin indicadores. Descripción de la configuración del asesor: Level_ord : distancia desde el precio actual para la colocación de órdenes Buy Stop y Sell Stop pendientes iniciales, por defecto 22. Lot_1 : lote inicial para una serie de compras, por defecto 0.1. Lot_2 : lote inicial para una serie de ventas, por defecto 0.1. TakeProfit : nivel de beneficio, por defecto 30. TSProfitOnly - arrastre solo beneficio. Cuando está desha

The dollar index is a reliable guide for all currency pairs with the participation of the dollar USD. The indicator helps to filter out false reversals and trade strictly according to the trend. Determines the current direction of the dollar index and the trend change point. It warns with an arrow on the chart and an alert about a trend change. Ready to work with default settings. It is possible to adjust the sensitivity of the trend line. Important
It is strongly discouraged to open a trading
Designed especially for GBPUSD 30m market. Minimum trading account 1000 $. The EA trading engulfing candle formations combined with adx indicator. There are 3 main methods of orders placement and management, all three methods are profitable with different results for user to chose. tested on a specific market and timeframe but can operate on other markets ass well.
developed, tested and optimized on " VantageMarkets " platform. Recommended broker > Vantage Account Options: leverage 50
FREE

the kalifx trailing stop ea automatically trails and adjusts the stop-loss level as the market price moves in a favorable direction. Instead of setting a static stop-loss, the trailing stop ea allows traders to “trail” their stop-loss at a certain distance below the current market price. This automated approach helps traders lock in profits while protecting against potential reversals. the trailing stop ea offers more than just basic trailing stop functionality. it includes automatic stop loss
FREE
¡Este es un producto gratuito que puede utilizar para sus necesidades!
¡También aprecio mucho tus comentarios positivos! ¡Muchas gracias!
// Más asesores expertos e indicadores excelentes están disponibles aquí: https://www.mql5.com/en/users/def1380/seller // También puede unirse a una señal rentable, estable y confiable https://www.mql5.com/es/signals/1887493
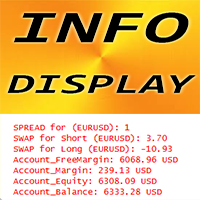
Indicador Forex "INFO Display" para MT4, herramienta de soporte comercial.
El indicador de visualización INFO muestra el diferen
FREE

This is my own developed EA "Pearl"
It trades the whole market and tries to catch reversals. But it tries to trade within the overall D1-trend. It trades currency pairs only
It uses martingale-strategies. It does use flexible grids though. It is free to you when to increase the lotsize of grid levels A grid level can be skipped. If the price overruns a grid level and volatility is still high, a trade will not open. The EA waits till volatility has decreased. Grid distances can be extended b

I was looking for a lean symbol changer. I could not find any. Normally other products hide lot's of screen space. So I developed a very lean symbol changer Just click on the 2 currencies you want to combine. The order does not matter. If you miss some pairs, you can add up to 5 custom symbols. Please make sure, your broker support your custom symbols. Drag an drop the panel with the green button.
In future I plan to include suffix and prefix als well.
FREE

Necessary for traders: tools and indicators Waves automatically calculate indicators, channel trend trading Perfect trend-wave automatic calculation channel calculation , MT4 Perfect trend-wave automatic calculation channel calculation , MT5 Local Trading copying Easy And Fast Copy , MT4 Easy And Fast Copy , MT5 Local Trading copying For DEMO Easy And Fast Copy , MT4 DEMO Easy And Fast Copy , MT5 DEMO MACD is called Convergence and Divergence Moving Average, which is developed from the double e
FREE

MQLTA Candle Timer is an indicator that can show you the details about a symbol/pair and alert you before the close of a candle. Used in swing trading and not only, it can help your strategies knowing and be ready before the close of a candle.
How does it work Simply add the indicator to the chart and set the notifications options. You can load a minimalistic interface or a full interface. The alert will be sent once per candle.
Parameters All the parameters, that you can see in the picture,
FREE
MetaTrader Market es el mejor lugar para vender los robots comerciales e indicadores técnicos.
Sólo necesita escribir un programa demandado para la plataforma MetaTrader, presentarlo de forma bonita y poner una buena descripción. Le ayudaremos publicar su producto en el Servicio Market donde millones de usuarios de MetaTrader podrán comprarlo. Así que, encárguese sólo de sus asuntos profesionales- escribir los programas para el trading automático.
Está perdiendo oportunidades comerciales:
- Aplicaciones de trading gratuitas
- 8 000+ señales para copiar
- Noticias económicas para analizar los mercados financieros
Registro
Entrada
Si no tiene cuenta de usuario, regístrese
Para iniciar sesión y usar el sitio web MQL5.com es necesario permitir el uso de Сookies.
Por favor, active este ajuste en su navegador, de lo contrario, no podrá iniciar sesión.