Indicadores técnicos para MetaTrader 4 - 88
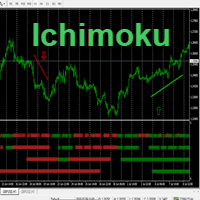
Hello This Indicator will draw Green (Up) and Red (Down) small arrows from Multi TimeFrames based in ( Ichimoku ) to help you to take decision to buy or sell or waiting If there 4 green arrows in same vertical line that's mean (Up) and If there 4 Red arrows in same vertical line that's mean (Down) and the options contain (Alert and Mobile , Mail Notifications). Please watch our video for more details https://youtu.be/MVzDbFYPw1M and these is EA for it https://www.mql5.com/en/market/product/533

En la tercera captura de pantalla (Modo Luz diurna) he marcado 7 elementos que vamos a explicar paso a paso. 1 Tres botones. a) Modo nocturno b) Modo de luz diurna c) Escala fija / Escala ajustada 2 Cuatro botones. a) Dibuje una flecha de compra, línea de compra y el Stop Loss correspondiente basado en ATR. b) Cierre la compra dibujada anteriormente y somnolique una marca de verificación. c) Dibuje una flecha de venta, línea de venta y el Stop Loss correspondiente basado en ATR. d) Cierre la
Are you tired of drawing Support & Resistance levels for your Quotes? Are you learning how to spot Support & Resistances? No matter what is your case, Auto Support & Resistances will draw those levels for you! AND, it can draw them from other timeframes, right into you current chart, no matter what timeframe you are using...
You can also Agglutinate regions/zones that are too much closer to each other and turning them into one single Support & Resistance Level. All configurable.

Indicator without redrawing Divergent MAX The DivirgentMAX indicator is a modification based on the MACD. The tool detects divergence based on OsMA and sends signals to buy or sell (buy|sell), taking into account the type of discrepancies detected.
Important!!!! In the DivirgentMAX indicator, the optimal entry points are drawn using arrows in the indicator's basement. Divergence is also displayed graphically. In this modification of the MACD, the lag problem characteristic of its predecessor

El MT4 ilimitado es un indicador universal adecuado para todos los operadores principiantes y experimentados.
funciona en todos los pares de divisas, criptomonedas, acciones en bruto
MT4 ilimitado: ya está configurado y no requiere configuración adicional
Y ahora lo principal
¿Por qué MT4 ilimitado?
1 falta total de redibujo
2 dos años de pruebas por los mejores especialistas en comercio
3 la precisión de las señales correctas supera el 80%
4 tuvo un buen desempeño en el comerci
Price Alert Indicator PRO Descripción:
Indicador de Alerta de precios configurable para cuando el precio cruce hacia la alza, o hacia la baja. Características:
Se puede configurar en un solo sentido, o en ambos sentidos.
Se utilizan lineas horizontales para indicar el nivel el cual desea ser alertado.
Botones en Pantalla para ocultar o mostrar las lineas. Alertas:
Alerta MT4.
Alerta Push al teléfono móvil.

La tecnología de superposición de reequilibrio (Rebolt) permite al operador visualizar el flujo de dinero de un gráfico a otro. Probabilidad de Rebolt indica la probabilidad de que el dinero haya fluido de un gráfico a otro durante un período de tiempo específico durante una serie de intervalos especificados por el usuario. Cuando Rebolt lee Cyan o Blue, estos son signos de compra válidos durante el tiempo especificado por el usuario o hasta que surja una señal conflictiva. Cuando Rebolt lee Vio

Planned Channel is a non-repainting channel indicator based on moving averages. The Planned Channel takes into account not simple moving averages, but double-smoothed ones, which, on the one hand, makes it possible to more clearly determine the market movement, and on the other hand, makes the indicator less sensitive. The key difference between the Planned Channel indicator and other channel indicators (for example, from the same Bollinger) is that the indicator displays more valuable signals f

The Reflex indicator is very easy to use, this is the key point. The indicator forms arrows (red and blue by default) and is installed in the usual way on any trading symbol with any time interval.
It is a trend and trading signal indicator based on the principle of combined analysis of calculated pivot points within a channel as well as overbought and oversold levels.
Indicator advantages High accuracy; Work with any trading symbols; Works at any time intervals; Not redrawn. Input paramete

All the points of intersection of the Troopers indicator will be points at which the trend direction changes. Sharp price fluctuations are ignored as well as noise around average prices. Signal points, where the color changes, can be used as potential market reversal points. The indicator tracks the market trend with very high reliability. This development can be used both for long-term trading and for pipsing on small periods. The indicator algorithm implements a kind of technical analysis base

Es más común que la relación entre dos símbolos sea probable y que el grado de cambio de precio esperado sea pequeño. Es raro que la alta probabilidad de un cambio de precio esperado de la acción en otro mercado coincida con un alto valor de cambio de precio esperado de otro mercado. Cuando las señales Rebolt Probability y Rebolt Delta coinciden, el operador tiene el beneficio de la probabilidad y la rentabilidad.
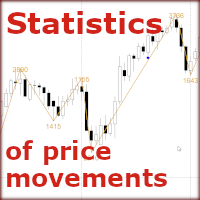
How to find out where to expect a price reversal with a probability of 80% - 90%?
The "Statistics of Price Movements" indicator collects statistics of significant price movements, skipping all small pullbacks, for a certain period of time and displays them in Excel file.
Sort the data in ascending order and get statistics of price reversals in 80%, 85%, 90%, 95% of all cases! (for example, in 2 years!)
After the reversal, the price will move from 1000 pips or more!
So...
Open the dail

FutureWave - индикатор строит предполагаемое будущее движение цены. В своих расчетах индикатор опирается на уровни поддержки и сопротивления, максимумы и минимумы, уровни Фибоначчи и волновой анализ. Индикатор прост в использовании, не требует дополнительных настроек и оптимизации. Работает на любой валютной паре и на любом таймфрейме.
Входные параметры: Wave Color - цвет волны
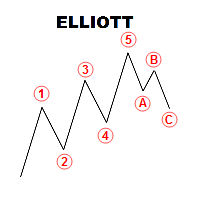
Panel with a set of labels for marking the Elliott wave structure
The panel is called using the Q key. if you click twice, you can move the panel along the schedule.
The panel consists of seven rows of three colored buttons, each of which creates 5 or 3 wave markings. Correction labels consist of 3 tags, or five by shift, you can break the chain of tags when installing by pressing the Esc key
.................... It is possible to disable the visibility of placemarks from lower timeframes

Inspired by high-level trading strategies from Jewish banks—strategies I first uncovered in a conversation on a leading traders' podcast—The Jewish Secret is your gateway to market mastery. The Jews are big players in the banking world, renowned for their market-making skills and keen understanding of market reactions, influenced the creation of this tool. With these strategies in mind, I've developed an indicator based on pure price action fundamentals. Its accuracy surpasses even my own expect

Multi Timeframe Moving Average Crossover Indicator With RSI Filter
Indicator gives buy/sell arrows on EMA Crossover. ( Fast EMA Crosses Slow EMA ) While your are monitoring the price in a certain timeframe, you can look for a EMA crossover in different time frames Indicator use RSI as a filter. ( Buy Confirmed when RSI crosses up 50, Sell Confirmed when RSI crosses down 50 ) No complicated settings. Good for pointing reversals on bigger timeframes while looking for a signal on smaller timefram
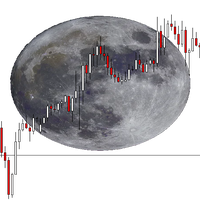
Ever wonder how to apply zodiac and moon cycle on your trading? Don't get me wrong, moon cycle doesn't give you when to buy or when to sell. But it gives you a different time frame that isn't shown in minutes, hourly or daily time frame. Pay attention to the market movement during New Moon and Full Moon Phases. Set to True "Use 4 Phases Only". Often the market is trending during these phases. ================
This indi also shows you the current trend of the market and it paints a candle on eac

FXC iCorrelatioN MT4 Indicator (Specialized for DAX - Dow Jones)
The indicator shows the correlation soefficient between two assets. Correlations are useful because they can indicate a predictive relationship that can be exploited in practice. The correlation coefficient shows the relationship between the two symbols. When the correlation is near 1.0, the symbols are moving togerhet in the same direction. When the correlation is near -1.0, the symbols are moving in opposite direction. Important
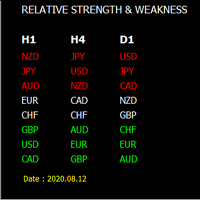
El medidor de fuerza de la moneda es la forma más fácil de identificar monedas fuertes y débiles. Este indicador muestra la fuerza relativa de 8 monedas principales: AUD, CAD, CHF, EUR, GBP, JPY, NZD, USD.
Este medidor de fuerza de moneda es compatible con muchas características de gran alcance: 1. Tablero del medidor de fuerza de la moneda (muestra la fuerza de las monedas para cualquier período de tiempo con la clasificación por nombre o valor en un tablero fácil de usar); 2. Permite calcu

El nuevo indicador es un predictor de tendencia para el gráfico actual, así como otros símbolos y marcos de tiempo. Cada botón del tablero es interactivo. De forma predeterminada, tiene 20 pares de divisas en la lista de vigilancia y tres marcos temporales (M5, H1, D1), pero puede elegir los períodos y símbolos que desea mostrar en el menú. Si el indicador es azul, indica el comienzo de una tendencia alcista. Si es rojo, indica el comienzo de una tendencia bajista. En la captura 3 (modo de luz d
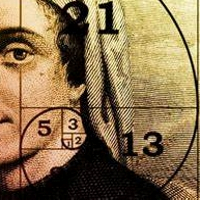
Este indicador dibuja los niveles de Fibonacci para facilitar el uso visual.
4 líneas, puede cambiar de color
2 líneas para el historial de 50 barras, 2 líneas para el historial de 20 barras que muestran 38 y 61 niveles de Fib
MT4 solamente, PC de escritorio no para Android o móvil
Usar en cualquier período de tiempo
Uso en cualquier producto/par
No vuelve a pintar
Fácil de usar y entender visual para comerciantes nuevos y experimentados
Echa un vistazo a nuestros otros produc

This indicator gives you the strength of currencies according to multiple frames With this indicator, you can know the true direction of the currency pair This indicator gives you good advice to bet on the best fighter If you know how to use this indicator, you do not need any other indicators This indicator is suitable for working on long-term, short or medium-term trades. This indicator is your loyal friend

Description
Range Detector is an indicator that identifies ranges in the market and displays their presence on the price chart.
Recommendations
You can use this indicator to determine the flet and, accordingly, to determine the direction of opening a position or closing an opposite position.
Parameters
Maximum History Bars - maximum number of history bars for calculating the indicator. Average True Range Period - ATR indicator period (used to calculate the difference between mov
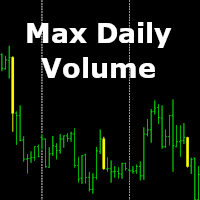
Do you want to trade like a pro? Buy where the professional buys and sell where the professional sells! Our indicator shows the most controversial and heated moment of the day! A moment of the day where a lot of money was loaded in the market and for this "Treasure" the further struggle will go!
And so, the indicator shows the bar in which there was the maximum struggle between the buyer and the seller for the past day, and it is this bar, or its extremes, or itself as a whole, becomes an imp

KT Renko Patterns scans the Renko chart brick by brick to find some famous chart patterns that are frequently used by traders across the various financial markets. Compared to the time-based charts, patterns based trading is easier and more evident on Renko charts due to their uncluttered appearance.
KT Renko Patterns features multiple Renko patterns, and many of these patterns are extensively explained in the book titled Profitable Trading with Renko Charts by Prashant Shah. A 100% automate
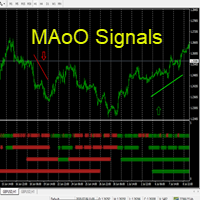
Hello This Indicator will draw Green (Up) and Red (Down) small arrows from Multi TimeFrames based in ( moving average of oscillator) to help you to take decision to buy or sell or waiting If there 4 green arrows in same vertical line that's mean (Up) and If there 4 Red arrows in same vertical line that's mean (Down) and the options contain (Alert and Mobile , Mail Notifications). Please watch our video for more details https://youtu.be/MVzDbFYPw1M and these is EA for it https://www.mql5.com/en/
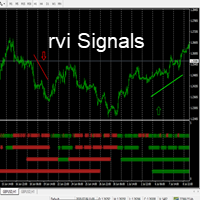
Hello This Indicator will draw Green (Up) and Red (Down) small arrows from Multi TimeFrames based in ( Relative Vigor Index ) to help you to take decision to buy or sell or waiting If there 4 green arrows in same vertical line that's mean (Up) and If there 4 Red arrows in same vertical line that's mean (Down) and the options contain (Alert and Mobile , Mail Notifications). Please watch our video for more details https://youtu.be/MVzDbFYPw1M and these is EA for it https://www.mql5.com/en/market/

Does your trading consist of Multiple EA's, Multiple time frames an no clear indication of how each individual strategy or time frame is performing, then this indicator will help. Assign the EA Magic number to this indicator and track it's performance on the chart by selecting on chart the period, today, week, month year or all history to view. Easy visual colour changing header to display the performance of the EA for the respective periods. Minimize the panel to reduce chart clutter. Add yo
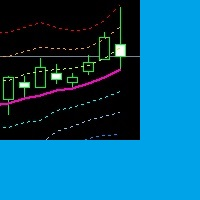
A Channel and Trend indicator. You set as you want. You can use at all timeframe. You can use for martingale,scalping and tunnel strategies. I set some number for me, but you can change this number as you want. You can use this indicator for your expert advisor apps. if you want another features i can do it for you.
Input Values: 1.) Last_Candle : Last candle for display indikator. 2.) X_Price : Price of indicator. 3.) MA_Period : Period for Moving Average. 4.) MA_Method : Method for Moving Av
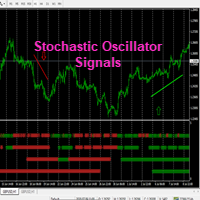
Hello This Indicator will draw Green (Up) and Red (Down) small arrows from Multi TimeFrames based in ( Stochastic oscillator ) to help you to take decision to buy or sell or waiting If there 4 green arrows in same vertical line that's mean (Up) and If there 4 Red arrows in same vertical line that's mean (Down) and the options contain (Alert and Mobile , Mail Notifications). Please watch our video for more details https://youtu.be/MVzDbFYPw1M and these is EA for it https://www.mql5.com/en/ma

An arrow is formed on the current candle and indicates the direction of the next candle and the possible direction of the trend in the future.
The signal can sometimes drop out.
The trade is entered at the Next candlestick. .
its advantages:
accuracy of signals. complete absence of redrawing. You can choose absolutely any tool. the indicator will provide many profitable and accurate signals there is alert, push, email of seeing ... no need to pile up a live chart with different indica
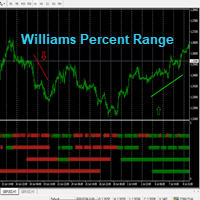
Hello This Indicator will draw Green (Up) and Red (Down) small arrows from Multi TimeFrames based in ( Williams Percent Range ) to help you to take decision to buy or sell or waiting If there 4 green arrows in same vertical line that's mean (Up) and If there 4 Red arrows in same vertical line that's mean (Down) and the options contain (Alert and Mobile , Mail Notifications). Please watch our video for more details https://youtu.be/MVzDbFYPw1M and these is EA for it https://www.mql5.com/e
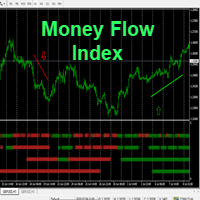
Hello This Indicator will draw Green (Up) and Red (Down) small arrows from Multi TimeFrames based in ( Money Flow Index ) to help you to take decision to buy or sell or waiting If there 4 green arrows in same vertical line that's mean (Up) and If there 4 Red arrows in same vertical line that's mean (Down) and the options contain (Alert and Mobile , Mail Notifications). Please watch our video for more details https://youtu.be/MVzDbFYPw1M and these is EA for it https://www.mql5.com/en/market/p

FXC iRSI-DivergencE MT4 Indicator
This is an advanced RSI indicator that finds trend-turn divergences on the current symbol. The indicator detects divergence between the RSI and the price movements as a strong trend-turn pattern.
Main features: Advanced divergence settings
Price based on Close, Open or High/Low prices Give Buy/Sell open signals PUSH notifications
E-mail sending Pop-up alert Customizeable Information panel Input parameters: RSI Period: The Period size of the RSI indicator.
R

This is simple profitable system I have been using to trade for over 10 years.
You do not need many indicators on your charts to be successful as a trader. Just find the right strategy that has been proven over time and stick to it. You are not only buying trading system when you buy my product but also mentorship. You will become one of the members of my close trading group on Telegram where you will learn how to manage your trading career and become a discipline trader who makes consistent

El trading se trata de esperar el momento adecuado. Este indicador fue creado para saber lo que está sucediendo en nuestros gráficos sin tener que cubrir la pantalla con indicadores. Además, cuenta con varios tipos de alertas que nos permiten dedicar nuestro tiempo a otras cosas hasta que ocurra algo interesante. Puede utilizar varias alarmas al mismo tiempo. No es un problema. Por defecto AlterAlert nos ofrece alertas cuando los siguientes indicadores nos dan una señal: ◾Mao de movimiento (cruc

Индикатор ищет дивергенции по индикаторам: MACD, RSI,CCI,Stochastic,OsMA,RVI. По клику на сигнальную кнопку осуществляется переход на график с
сигналом. Для каждого индикатора применяется свой шаблон. Цифры на сигнальных кнопках указывают расстояние в барах от сигнала. Прокрутка
(scrolling) панели осуществляется клавишами "UP" "DOWN" на клавиатуре.
Входные параметры
Lists Of Currencies To Search For Divergences - Список торговых инструментов.
General Setting - Общие настройки панели.
T

There are 8 types of this indicator. Consisted of 1. Bullish and Bearish Engulfing 2. Morning and Evening Star 3. Three Green Soldiers and Three Red Crows 4. Three Inside Up and Down 5. Three Outside Up and Down 6. Bullish and Bearish Harami 7. Tweezers Top and Bottom 8. Piercing and Dark cloud cover
Signal Filter :: 1. The appearance of the candle stick 2. SMA 3. 2EMA :: EMA Fast and EMA Slow 4. RSI
N otification :: 1. Via screen 2. Email 2. Phone
For trading 1. Scaling 2. Binary options

The indicator identifies two most important patterns of technical analysis - Pin Bar and Engulfing. MT5-version https://www.mql5.com/en/market/product/53701 Settings: Mincandle size for PinBar - The minimum size of the Pin-Bar candlestick; Percentage of candle body on size - The percentage of the candle body in relation to its length; PinBar Alert - Alert when a Pin-Bar is detected; PinBar Mail - Sends an email when a Pin Bar is found; PinBar Notification - Sends a push notification when a Pin

Индикатор высчитывается по сложному авторскому алгоритму. Он строится с учетом тенденции по зонам перекупленности перепроданности объёмов . Это позволяет выявлять дивергенцию объёмов , выявить так называемые приседающие бары. Также он определяет уровни входа в рынок и цели. Средняя линия канала является предполагаемым уровнем отката.
RPeriod- период расчета индикатора
Indicator_Level - уровень зон перекупленности перепроданности
Draw Fibo Levels - отображаем целевые уровни
Fibo Level Col

[DESCRIPCIÓN]
El indicador de punto de entrada muestra flechas hacia arriba / abajo como un punto de entrada para comprar / vender. La señal basada en EMA, MACD y Price Action.
Una flecha roja significa que es una buena oportunidad para vender. Una flecha verde significa que es una buena oportunidad para comprar. [ADVERTENCIAS Y RECOMENDACIONES]
Operar en Forex e instrumentos financieros apalancados implica un riesgo significativo y puede resultar en la pérdida de su capital invertido. No
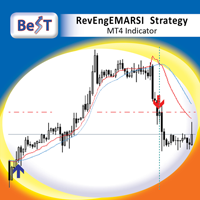
BeST_RevEngEMARSI Strategy is an MT4 Indicator that is based on the indicator RevEngEMARSI by Giorgos Siligardos that was presented in his article " Reverse Engineering RSI (II) " ( TASC_Aug 2003 ) as a new variation of his inverse-RSI indicator and which transforms the Exponential moving average of RSI into a curve in the price graph, simplifying the price projection method and improving its visual representation. BeST_RevEngEMARSI Strategy while implementing the crossings with its Moving Aver

Retracement Hunter This Indicator based on powerfull daily levels . support and resistance, Buy / Sell entries which is more based on low risk and high reward and winning ratio, Enter trade when you get popup alert , book profit on target1, target 2, target3 levels, most of the trending days it will hit target3, but its always safe to book partial at target1 or target2
Buy best entry when rule 1) look for Buy 2) Emas aligned less than 0.25 3) Main Ema aligned Buy , it will alert when all t

This indicator is an upgrade of traditional MACD on MT4. Macd Base line cross above Macd signal line the color of histogram change is red color and entry order Sell. Macd Base line cross below Macd signal line the color of histogram change is green color and entry order Buy.
For above histogram of Macd can change color to good looking by can change color above zero line and lower line.

Trading is a trade war. So a trader is a warrior. A warrior needs to be armed with a weapon
This Binary Star Wars Pro is your workout routine. That can accelerate the results precisely
Who deserves this kind of precision weapon? 1. People who want to profit. From binary options trading 2. Those who want to trade short, profit fast 3. People who want long-term Can be done 4. Newbie can use it. 5. Old hands can be used very well.
How it works It works very easy. For binary options Time fra
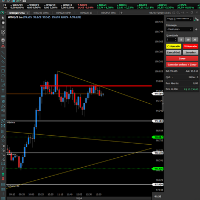
O indicador DonForex é uma das ferramentas mais utilizadas para traçar suporte e resistência automaticamente. Ele traça os melhores níveis de suporte e resistência do gráfico em qualquer tempo. Isso ajuda você a ter uma visão mais amplas para fazer suas operações
As linhas pontilhadas são os pontos mais tocados pelo preço formando assim uma região de suporte ou resistência. Ele também traça automaticamente linhas de tendências de alta (LTA) ou de baixa (LTB) nos dando oportunidade de compra e
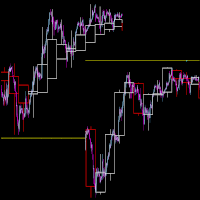
This indi lets you plot higher time frame candle stick (Japanese Candlestick or Heiken Ashi Candlestick). This indicator could greatly help your trading style either its scalping, day trading or swing trading as it shows you the higher time frame candlesticks activity while you are about to pull a trigger on your trade. The candlesticks will only appear on a time frame that is lower than the higher time frame. It won't draw if the current time frame is equal to or higher than the time frame set
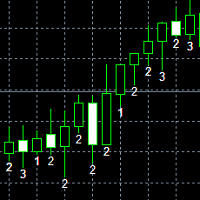
Rob Smith's is a trading method developed over a 30 year career in the market. TheSTRAT is a multi-timeframe strategy that has three major components: Inside Bars - Inside Bars occur when the current candle falls completely within the prior candle. Directional Bars - Directional Bars occur when the current candle takes out one side of the prior candle. Outside Bars - Outside Bars occur when the current candle takes out both sides of the prior candle. #thestrat

This indi shows the following 1. Supertrend 2. Alligator (Not a regular alligator)
3. ZigZag 4. Moving Average 5. Trend Continuation/Mini correction Signal (plotted in X) (See screenshots in green background color
6. Early Signal Detection (See screenshots in green background color)
You may treat Alligator as the lagging indicator
The leading indicator is the supertrend. The zig zag is based on the leading indicator where it gets plotted when the leading indicator got broken to the opposite.

This advisor enters the market at the opening of London Market . It has a automatic function that give buy (arrow up green) and sell (arrow down red) signal when the indicator met high probabilities requirements.Once the signal is generated it is the trader discretions to start the order button and do trade manually. Stop loss are base on ATR. Recommended Take profit is 20pips. The trading system is suitable for both experienced traders and beginners.
Monitoring and proof of wins : https

For this set of indicators 1. General information - Calculates with high performance mathematical algorithms. - Calculated from the price of candles - The entry point of this order is filtered by the train EMA and the oscillator. - Calculate the integrity of the candle
2. How does it work? - You can see two types of order entry points: the notification on the monitor and the arrow. - You can trust 75-95 percent of this entry point.
3. Settings - A complete candle

For this set of indicators 1. General information - Calculates with high performance mathematical algorithms. - Calculated from the price of candles - The entry point of this order is filtered by the train EMA and the oscillator. - Calculate the integrity of the candle
2. How does it work? - You can see two types of order entry points: the notification on the monitor and the arrow. - You can trust 75-95 percent of this entry point.
3. Settings - Retracement is re

For this set of indicators 1. General information - Calculates with high performance mathematical algorithms. - Calculated from the price of candles - The entry point of this order is filtered by the train EMA and the oscillator. - Calculate the integrity of the candle
2. How does it work? - You can see two types of order entry points: the notification on the monitor and the arrow. - You can trust 75-95 percent of this entry point.
3. Settings - A complete candle

For this set of indicators 1. General information - Calculates with high performance mathematical algorithms. - Calculated from the price of candles - The entry point of this order is filtered by the train EMA and the oscillator. - Calculate the integrity of the candle
2. How does it work? - You can see two types of order entry points: the notification on the monitor and the arrow. - You can trust 75-95 percent of this entry point.
3. Settings - A complete candle

For this set of indicators 1. General information - Calculates with high performance mathematical algorithms. - Calculated from the price of candles - The entry point of this order is filtered by the train EMA and the oscillator. - Calculate the integrity of the candle
2. How does it work? - You can see two types of order entry points: the notification on the monitor and the arrow. - You can trust 75-95 percent of this entry point.
3. Settings - A complete candle

For this set of indicators 1. General information - Calculates with high performance mathematical algorithms. - Calculated from the price of candles - The entry point of this order is filtered by the train EMA and the oscillator. - Calculate the integrity of the candle
2. How does it work? - You can see two types of order entry points: the notification on the monitor and the arrow. - You can trust 75-95 percent of this entry point.
3. Settings - A complete candle
This indicator displays support and resistance at fixed levels. The level won't change regardless how many days or minutes has gone by. There are 7 levels start from green ends at gray color. Imagine it like do (green),re,mi,fa,sol,la,si,DO (green)
Market often goes one octave from do to DO or fa to FA. You will see this occurring at all markets This indicator can be used to spot your take profit or stop loss target. It can be also used to find support and resistance or supply and demand.

The indicator displays the most important Price Action Patterns that indicate a potential reversal / continuation of the trend. My #1 Utility : includes 65+ functions | Contact me if you have any questions Avaliable Patterns: Pin bar; Engulfing; Inside bar (Harami); Morning star; Evening star; Dark Cloud Cover; Piercing Line; Features: You can select patterns to display and disable unnecessary patterns; Notifications : alerts in the terminal, Email and Push-notifications (to the mobil

The indicator displays the levels that are extremes for the specified time frames. Resistance level is the maximum price of the last closed bar; Support level is the minimum price of the last closed bar; My #1 Utility : includes 65+ functions | Contact me if you have any questions 2 operating modes: Real bodies: Open and Close prices will be used; Extremes: High and Low prices will be used;
This indicator: Helps to see potential reversal levels; Patterns formed near the levels have mo
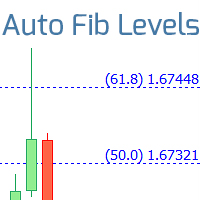
Automatically draws Fibonacci levels, basen on the last closed bar of the specified time frame. My #1 Utility : includes 65+ functions | Contact me if you have any questions helps to see potential reversal levels; patterns formed near the levels have more potential; significantly saves time spent on manual level plotting; Adjustable parameters:
The time frame used to plot the levels; Personalization of Fibonacci levels: main correction levels + extension levels; Line color, line width an

This may just look like another indicator for identifying and displaying supply and demand, but dig-in further and you will discover it has much more to offer. In addition to the complete flexibility for displaying zones, consider the identification of recent support or resistance, the back-testing capability to help you learn how to identify the best supply and demand zones to trader from, the continuously updated trend information for all time frames, times from around the world displayed on

FBO Impact is a professional yet simple to use trend following system. It detects the prevailing trend and gives entry points after pullbacks to significant price levels. To determine the trend it uses a unique filtering algorithm. Suitable for defining entry points for scalping as well as for intra-day trading. Features Works with the prevailing market trend. Suitable for all currency pairs. Ideal for all time frames but higher time frames are recommended. Does not redraw/repaint the arrows on

Finds bars that exceed the specified size
My #1 Utility : includes 65+ functions | Contact me if you have any questions 2 operating modes: Real body: the difference between the open and close prices will be used; Extremes: the difference between the maximum and minimum prices will be used;
This Indicator: Convenient for filter patterns in a period of low volatility; Indicates the beginning of a trend ; Helps to see the most significant bars ; Can be used when trading

Shows the direction of the bars on all major timeframes. My #1 Utility : 65+ functions | Version for MT5
The meaning of the visual signals ( squares):
Red : Close price is lower than the Open price: Close < Open; Green : Close price is higher than the Open price: Close > Open; Blue : Close price is equal to the Open price: Close = Open; You can set the Shift of the calculated bar, relative to the current bar: Shift = 0: the direction of the currenttly open (floating) bars, Shift

The falcon indicator works based on the innovative falcon strategy before me, as I used special numbers for the Moving Release indicator and the Bollinger Band, in addition to many indicators for filtering the signal, some numbers from the Nine Square and the Fibonacci numbers, where the results were impressive. We also have a free version for a month in the video description on Youtube download link Thanks

Trading is a trade war So traders are warriors. A warrior needs a weapon.
The Binary Galaxy A1 is a powerful weapon. Extremely accurate This tool can be customized as you like.
Who deserves such an accurate weapon? 1. People who want profits From binary options trading 2. Those who want to trade short, profit fast 3. People who want long-term can do it. 4. Beginners can use it. 5. Old hand works very well.
How it works It works very easy. For binary options Time frame M1 or M5 and expires

Trading is a trade war So traders are warriors. A warrior needs a weapon.
The Scalping One Plus A1 is a powerful weapon. Extremely accurate This tool can be customized as you like.
Who deserves such an accurate weapon? 1. People who want profits From binary options trading 2. Those who want to trade short, profit fast 3. People who want long-term can do it. 4. Beginners can use it. 5. Old hand works very well.
How it works It works very easy. For binary options Time frame M1 or M5 and exp
El Mercado MetaTrader es una plataforma única y sin análogos en la venta de robots e indicadores técnicos para traders.
Las instrucciones de usuario MQL5.community le darán información sobre otras posibilidades que están al alcance de los traders sólo en nuestro caso: como la copia de señales comerciales, el encargo de programas para freelance, cuentas y cálculos automáticos a través del sistema de pago, el alquiler de la potencia de cálculo de la MQL5 Cloud Network.
Está perdiendo oportunidades comerciales:
- Aplicaciones de trading gratuitas
- 8 000+ señales para copiar
- Noticias económicas para analizar los mercados financieros
Registro
Entrada
Si no tiene cuenta de usuario, regístrese
Para iniciar sesión y usar el sitio web MQL5.com es necesario permitir el uso de Сookies.
Por favor, active este ajuste en su navegador, de lo contrario, no podrá iniciar sesión.