Indicadores técnicos para MetaTrader 4 - 4

Market Heartbeat in your hand! Introduction The Market Heartbeat indicator with a special enhanced algorithm (volume, money flow, cycle of market and a secret value) is a very repetitive trend finder with a high success rate . Interestingly, this Winner indicator indicates that the trend has changed its direction or the end of a trend retracement or even appears at the range market. The Market Heartbeat can use in scalping trading or trend trading. It finds immediately with alarm, notification a
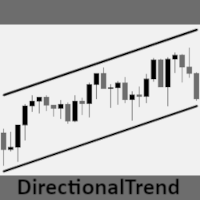
El indicador de trading DirectionalTrend es una herramienta innovadora diseñada para proporcionar una visión clara y precisa de la tendencia del mercado financiero. Basado en datos históricos del mercado, este indicador identifica y muestra la dirección general en la que se mueve el mercado en un período de tiempo específico. Su objetivo principal es ayudar a los traders a tomar decisiones informadas al proporcionar señales claras sobre la tendencia dominante en el mercado. Diseñado con una int
FREE
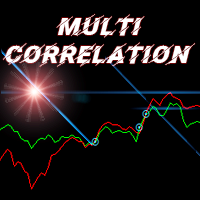
Indicator of correlation of two trading instruments.
Ideal for pair trading.
Example of use: if there is a significant divergence of correlated trading instruments, open two deals in the direction of each of them. Trades are closed when the correlation lines are crossed. Settings: First symbol (if empty - current) - The first trading instrument (if empty, the current one); Second tool (if empty - current) - Second trading instrument (if empty - current); Number of bars - Number of bars for

Indicador Th3Eng PipFinite PRO Este producto se diferencia de Th3Eng PipFinite Original, utilizando una lógica y algoritmos diferentes. El indicador Th3Eng PipFinite Pro analiza las direcciones de tendencia utilizando algoritmos personalizados. Muestra la dirección de la tendencia, puntos de entrada, un punto de stop loss y tres puntos de take profit. El indicador también muestra puntos de pivote, canales dinámicos de soporte y resistencia y una caja lateral con información detallada sobre la s

Dark Breakout is an Indicator for intraday trading. This Indicator is based on Trend Following strategy, providing an entry signal on the breakout. The signal is provided by the arrow, which confirms the breaking of the level. We can enter in good price with this Indicator, in order to follow the main trend on the current instrument. It is advised to use low spread ECN brokers. This Indicator does Not repaint and N ot lag . Recommended timeframes are M5, M15 and H1. Recommended working pairs

Chart Patterns Detect 15 patterns (Ascending Triangle, Descending Triangle, Rising Wedge, Falling Wedge, Bullish Flag, Bearish Flag, Bullish Rectangle, Bearish Rectangle Symmetrical triangle, Head and Shoulders, Inverted Head and Shoulders, Triple top, Triple Bottom, Double Top, Double Bottom) Use historical data to calculate the probability of each pattern to succeed (possibility to filter notification according to the chance of success) gives graphic indication about the invalidation level and

BUY INDICATOR AND GET A PIVOT POINT EA FOR FREE AS A BONUS + SOME OTHER GIFTS! ITALO PIVOTS INDICATOR is the best pivot point indicator for strong price reversals and continuations of price movements ever created , and why is that? You will have for the first time inside a pivot point indicator the pivots above the monthly, so, you will have the 3-month pivot lines, 6 months, 1 year, 2 years, 3 years, 5 years and 10 years, very strong support and resistances. Not only that but for the fi

BeST_Darvas Boxes is an MT4 Indicator based on the trading method developed in the 50’s by the Hungarian Nicolas Darvas . BeST_Darvas Boxes indicator draws the Top and the Bottom of every Darvas Box that can be confirmed on the current Chart. draws Buy and Sell Arrows for every confirmed Upwards or Downwards Breakout of the above levels. draws always only after the bar closing and so is non-repainting or backpainting .
Note : Every customer who wants to have the older version v_1.75 with t
The Controversial 5-Step System That Professional Traders Use To Unlock Trading Success!
Reversal Pro effectively combines price action, ideal location and reliable statistics in one smart algorithm. Understanding the market in this unique perspective allows you to recognize reversals professionally.
Discover The Secret Of Professional Traders
Get instant access www.mql5.com/en/blogs/post/716077 Copy & Paste what professional traders are doing right now!
How To Trade Step 1: Trade Setu

O (TDO), que es un índice que mide la tasa de cambio de precios utilizando el principio de " Pure Momentum ".
Cuando el precio de un valor aumenta de 10 a 15, la tasa de cambio del precio es del 150%, pero cuando baja de 15 a 10, la tasa de cambio del precio es solo del 33,3%. Es por eso que los indicadores de análisis técnico como "Tasa de cambio de precio" (ROC) o "Momentum" dan lecturas más altas para los movimientos de precios ascendentes que las dadas para los descendentes. TDO soluciona e
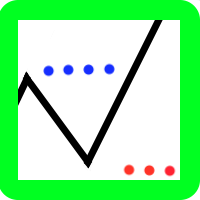
The indicator is a polyline (ZigZag segment) that tracks and connects the extreme points of the chart price that are at least a specified size apart from each other in points on the price scale.
The one and only setting is the minimum size (in points) of a ZigZag segment. The indicator displays levels to determine a possible trend reversal:
level "LevelForUp" - the breaking of this level determines the possible reversal of the trend up (to buy);
level " LevelForDown " - the breakin
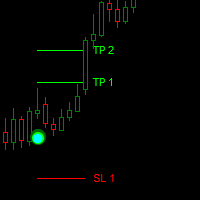
Dark Point is an Indicator for intraday trading. This Indicator is based on Trend Following strategy, also adopting the use of the atr to determine the right volatility. We can enter in good price with this Indicator, in order to follow the strong trend on the current instrument. If you love Dark Point, consider adding some power: Dark Power
Key benefits
Easily visible take profit/stop loss lines Intuitive directional points/arrows by colors Useful statistics , which indicate the win
FREE

The swing continuation pattern happens in a trend direction after a short reversal / pull back . As the name suggests , these patterns occurs along the swing high and swing lows of a trend , this makes the patterns very low risk patterns with potential high rewards . The swing continuation indicator also combines Currency Meter as a filter for its execution. The idea is to go with both the price trend flow and currency trend flow. Which means the price action must be supported by the currency st

This Indicator does not repaint itself at all, it's identifies a new TREND in the bud, this indicator examines the volatility, volumes and momentum to identify the moment in which there is an explosion of one or more of these data and therefore the moment in which prices have strong probability of following a new TREND.
CandleBarColorate never misses a beat, he always identifies a new TREND in the bud without error. This indicator facilitates the reading of charts on METATRADER; on a single wi
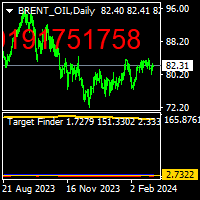
THISE INDICATOR NOT WORK ON FREE DEMO. there is a protocol to work it. target finder indicator is a forecast the find probably targets.up and down. to use thise indicator, there is a protocol,i explain below. first load indicator you will see blue and red lines. on the left side look to the higher value of line ,and draw horizantal line on top it. and on the right side see the LEVEL NUMBER.
Finding UP TARGET h=put that level number m=1 b=1 pres ok. you will see on the screen ,on top right ,r

Free Market structure zig zag to assist in price action trading the screenshots describe how to use and how to spot patterns new version comes with alerts, email alert and push notification alert can be used on all pairs can be used on all timeframes you can add additional confirmation indicators the indicator shows you your higher high and low highs as well as your lower lows and lower highs the indication makes price action analysis easier to spot.
FREE

Dark Oscillator is an Indicator for intraday trading. This Indicator is based on Counter Trend strategy, trying to intercept changes in direction, in advance compared trend following indicators. We can enter in good price with this Indicator, in order to follow the inversion of the trend on the current instrument. It is advised to use low spread ECN brokers. This Indicator does Not repaint and N ot lag . Recommended timeframes are M5, M15 and H1. Recommended working pairs: All. I nst
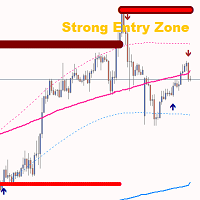
Gold TMAF MTF - es el mejor indicador técnico bursátil. El algoritmo del indicador analiza el movimiento del precio de un activo y refleja la volatilidad y las posibles zonas de entrada.
Las mejores señales del indicador:
- Para VENTA = límite superior rojo de TMA2 por encima del límite superior rojo de TMA1 + indicador fractal rojo por encima + flecha amarilla de señal SR en la misma dirección. - Para COMPRA = límite inferior azul de TMA2 por debajo del límite inferior azul de TMA1 +
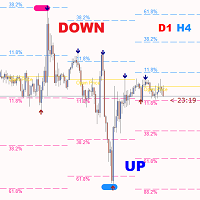
Gold ATR MTF: este es un excelente indicador técnico de acciones. El algoritmo del indicador ATR (Average True Range) analiza el movimiento del precio del activo y refleja la volatilidad dibujando los niveles correspondientes en porcentajes específicos (%) del precio de apertura del período de tiempo especificado (D1). Los indicadores (rojo y/o azul D1 H4) de la dirección del movimiento del precio del símbolo y las señales de flecha son ayudas adicionales y esenciales para una negociación y/o

Propósito principal: "Barras Pin" está diseñado para detectar automáticamente barras pin en gráficos de mercados financieros. Una barra pin es una vela con un cuerpo característico y una cola larga, que puede indicar una inversión o corrección de tendencia.
Cómo funciona: El indicador analiza cada vela en el gráfico, determinando el tamaño del cuerpo, la cola y la nariz de la vela. Cuando se detecta una barra pin correspondiente a parámetros predefinidos, el indicador la marca en el gráfico c
FREE

Perfil del mercado Forex (FMP para abreviar) Si prefiere ver esto en un gráfico en vivo en lugar de leer la descripción, puede descargar instantáneamente una demostración gratuita aquí.
Que esto no es:
FMP no es la pantalla clásica de TPO codificada por letras, no muestra el cálculo general del perfil de datos del gráfico y no segmenta el gráfico en períodos ni los calcula.
Que hace :
Lo más importante es que el indicador FMP procesará los datos que residen entre el borde izquierdo del
FREE

Version 1.6 ! Volume Strength 28 is better , easier to use and more awesome ! Based on complaint we got from the reviews, we understood many don't know how to really use the time frame setting on the input menu thus they have complaints of volatility, thus we have designed an Automatic Time Frame selection system that is suitable for novice traders.! The design of the indicator has been changed along with some calculation metrics. Based on complaints of high volatility we have been getting ,we

** All Symbols x All Time frames scan just by pressing scanner button ** *** Contact me after the purchase to send you instructions and add you in "Order Block group" for sharing or seeing experiences with other users. Introduction: The central banks and financial institutions mainly drive the market, Order block is considered a market behavior that indicates accumulation of orders from banks and institutions, then the market tends to make a sharp move(Imbalance) on either side once the order bl
The CAP Channel Trading is a volatility-based indicator that makes use of the “advanced envelope theory”. These envelopes consist of two outer lines. Envelope theory states that the market price will generally fall between the boundaries of the envelope (or channel). If prices move outside the envelope, it is a trading signal or trading opportunity.
Benefits of the Channel Trading Indicator
CAP Channel Trading works with any asset
It can be applied to any financial assets: forex, cryptocu
FREE

Nuestro indicador de Patrones Básicos de Velas hace que identificar los principales patrones de velas sea más fácil que nunca. Descubra patrones como el Martillo, la Estrella Vespertina, los Tres Soldados Blancos y muchos más con sólo echar un vistazo a su gráfico. Con una interfaz intuitiva y señales visuales claras, nuestro indicador le ayuda a identificar oportunidades de trading de forma rápida y precisa / Versión MT5 Dashboard Scanner para este indicador: ( Basic Candlestick Patterns Dashbo
FREE

This indicator provides tick volume delta analysis on M1 timeframe. It monitors up and down ticks and sums them up as separate volumes for buys and sells, as well as their delta volumes, and volume clusters on price scale within a specified number of bars. This indicator complements VolumeDelta , which uses similar algorithms but does not process ticks and therefore cannot work on M1. VolumeDelta can show its signals on entire history because it reads M1 volumes for calculations on higher timefr
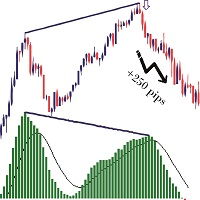
What Is Moving Average Convergence Divergence (MACD)? Moving average convergence divergence (MACD) is a trend-following momentum indicator that shows the relationship between two moving averages of a security’s price. The MACD is calculated by subtracting the 26-period exponential moving average (EMA) from the 12-period EMA.
The result of that calculation is the MACD line. A nine-day EMA of the MACD called the "signal line," is then plotted on top of the MACD line, which can function as a tri
FREE

The Identify Market State indicator allows you to set the beginning of a new trends and pullbacks on an existing trend. This indicator can be used both for trading on scalper strategies and for long-term trading strategies. The indicator is based on the 14 periodic DeMarker indicator and the 8 periodic simple moving average from this indicator. Statistical studies have shown that the sharp peaks of the DeMarker indicator curve when they drop below its minimum li

Waddah Explosion Scanner Features : Waddah Trend, Explosion Increase/Decrease Trend Percentage with Threshold DeadZone Trend Direction Aligned Checks Highlight and Alerts Multi-Timeframe & Multi-Currency Detailed Product Description and Free Demo: https://abiroid.com/product/abiroid-waddah-scanner/
Customizable Threshold: With customizable threshold, you can identify best trading opportunities in volume-based trading. Use Trend Height (x times Explosion) : Trend height in relation to the exp

Este indicador ha sido diseñado para integrarse con la teoría de las Ondas de Elliott, proporcionando dos métodos distintos de operación: Trabajo Automático: En este modo, el indicador opera de manera autónoma al detectar las cinco ondas motrices en el gráfico de acuerdo con la teoría de las Ondas de Elliott. Ofrece predicciones e identifica zonas potenciales de reversión. Además, tiene la capacidad de generar alertas y mensajes push para notificar a los traders sobre desarrollos significativos

Please feel free to contact me if you need any further information.
Please let me know if you have any questions.
I hope the above is useful to you. MT MERIT PullBack : It is an indicator created to find pullback signals filter trend. Use a complex method to find signals.
Suitable for short-term profit, able to make profit in many cycles. Suitable for people who trade by yourself, do not use with ea (non auto trade)
manage risk management by yourself (Stop Loss,TP, Risk Reward, ...)
and

Graphic Shapes -using history, it projects four types of graphical shapes at the moment, allowing you to determine the main ranges of price movement in the future, as well as gives an understanding of the main market reversals, while giving entry points by priority!The panel contains three types of figure sizes expressed by timeframes. They allow you to conduct a complete market analysis without using additional tools! The indicator is a powerful tool for forecasting price movements in the forex

The GGP Chandelier Exit Alert MT4 Indicator is a volatility-based indicator that identifies stop loss exit points for long and short trading positions. Chandelier Exit is based on the Average True Range (ATR) indicator. It is designed to keep traders in the trend until a defined trend reversal happens. Traders use CE to maximize their returns in a trade and make stop loss exit decisions. It is based on the principle that a trend reversal is highly probable when the price of an asset moves ag

Contact me after payment to send you the User-Manual PDF File.
Double Top/Bottom Pattern
Double top and bottom patterns are chart patterns that occur when the underlying investment moves in a similar pattern to the letter "W" (double bottom) or "M" (double top). Double top and bottom analysis are used in technical analysis to explain movements in a security or other investment, and can be used as part of a trading strategy to exploit recurring patterns. Searching for this pattern among the c
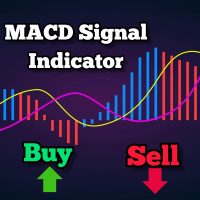
Este es un indicador de seguimiento de tendencias basado en MACD, proporcionando señales de compra cuando está por encima de los 200 MA y señales de venta cuando está por debajo. La señal se genera cuando el MACD cruza la línea cero. El indicador también muestra un nivel de soporte y resistencia que se puede usar como stop loss. Los parámetros ajustables incluyen el período de la MA, el EMA rápido del MACD, el EMA lento y el intervalo de soporte-resistencia. Se representa en los puntos más bajos
FREE

** All Symbols x All Timeframes scan just by pressing scanner button ** ***Contact me after purchase to send you instructions and add you in "RSI scanner group" for sharing or seeing experiences with other users.
Introduction RSI divergence is a main technique used to determine trend reversing when it’s time to sell or buy because prices are likely to drop or pick in the charts. The RSI Divergence indicator can help you locate the top and bottom of the market. This indicator finds Regular div

Trend Arrow Super
The indicator not repaint or change its data.
A professional, yet very easy to use Forex system. The indicator gives accurate BUY\SELL signals. Trend Arrow Super is very easy to use, you just need to attach it to the chart and follow simple trading recommendations.
Buy signal: Arrow + Histogram in green color, enter immediately on the market to buy. Sell signal: Arrow + Histogram of red color, enter immediately on the market to sell.
Please email me after your purchase!
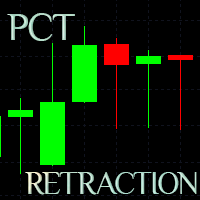
Developed to assist in binary options retracement operations, this indicator will show the assets with the best retracement percentages!
How it works: The indicator will calculate the total length of each candle from low to high, the total of the body and total of shadows (up and down) and calculate a total shadows percentage of various configurable assets. The counter is updated with each new candle.
ATENTION: Demo on the estrategy tester is not functional to show multiple assets.
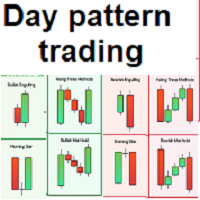
Simple and effective indicator based on some candle patterns recognition Arrows appear on candles when bear signal / bull signal based on candle pattern recognition -----> TWO strategies available you can enable / disable one of them Indicator can work on any chart and time frame I prefer to work on high time frames especially the Daily charts D1 and H4 Red arrows appears above candle showing a bear signal after candle completed - arrow will be blue during candle formation Green arrows appears b

Индикатор I Special ZigZag отмечает на графике максимумы и минимумы 3-х порядков, а именно краткосрочные , среднесрочные и долгосрочные и соединяет их линией подобно ZigZag без перерисовки. Идея построения индикатора взята из книги Ларри Вильямса "Долгосрочные секреты краткосрочной торговли" и адаптирована под современный рынок. В настройках индикатора можно задать нужную толщину и цвет для каждого вида экстремума для удобства восприятия на графике цены. С помощью данного индикатора легче понять

Auto Fibonacci Button The Fibonacci retracement is a popular and reliable technical analysis tool for traders to determine support and resistance areas. It employs the "Golden Ratio," a mathematical pattern seen throughout nature and even the universe, to forecast particular levels of support level and resistance level. This tool is generated in technical analysis by dividing the vertical distance between two extreme points on the chart (typically a peak and a low) by the important Fibonacci
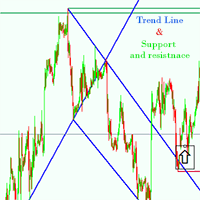
Support and resistance Strategy is one of the most widely used concepts in forex trading.
Strangely enough, everyone seems to have their own idea on how you should measure forex support and resistance. no more wasting time This Indicator is made to do it automatically for you, Features of support and resitance indicator * Automatically detection of the trend line and support & resistance * Works on any pair any time frame any time * Works on offline Chart Inputs : TrendLinePeriod=900 CycleSi
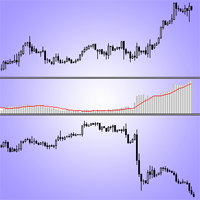
This is an indicator of trading instruments' correlation. It shows the difference of price values of two symbols. The increase in price divergence and the reduction of price divergence can be seen as signals to transactions. The indicator can be used for hedge strategies. The indicator sends Alerts and Push-notifications to the mobile app about the crossing of the moving averages of Envelopes. The indicator has a simple setup. You need to put him in the window of the traded instrument and choose

This indcator shows the trend with the color histogram. It is simple and easy to use. Usage: If the histogram changes from the aqua to the fuchsia, which means the trend is up. If the histogram changes from the fuchsia to the aqua,which means the trend is down. Inputs: MaPeriods: the periods of moving average. f1: the multiplier of inner bands f2: the multiplier of outer bands Popup Window Alert Email Alert Mobile Push Alert Alerts When the trend changes from the long trend to the short trend or
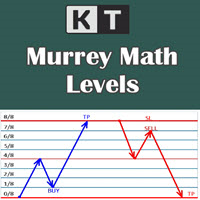
It shows the Murrey Math levels on chart and also provides an alert when price touch a particular level. T. Henning Murrey, in 1995, presented a trading system called Murrey Math Trading System, which is based on the observations made by W.D Gann.
Applications
For Murrey Math lovers, this is a must-have indicator in their arsenal. There is no need to be present on the screen all the time. Whenever the price touches a level, it will send an alert. Spot upcoming reversals in advance by specula

Rental/Lifetime Package Options and Privileges' * For optimum results the yearly or lifetime package is suggested due to live training and Discord channel trading with the creator! Rent Monthly Six Months Yearly/Lifetime Weis Wave with Speed with Alert+Speed Index x x x Manual x x x Quick Set up Video x x x Blog x x x Lifetime Updates x x x Setup and Training Material
x x Free Rectangle Break Alert Tool x Discord Access Channel "The SI traders"
x 2-hour live methodology traini

El indicador VR ATR Pro es una potente herramienta profesional para determinar los niveles objetivos en un instrumento financiero. La eficacia del indicador ha sido comprobada por miles de pruebas en cuentas reales y de demostración. El indicador VR ATR Pro funciona con datos reales utilizando estadísticas reales vivas. La estadística es una cosa terca, el uso de datos estadísticos reales en los cálculos matemáticos permite calcular niveles objetivos precisos para un instrumento financiero. Para

Gold Buster M1 System es un sistema de negociación profesional para gráficos M1 en el par XAUUSD. Pero, a pesar de que el sistema se desarrolló originalmente exclusivamente para operar con oro, el sistema también se puede utilizar con otros pares de divisas. Después de la compra, le daré una lista de pares comerciales que se pueden usar con el sistema además de XAUUSD, lo que ampliará sus posibilidades para usar este sistema. ¡TODOS LOS INDICADORES DEL SISTEMA NO SE REPITE! Este sistema es un co
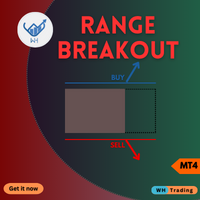
Desbloquee una nueva dimensión del trading con nuestro indicador MQL4 de vanguardia, Range BreakOut MT4
Esta poderosa herramienta está diseñada para identificar y capitalizar los movimientos de precios a medida que salen de los rangos establecidos.
proporcionándole la precisión y confianza necesarias para prosperar en el dinámico mundo de los mercados financieros.
Versión MT5 : WH Range BreakOut MT5
Características:
Detección de rango precisa. Señales de ruptura en tiempo real. P
El indicador Market Steps está diseñado y construido sobre la base de las correlaciones de tiempo/precio de Gann y optimizado por las reglas específicas de Price Action para el mercado de divisas. Utiliza los conceptos de flujo de órdenes del mercado para predecir las zonas de precios potenciales para un alto volumen de órdenes.
El Indicador de Niveles puede ser usado para operar por sí mismo o como una combinación para filtrar señales erróneas de otras Estrategias/Indicadores. Todo operador

ALQANNAS (Sniper) Indicator Overview: Welcome to ALQANNAS, your ultimate sniper in the forex market! ALQANNAS is a powerful and versatile trading indicator designed to enhance your trading experience. Whether you're a beginner or an experienced trader, ALQANNAS provides you with accurate non repainting signals, trend direction and strength, and advanced features to elevate your trading strategy. Key Features: Buy and Sell Signals: ALQANNAS is equipped with a sophisticated algorithm that genera
Welcome to the world of SMC (Smart Money Concepts) Trading, where we empower traders with the tools and knowledge to make smarter trading decisions. Our latest addition to our suite of trading tools is the SMC Trading Pro indicator, version 1.0. Key Features: Major Market Structure Identification with BODY break. Order Block must be in Major Swing ( not Small Swing ). Order Block with Fair Value Gap Detection. Order Block in Discount | Premium zone. Filter for only Bullish, Bearish or All Order
FREE

Step into the realm of Forex trading with confidence and precision using XQ, a cutting-edge Forex indicator designed to elevate your trading game to unprecedented heights. Whether you're a seasoned trader or just stepping into the world of currency exchange, XQ Forex Indicator empowers you with the insights and signals needed to make informed trading decisions. The signal conditions are a combination of three indicators, and XQ Forex Indicator only display medium and long-term trends . The

hint: my basic indicators are used like that KingLevel combind with KingSequence will provides basic insights of the price action of the markets and KingSequenceSgn is just for the convienent for watching. And plus with Forex Trading mentor subsccription I will assist you to win the market at first later if it's great will be upgraded to King Forex trading mentor.
It just the main chart sign of the "KingSequence" indicator.
Here is the detals from the "KingSequence" indicator
Slide 1: Ti

Introducing the Reversal and Breakout Signals
This innovative tool is crafted to enhance your chart analysis by identifying potential reversal and breakout opportunities directly on your charts. It's designed with both novice and experienced traders in mind, providing intuitive visual cues for better decision-making. Let's dive into the key features and how it operates:
### Key Features:
Dynamic Period Settings: Customize the sensitivity of the indicator with use

¿Estás cansado de dibujar manualmente los niveles de Fibonacci en tus gráficos? ¿Está buscando una forma conveniente y eficiente de identificar los niveles clave de soporte y resistencia en sus operaciones? ¡No busque más! Presentamos DrawFib Pro, el último indicador de MetaTrader 4 que realiza niveles automáticos de F ibonacci basándose en sus gráficos y proporciona alertas oportunas cuando se superan estos niveles. Con DrawFib Pro, puede mejorar sus estrategias comerciales, ahorrar
FREE

Este indicador de panel de divergencia de múltiples marcos de tiempo y múltiples símbolos envía una alerta cuando se han identificado una o dos divergencias diferentes en varios marcos de tiempo y no en divergencias individuales. Se puede utilizar con todos los marcos de tiempo desde M5 hasta MN. Es posible habilitar la media móvil o el filtro de tendencia RSI para filtrar solo las configuraciones más fuertes. Combinado con sus propias reglas y técnicas, este indicador le permitirá crear (o mejo
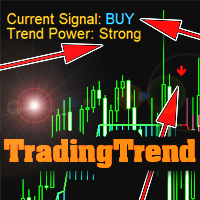
The indicator is not redrawn.
Can be used as a ready-made trading strategy.
Shows: Trend direction; Trend strength; Points of trend reversal or fading. Settings: Trend sensitivity (the lower, the more accurate) - operating sensitivity (the higher, the more accurate); Calculation method - calculation method; Info position - angle of location of the info label (or remove); Text Color - text color; Trend Color Buy - color of the BUY text; Trend Color Sell - SELL text color; Sound Alert - Pop-up

All Symbols AND All Time frames Scan
Document Introduction
The ABCD is a basic harmonic pattern. The ABCD pattern is a visual, geometric chart pattern comprised of three consecutive price swings. It looks like a diagonal lightning bolt and can indicate an upcoming trading opp

The indicator shows divergence between the slope of lines connecting price and MACD histogram peaks or troughs. A bullish divergence (actually a convergence) occurs when the lines connecting MACD troughs and the lines connecting the corresponding troughs on the price chart have opposite slopes and are converging. A bearish divergence occurs when the lines connecting MACD peaks and the lines connecting corresponding price peaks have opposite slopes and are diverging. In such a case, the indicato

Auto Fibo es un indicador desarrollado para mejorar sus operaciones manuales. Dibujará la proporción áurea de forma automática, ahorrando tiempo y facilitando su operativa. Adjunta el indicador a el gráfico y automáticamente se dibujará la proporción áurea exacta, ahorrándose el trabajo de tener que encontrar el punto crítico. La interfaz se ajusta según su ordenador a los puntos altos y bajos aproximados de la banda Este indicador corregirá la mayoría de los errores de selección de los puntos
FREE

Modificación multidivisa y multitemporal del Oscilador Estocástico. Puede especificar las monedas y plazos que desee en los parámetros. El panel muestra los valores actuales y las intersecciones de las líneas - Señal y Principal (cruce estocástico). Además, el indicador puede enviar notificaciones cuando se cruzan niveles de sobrecompra y sobreventa. Al hacer clic en una celda con un punto, se abrirá este símbolo y punto. Este es el escáner MTF.
La clave para ocultar el panel del gráfico es "

El algoritmo encuentra zonas de baja volatilidad basadas en el indicador UPD1 Trend Direction y construye el volumen horizontal máximo basado en el indicador UPD1 Volume Box . Como regla general, un fuerte movimiento de tendencia se produce al salir de la acumulación. Si el precio ha dejado la acumulación, entonces puede probar su volumen horizontal máximo (POC). Alertas inteligentes están disponibles en la configuración.
Parámetros de entrada
Ajustes básicos Bars Count – número de barras d
FREE

RSI divergence indicator finds divergences between price chart and RSI indicator and informs you with alerts (popup, mobile notification or email). Its main use is to find trend reversals in the chart. Always use the divergence indicators with other technical assets like support resistance zones, candlestick patterns and price action to have a higher possibility to find trend reversals. Three confirmation type for RSI divergences: RSI line cross 50 level Price returns to previous H/L Creat
FREE

This indicators automatically draws the Trend Channels for you once you've dropped it on a chart. It reduces the hustle of drawing and redrawing these levels every time you analysis prices on a chart. With it, all you have to do is dropped it on a chart, adjust the settings to your liking and let the indicator do the rest. Get an alternative version of this indicator here: https://youtu.be/lt7Wn_bfjPE For more free stuff visit: https://abctrading.xyz
Parameters 1) Which trend do you want
FREE

Modificación multidivisa y multitemporal del indicador Índice de Fuerza Relativa (RSI). Puede especificar las monedas y plazos que desee en los parámetros. Además, el panel puede enviar notificaciones cuando se cruzan niveles de sobrecompra y sobreventa. Al hacer clic en una celda con un punto, se abrirá este símbolo y punto. Este es el escáner MTF.
La clave para ocultar el panel del gráfico es "D" de forma predeterminada.
De manera similar al medidor de fortaleza de la moneda, el Panel pue

"Ppr PA" is a unique technical indicator created to identify "PPR" patterns on the currency charts of the MT4 trading platform. These patterns can indicate possible reversals or continuation of the trend, providing traders with valuable signals to enter the market.
Features: Automatic PPR Detection: The indicator automatically identifies and marks PPR patterns with arrows on the chart. Visual Signals: Green and red arrows indicate the optimal points for buying and selling, respectively. A
FREE
Buy Sell Signal Low TF gives buy/sell signals and alerts with up and down arrow at potential reversal of a pullback or a trend continuation pattern in low timeframe. This is an indicator which gives signals based on trend => It works best in trend market with the principle is to ride on the trend not trade against the trend.
The components of Buy Sell Signal Low TF: - The trend is determined by SMMA 13 , SMMA 21 and SMMA 35 ( can be changed manually to suit your preference). - The signal is
FREE

Si estás buscando un indicador confiable para operar con el concepto ICT, la Estructura de Mercado ICT proporciona un manual de usuario para los traders que utilizan estrategias más avanzadas. Este indicador todo en uno se enfoca en los Conceptos ICT (Conceptos de Dinero Inteligente). La Estructura de Mercado ICT intenta comprender cómo operan las instituciones, ayudando a predecir sus movimientos. Al comprender y utilizar esta estrategia, los traders pueden obtener valiosos conocimientos sobre
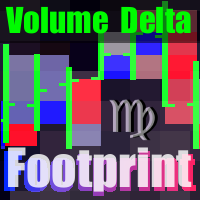
The indicator provides volume delta analysis and visualization. It calculates tick volumes for buys and sells separately, and their delta on every bar, and displays volumes by price clusters (cells) for a specified number of recent bars. This is a special, more descriptive version of the indicator VolumeDelta . This is a limited substitution of market delta (market depth) analysis, which is normally based on real volumes, but they are not available on Forex. The indicator displays the following
¿Sabe usted por qué MetaTrader Market es el mejor lugar para vender estrategias comerciales e indicadores técnicos? Con nosotros, el desarrollador no tiene que perder tiempo y fuerzas en publicidad, protección del programa y ajustes de cuentas con los compradores. Todo eso ya está hecho.
Está perdiendo oportunidades comerciales:
- Aplicaciones de trading gratuitas
- 8 000+ señales para copiar
- Noticias económicas para analizar los mercados financieros
Registro
Entrada
Si no tiene cuenta de usuario, regístrese
Para iniciar sesión y usar el sitio web MQL5.com es necesario permitir el uso de Сookies.
Por favor, active este ajuste en su navegador, de lo contrario, no podrá iniciar sesión.