Indicadores técnicos para MetaTrader 4 - 12

Scalping indicator. It takes into account volatility, price movement in the local interval and the direction of the current trend. Recommended timeframe - M5. Advantages: Low volatility when a signal appears ensures minimal movement against an open position. The indicator does not redraw its signals. There are alert signals. It is a great tool for day trading.
Settings: Name Description Period Indicator period Range of each bar in the period (pp.) The maximum size of each candle in the indicat
FREE

Break It Down is based on the Directional Movement Index and tells the trader when a market trend probably maxed out and ready to fall back. This pattern is more predictable when we apply this system only when the market is rallying but within a trading range. Because traders Sell off in fear the market often moves faster when declining! When this happens, good moves can occur. As traders are no longer interested in the trend, the volume will decline and the price will usually fall back on itsel
FREE

--- FREE VERSION - WORKS ONY ON EURUSD
------------------------------------------------------------------- This is a unique breakout strategy that is used for determination of the next short term trend/move. The full system is available on MQL5 under the name "Forecast System". Here is the link --> https://www.mql5.com/en/market/product/104166?source=Site Backtest is not possible, because calculations are done based on the data of all timeframes/periods. Therefore I propose you use the technol
FREE

What is Ikoku Kairi Band?
It is an oscillator indicator that combines Kairi Relative Index with Bollinger Band and displays signals with possible position entry points. It is meant to be used to trade against the trend, so it is perfect for scalping in a range market. It shouldn’t be used in a trend market. It will display arrow signals at possible entry points for buy and sell position. You can be notified when they appear with, push, alert or email notifications. You can customise the indica
FREE

RaysFX TMAT3 è uno strumento potente che combina due tipi di medie mobili per aiutarti a identificare e seguire le tendenze del mercato. L’indicatore utilizza una media mobile triangolare centrata (TMA) e un T3 Moving Average. Queste due medie mobili lavorano insieme per fornire segnali di trading chiari e tempestivi. Quando il T3 Moving Average è inferiore alla TMA, l’indicatore considera che la tendenza del mercato sia al rialzo e genera un segnale di acquisto. Al contrario, quando il T3 Movin

*This is tradingview bot converted to mql4*
The UT Bot Alert Indicator is an advanced technical analysis tool designed to help traders optimize their trading performance. This innovative indicator is based on the proven UT Bot system, which utilizes multiple indicators to deliver accurate signals that can help traders make better decisions. The UT Bot Alert Indicator provides a range of features that can help you stay on top of market trends and capitalize on opportunities. Here are some of i
FREE

COLORED TREND MA / MACD CANDLES draw MA Candles above/below Moving Average in a single color draw MA as a leading Line like a Supertrend draw MA as a Channel => MA High and Low draw MACD Candles above and below 0 and Signal-Line
Your Advantage: a simple view of the trend direction a simple view over the higher trend direction a calmer chart for the eye clear rules can be defined Settings: Bars to process : 6000 is my default, this value is up to you Value Quick-Set : pre-Settings MACD 12 / 26
FREE

Los niveles matemáticos de Murray se basan en las observaciones de Gann y su teoría de la cuadratura de los precios. Según Gann, el precio se mueve en 1/8 del rango. Estos 1/8 nos permiten obtener diferentes niveles de resistencia y soporte para un gráfico dado, los cuales tienen sus propias características. Después de una ruptura de los niveles -2 o +2 o cuando la volatilidad disminuye, se reconstruyen. Puede elegir qué período mostrar (historial actual o completo). Todas las líneas se trazan
FREE
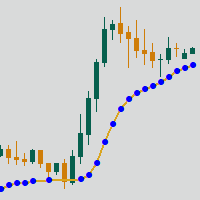
Adaptive Moving Average (AMA) is a trend indicator using moving average and market noise filter. Indicator feature are blue and red points, showing the power of trend. Recommendations for trading: Auxiliary Indicator Detecting trend Detecting power of trend Detecting potential reversal points Main indicator Shows entry points for swing trading Serves as dynamic support and resistance Recommendations for use: Any instrument Any timeframe Input parameters: Period - AMA period Fast Period - fast
FREE

High and Low Levels EMA Технический индикатор в помощь трейдеру. Однажды пришла идея при изучении индикатора Moving A verage ( MA ).
Так как мувинги эти сглаженное, среднее значения цены за выбранный период, то как и у обычной цены и у мувинга
должны быть «хаи и лои».
Данный индикатор, показывает уровни High и Low . Динамических уровней поддержки и сопротивления.
О понятии High и Low .
Хай — от английского high — обозначает наиболее высокую цену («рынок на хаях » — капитализ
FREE

TrendExpert TrendExpert is a sophisticated MQL trading strategy indicator developed by TradeAdviser LLC. It combines advanced technical indicators and risk management principles to deliver consistent and profitable trading outcomes in the financial markets. This strategy is designed to be robust, adaptable, and suitable for various market conditions. Key Features: Utilizes Moving Averages (MA) for trend identification and confirmation. Implements Stop Loss (SL) mechanisms for effective risk man
FREE
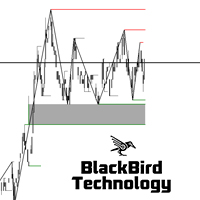
La liquidez es un aspecto importante en el mercado, especialmente para los inversores institucionales, ya que necesitan mucha liquidez para entrar o salir del mercado.
El dinero inteligente actúa como CREADOR DE MERCADO para el rebaño. En otras palabras: el dinero inteligente es la contrapartida del saliente de las posiciones largas o cortas que mantiene el rebaño. Si el rebaño es neto corto, entonces el dinero inteligente es neto largo. Si el rebaño es neto largo, entonces el dinero intelige

The indicator looks for consolidation (flat) in the market at a certain time, builds a box-channel and marks levels indented from it for a breakdawn. After crossing one of the levels, the indicator marks the zone for take profit and calculates the corresponding profit or loss in the direction of this entry on the panel. Thus, the indicator, adjusting to the market, finds a flat area of the market, with the beginning of a trend movement to enter it. Version for MT5: https://www.mql5.com/en/market
FREE
The indicator highlights the value in "over Sold" and "over Bought" zones. in addition, arrow indicates the return of the value from the extreme zone. Indicator can be easily customized by the user including change of colors, with, levels and arrows. Combination with other market signals and analysis is necessary and provides more stable results. Alert is also available for user.
FREE

Tipu Trend is a non-lag, non-repaint, smart indicator, that shows the trend of selected time frames.
Features Customizable Buy/Sell alerts, push alerts, email alerts, or visual on-screen alerts. As easy to trade indicator that smooths the noise in the price action. Highlights ranging markets. Add Tipu Panel (found here ) and unlock the following additional features. An easy to use Panel that shows the trend + signal of the selected time frames. Customizable Panel. The panel can be moved to any
FREE

Indicator for the 4th strategy of the Pipsurfer EA. This indicator will allow the user to visually see the points of entry for strategy 4 of Pipsurfer. In the settings you will be able to adjust the parameters to mix and match to your trading style and find the settings that you want to either trade manually or tune the EA to do. Strategy 4 uses a market structure trend continuation approach to trading and looks for confirmed highs in downtrends and confirmed lows in uptrends to find great trend
FREE

This indicator calculates buy and sell signals by using MACD indicator on two timeframes. MACD is a trend-following showing the relationship between two moving averages of the closing price. The MACD is calculated by subtracting the 26-period Exponential Moving Average (EMA) from the 12-period EMA.The result of that calculation is the MACD line. A nine-day EMA of the MACD called the "signal line".
This indicator has 2 modes to calculate the buy/sell signals: - MACD crosses 0 line - MACD cro
FREE

Simple Trading System Update !!! Follow this link to see our 2024 Strategy !!! ( Download the EAs scanner )
INTRODUCTION : The strength meter is an trading tool that is used to identify trending and consolidating markets based on the percentage rate.
HOW TO USE IT :
You can use this indicator with Deal Trading Trend >> Click Here << To use this trading tool to identify trending and consolidating markets (the most important part)
FREE
Time your Entry and Exits with Average True Range (ATR) Trailing Stops ATR Trailing Stops are primarily used to protect capital and lock in profits on individual trades but they can also be used, in conjunction with a trend filter, to signal entries. The indicator will help make your calculation of stop loss easier as it will be visually aiding you in choosing where to put your stoploss level on the chart by calculating the current value of ATR indicator. For those who are unfamiliar with ATR, i
FREE

Peak Trough Analysis is the great tool to detect peaks and troughs in your chart. Peak Trough Analysis tool can use three different peaks and troughs detection algorithm. The three algorithm include the orignal Fractals Indicator by Bill Williams, the Modified Fractals indicator and ZigZag indicator. You can use this peak and trough analysis tool to detect the price pattern made up from Equilibrium Fractal-Wave process. For further usage, there are good guide line on how to use this peak trough
FREE

The VWAP Level indicator is a technical analysis tool that calculates the weighted average price for the traded volumes of a specific asset. The VWAP provides traders and investors with the average price of an asset over a specific time frame.
It is commonly used by investors to compare data on "passive" trading operations, such as pension funds and mutual funds, but also by traders who want to check if an asset has been bought or sold at a good market price.
To calculate the VWAP level we
FREE
2 EMA Color Alerts Indicator is a powerful tool for any trader looking to stay on top of market movements. By using exponential moving averages (EMAs), this indicator can provide early warning signals for potential market reversals and trend changes. One of the key features of the 2 EMA Color Alerts Indicator is its customizable alerts. With this feature, traders can set their own parameters for receiving alerts, such as the EMA periods and the type of alert (e.g. sound, pop-up, email). This al
FREE

Introduction Excessive Momentum Indicator is the momentum indicator to measure the excessive momentum directly from raw price series. Hence, this is an extended price action and pattern trading. Excessive Momentum Indicator was originally developed by Young Ho Seo. This indicator demonstrates the concept of Equilibrium Fractal Wave and Practical Application at the same time. Excessive Momentum detects the market anomaly. Excessive momentum will give us a lot of clue about potential reversal and

PYTHONFX
INCEPTION TRADING SYSTEM
THE BROKERS WORST NIGHTMARE...
IMPORTANT! After the purchase please send me a private message to receive the installation manual and the setup instructions.
We proudly introduce the PYTHONFX ROYAL CIRCLE Inception trading system, your key to financial freedom. This is the brokers worst nightmare. Seriously! Modern market conditions require modern solutions & if you are still struggling to analyse the charts and struggling to find consistency in the

ECM Elite Channel is a volatility-based indicator, developed with a specific time algorithm, which consists of finding possible corrections in the market.
This indicator shows two outer lines, an inner line (retracement line) and an arrow sign, where the channel theory is to help identify overbought and oversold conditions in the market.
The market price will generally fall between the boundaries of the channel. If prices touch or move outside the channel, it's a trading opportunity.
The

The RSI Basket Currency Strenght brings the RSI indicator to a new level. Expanding the boundaries of TimeFrames and mono-currency analysis, the RSI Multi Time Frame Currency Strenght take the movements of each currency that composes the cross and confront them in the whole basket of 7 crosses. The indicator works with any combination of AUD, CAD, CHF, EUR, GBP, JPY, NZD, USD pairs and with full automation takes in account every RSI value for the selected Time Frame. After that, the ind

Introducing Auto Trendline Pro : Your Ultimate Trading Companion Are you tired of manually drawing trendlines on your forex charts? Do you wish for a tool that can simplify your trading while providing timely alerts? Look no further, because Auto Trendline Pro is here to revolutionize your trading experience. In the fast-paced world of forex trading, staying ahead of the curve is essential. Identifying trends, both upward and downward, can be a game-changer. This is where Auto Trendline Pro s

MA Crossover Arrows is a simple indicator that draws arrows and alerts when two moving averages crossover.
Supported types of moving averages Simple Exponential Smoothed Linear Weighted
Supported Price types Close Open High Low Median Price (HL/2) Typical (HLC/3) Weighted Close (HLCC/4) When the fast moving average crosses above the slow moving average, a green up arrow will appear on the chart. When the fast moving average crosses below the slow moving average, a red down arrow will appear
FREE

Si te gusta este proyecto, deja una revisión de 5 estrellas. Seguir en instagram: borelatech A medida que las instituciones comercializan grandes volúmenes, no es raro que
traten de intentar
defender su posición en niveles porcentuales específicos. Estos niveles servirán como soporte natural y resistencia que usted puede
utilizar
para entrar en un comercio o estar consciente de posibles peligros contra su
posición. Un ejemplo de porcentajes usados comunes son 0.25% y 0.50% en EURUSD para
FREE

This is the free version of the Supply&Demand + Trendline + Trend tool. This version works only with EURCHF! You find the full version here: https://www.mql5.com/en/market/product/67274
PAAIOS stands for Price Action All In One Solution. And that is the purpose of the Indicator. It should give you a tool to improve your trading decisively because you get the crucial information at a glance. The indicator simplifies the search for strong signals. It shows trend lines, demand and s
FREE

Turbo Trend technical analysis indicator, which determines the direction and strength of the trend, and also signals a trend change. The indicator shows potential market reversal points. The indicator's intelligent algorithm accurately determines the trend. Uses only one parameter for settings. The indicator is built for simple and effective visual trend detection with an additional smoothing filter. The indicator does not redraw and does not lag. Take profit is 9-10 times larger than stop loss

RaysFX Supertrend + Alert RaysFX Supertrend è un indicatore di tendenza superiore progettato per i trader che desiderano avere un vantaggio nel mercato. Questo indicatore utilizza una combinazione di CCI (Commodity Channel Index) e ATR (Average True Range) per identificare le tendenze del mercato e fornire segnali di trading accurati. Caratteristiche principali Indicatori CCI e ATR : Utilizza due degli indicatori più popolari e affidabili per identificare le tendenze del mercato e generare se
FREE

This scanner shows the trend values of the well known indicator SuperTrend for up to 30 instruments and 8 time frames. You can get alerts via MT4, Email and Push-Notification as soon as the direction of the trend changes.
Important Information How you can maximize the potential of the scanner, please read here: www.mql5.com/en/blogs/post/718074
You have many possibilities to use the scanner. Here are two examples: With this scanner you can trade a top-down approach easily. If two higher time

PLEASE NOTE You can customize the settings of Fast EMA, Slow EMA, MACD SMA & Main SMA. The accuracy will change as per your settings.
100% Non repaint indicator
Pre-alert (get ready) signals
Non-delay indications
24/7 signals
100% No lag
No recalculating The arrows wont repaint even if the signal fails, or you refresh or restart the mt4 Indicator is based on simple crossover strategy of main line and signal line of MACD indicator in consideration with zero line and Main SMA. The best
FREE
Apollo Pips Generator es el indicador que proporciona señales en la dirección de la tendencia. El indicador proporciona múltiples puntos de entrada para que siempre pueda encontrar una oportunidad comercial de la que beneficiarse. Presta atención a las capturas de pantalla. Las capturas de pantalla muestran la herramienta Generador de pips en combinación con mi otra herramienta, que está representada por el canal con señales de estrella que indican puntos altos y bajos. Esta combinación le propo

The MACD Signal Candle indicator changes color according to the MACD trends. Colored Candles, based on MACD.
HOW IT WORKS
For a Buy: -If the indicator is above zero, the market is bullish. -If the market is bullish, you can take a stand with green candle signals. For a Sell: -If the indicator is below zero, the market is bearish. -If the market is bearish, you can take a stand with the red candles.
FREE
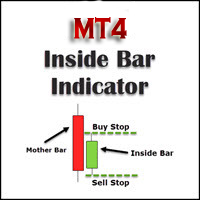
This inside bar indicator MT4 is suitable if you are doing inside bar trading. So what this MT4 inside bar indicator does is identifies inside bars for you as they form on your charts. Inside bar is a famous trading pattern in which the bar carry higher low and lower high compared with the previous bar, also known as mother bar. With, a lesser time frame like the 1 hour chart, daily inside bar chart will sometimes appears to be similar to a triangle pattern.
Inputs AlertOn - enable alerts Ema
FREE

Note: This is an Arrows Only Indicator. Get paid scanner or free TDI extra indicators here: https://abiroid.com/product/tdi-sharkfin-arrows-and-scanner/
About:
This is a TDI Arrow Indicator for finding the Shark Fin Pattern. It will show an arrow in the current bar if RSI sharkfin is finished forming in previous bar.
What is Shark Fin TDI Pattern?
Upper Shark Fin: In TDI Indicator when Green RSI breaks above a certain level and also breaks upper Volatility band and then breaks below that
FREE
AW Super Trend: este es uno de los indicadores de tendencia clásicos más populares. Tiene una configuración simple, le permite trabajar no solo con la tendencia, sino que también muestra el nivel de stop loss, que se calcula mediante este indicador. Beneficios:
Instrumentos: Pares de divisas , acciones, materias primas, índices, criptomonedas. Marco de tiempo: М15 y superior. Horario de negociación: todo el día. Muestra la dirección de la tendencia actual. Calcula el stop loss. Se puede uti
FREE

"BIG FIGURE INDICATOR" identifica y dibuja automáticamente líneas horizontales en los gráficos de precios en niveles específicos, como números enteros o medios números (por ejemplo, 1.0000 o 1.5000 en el comercio de divisas). Estos niveles se consideran psicológicamente significativos porque representan números redondos en los que los grandes traders e inversores pueden centrarse, lo que lleva a posibles niveles de soporte o resistencia. El indicador de gran número puede ayudar a los traders a
FREE

Introducing the "Extreme Exhaustion Levels": A powerful tool for traders looking to identify market exhaustion and potential trend reversals. The Exhaustion Indicator is an advanced technical analysis tool that helps traders identify when markets are overbought or oversold, potentially indicating an imminent reversal in the trend. With a unique combination of price action, moving averages, and Bollinger Bands, the Exhaustion Indicator provides traders with a comprehensive view of market conditi
FREE

Trend Lines Cross This indicator will alert you on any cross of a Trendline. You can draw up to two trend lines and form a channel, a pennant , a triangle or a simple trend and when the price crosses either trend line the indicator will provide you with alerts that you define plus an up or down arrow when the cross happened. How to: Draw the 1st trendline and name it tl1. Draw the 2nd trendline and name it tl2. Select which type of alerts you would like in the indicator properties and you a
FREE

Bouncing Bollinger tells the trader when the market is about to reverse using 3 candlestick formations as well as the Directional Movement Index Indicator.
When the previous candle has dipped into the upper or lower Bollinger Band and a candle signal appears along with DMI showing un-volatile a signal occurs showing possible reversal ahead. Features :
A practical way of recognising when a new reversal is about to occur. Choose your favourite signal color. Send alerts to either your PC,
FREE
Download the USDJPY free version here.
Scalping Strategy
BUY SELL
Having a strategy in the market is one of the main conditions for trading. The presence of various and complicated indicators and tools sometimes makes trading difficult, and the user gets confused after trying various methods and gets stuck in a loss cycle, the result of which is usually clear. This indicator is a simple strategy based on the detection of pivots and short-term trends, which helps you to easily trade i
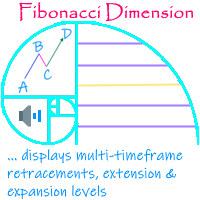
'Fibonacci Dimension' indicator allows display of preset or user-defined multi-timeframe Fibonacci levels. It automatically takes the previous high and low for two user-defined timeframes and calculates their Fibonacci retracement levels. It also considers the retraced level to draw the expansions on every change of price. A complete visual dimension in multiple timeframes allows deriving profitable strategies for execution. The functionalities included are: Provides an option to consider a pres
FREE

System Trend Pro - This is the best trend trading indicator!!!
The indicator no repaint!!! The indicator has MTF mode, which adds confidence to trading on the trend ( no repaint ). How to trade? Everything is very simple, we wait for the first signal (big arrow), then wait for the second signal (small arrow) and enter the market in the direction of the arrow.
(See screens 1 and 2.) Exit on the opposite signal or take 20-30 pips, close half of it, and keep the rest until the oppo

ZigZag Fibo Retracement Indicator Optimize Your Trading Strategy! Are you seeking to optimize your trading strategy in the financial markets? Explore the unique features of the ZigZag Fibo Retracement Indicator, a powerful tool designed to help you identify potential support and resistance levels based on the combination of ZigZag patterns and Fibonacci ratios. Integration of ZigZag Patterns and Fibonacci: The ZigZag Fibo Retracement Indicator combines the effectiveness of ZigZag patterns, helpi
FREE

Calculating the number of lots needed so as to make sure you are risking a specific percent of account balance can be tedious. Luckily, there are websites that make this task a lot easier. This indicator takes things to the next level as it ensures you don’t have to leave the metatrader platform to perform these calculations.
The lot-size calculator is a simple calculator that works in all forex currency pairs, BTCUSD, US500, HK50 and XTIUSD. For more free stuff: http://abctrading.xyz
FREE

RECOMMEHDATION Trade with this indicator for 2-3 weeks and you will feel significant progress in your trading. This indicator is developed based on the use of HMA, Laguerre, CCI . Indicator will help you: accurately enter the market; reduce the number of errors when opeinng orders; visually see market movement; predict price movement(in absent of significant news); do not rush to close profitable trades prematurely and increase profit; do not rush to enter the market and wait for "easy prey".
FREE
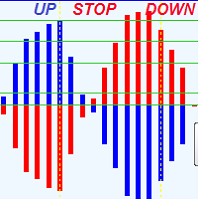
This indicator that shows precise price direction ,and force of this direction, reversals ,added it to any chart and you supress any confusion .
It calculs force of current direction and Predicts price reversals with high degree of accuracy withs its key levels and it is great for scalping , Or swing trading . For any time frame the following behavor is the same : Blue Histogram above 0.0 means that a buyers dominates price movement In other side , Red Histogram Above 0.0 means sellers

The Pivot Indicator is a vital tool for technical analysis used by traders in the financial markets. Designed to assist in identifying potential reversal points or trend changes, this indicator provides valuable insights into key levels in the market. Key features of the Pivot Indicator include: Automatic Calculations: The Pivot Indicator automatically calculates Pivot Point, Support, and Resistance levels based on the previous period's high, low, and close prices. This eliminates the complexity
FREE

This is one of the most popular and highly rated volatility index (VIX) indicators on the market. It provides the same readings as the VIX does for stock indexes. However, this indicator works across all asset classes. VIX Fix Finds Market Bottoms. This indicator is not for inexperienced traders. Use it for day and swing trading. MT5 Version - https://www.mql5.com/en/market/product/112284
Bernard Baruch summed it out best: "Markets fluctuate." The Chicago Board Options Exchange (CBOE) Vola
FREE

本指标 基于 Zigzag 基础上... 增加了: 1.增加了箭头指示,使图表更鲜明 2.增加了价格显示,使大家更清楚的看清价格. 3.增加了报警等设置,可以支持邮件发送 原指标特性: 1.基本的波段指标构型. 2.最近的2个ZIGZAG点不具有稳定性,随着行情而改变,(就是网友所说的未来函数) 3.原指标适合分析历史拐点,波段特性,对于价格波动有一定的指导性.
Zigzag的使用方法一 丈量一段行情的起点和终点 (1)用ZigZag标注的折点作为起点和终点之后,行情的走势方向就被确立了(空头趋势); (2)根据道氏理论的逻辑,行情会按照波峰浪谷的锯齿形运行,行情确立之后会走回撤行情,回撤的过程中ZigZag会再次形成折点,就是回撤点; (3)在回撤点选择机会进场,等待行情再次启动,止损可以放到回撤的高点。 一套交易系统基本的框架就建立起来了。 Zigzag的使用方法二 作为画趋势线的连接点 趋势线是很常见的技术指标,在技术分析中被广泛地使用。 但一直以来趋势线在实战中都存在一个BUG,那就是难以保证划线的一致性。 在图表上有很多的高低点,到底该连接哪一个呢?不同的书上画趋势线的方
FREE
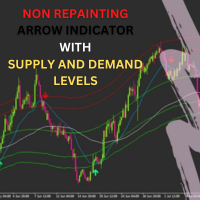
*****ARROWS NON REPAINT ***** Trade With Sam Simple Strategy Guide : https://www.mql5.com/en/blogs/post/740855
MT5 version of the indicator
Try Out and see the Difference
The Sam's Trend Blaster indicator tracks the market trend with an unmatched reliability, by ignoring sudden fluctuations and market noise. It has been designed to trend-trade intraday charts and small timeframes. Its winning ratio is around 85%. This is an arrow indicator that shows precise price reversals. A great ar

Volume Gives Depth To Price Action! Volume Critical can accurately locate the cheapest areas to place trades. Enter reversals as early as possible to get the best Risk Reward setups!
Features Aggressive algorithm that anticipates reversals Volume Classifications Gray Histograms - Normal Volume, average market activity Orange Histogram - Trending Volume, increased market activity Pink Histograms - Overbought Volume, we can wait for further confirmation to sell Blue Histograms - Oversold Condit

This indicator identifies swing highs and swing lows in the price chart by comparing the Highs and lows of each candle to a specified number of candle before and after it. Once it has identified the swing highs and swing lows, it can use them to determine potential support and resistance levels. A support level is formed when the price drops and bounces back up from a swing low, indicating that there is buying pressure at that level. A resistance level is formed when the price rises and reve
FREE

TwoMA Crosses indicator displays arrows based on whether the short term moving average crosses above or below the long term moving average. A moving average doesn't predict price direction. Instead, it defines the current direction. Despite this, investors use moving averages to filter out the noise. Traders and investors tend to use the EMA indicator, especially in a highly volatile market because it’s more sensitive to price changes than the SMA.
Download for FREE TwoMA Crosses EA from th
FREE

El indicador le permite determinar instantáneamente la tendencia actual por color y niveles de Fibonacci. El panel HTF muestra la tendencia actual de los períodos más altos, lo que ayuda a determinar la fuerza de la tendencia. Operar en la tendencia al cambiar el color de las velas o operar en contra de la tendencia cuando el precio rompe los niveles extremos del indicador FIBO Trend PRO Ventajas de FIBO Trend PRO: El indicador nunca vuelve a pintar ni cambia sus valores Muy fácil de usar e in

Análisis de trading preciso al alcance de tu mano: software de análisis de trading de nueva generación El software de análisis de trading convencional disponible en el mercado a menudo solo proporciona estadísticas de la relación entre ganancias y pérdidas por hora o por semana, lo que no satisface la necesidad de un análisis de trading más preciso. Sin embargo, en el mercado de trading real, cada día presenta circunstancias únicas. Los lunes son tranquilos, los miércoles son activos con un tri
FREE

Este indicador predice el movimiento más probable de los precios a corto plazo basándose en unos complejos cálculos matemáticos.
Particularidades Estimación del movimiento actual del precio; Cálculo de la tendencia actual; Cálculo de las líneas más importantes de soporte y resistencia; Algoritmos optimizados para realizar los cálculos matemáticos complejos con el mínimo desgaste de recursos de sistema; Autoadaptación para conseguir el mejor resultado y, por consecuencia, la posibilidad de trab

Introduction This indicator detects volume spread patterns for buy and sell opportunity. The patterns include demand and supply patterns. You might use each pattern for trading. However, these patterns are best used to detect the demand zone (=accumulation area) and supply zone (=distribution area). Demand pattern indicates generally potential buying opportunity. Supply pattern indicates generally potential selling opportunity. These are the underlying patterns rather than direct price action. T
FREE

Presentamos ProEngulfing: su indicador profesional de patrón Engulf para MT4 Desbloquee el poder de la precisión con ProEngulfing, un indicador de vanguardia diseñado para identificar y resaltar patrones Engulf calificados en el mercado de divisas. Desarrollado para MetaTrader 4, ProEngulfing ofrece un enfoque meticuloso para el reconocimiento de patrones Engulf, asegurando que solo reciba las señales más confiables para sus decisiones comerciales. Cómo funciona ProEngulfing: ProEngulfing utili

MP Squeeze Momentum is a volatility and momentum indicator derivated of "TTM Squeeze" volatility indicator introduced by John Carter. It capitalizes on the tendency for price to break out strongly after consolidating in a tight range. Introduction: The volatility component of MP Squeeze Momentum measures price compression using Bollinger Bands and Keltner Channels. If the Bollinger Bands are completely enclosed within the Keltner Channels, that indicates a period of very low volatility. This st
FREE

IceFX SpreadMonitor - indicador especial que registra el valor del spread. Muestra el spread actual, el mínimo/máximo y el medio. Estos valores quedan visibles incluso después del reinicio. Además, SpreadMonitor puede guardar los valores necesarios de spread en un archivo CSV para su posterior análisis.
FREE

CyberZingFx Trend Reversal Indicator - your go-to solution for accurate and reliable trend reversal signals. With its unique trading strategy, the indicator offers you Buy and Sell Arrow signals that do not repaint, making it a reliable tool for catching Swing Highs and Swing Lows.
SCROLL DOWN TO VIEW SCREENSHOTS AND WATCH VIDEO ________________________________________________________________ Trading using CyberZingFx Trend Reversal is Simple Using the CyberZingFx Trend Reversal Indicator is e
FREE

Pattern Detector can detect the most common 1, 2 and 3 candlestick patterns and send notifications when detected. Demo version working on AUDNZD can be found https://www.mql5.com/en/market/product/29189
How does it work Add the indicator to the chart you want to analyze and select which patterns to detect, the indicator will draw the detected patterns. You can also be notified via alert, app and email when a new pattern is detected.
Parameters Indicator Name - Used to draw the graphical obje
FREE

Are you tired of plotting fibonacci retracements or extensions manually? This indicator displays fibonacci retracements or extensions automatically, calculated from two different price points, without human intervention or manual object anchoring. [ Installation Guide | Update Guide | Troubleshooting | FAQ | All Products ] Easy to use Manual anchoring is not needed Perfect for price confluence studies The indicator evaluates if retracements or extensions are needed Once drawn, you can manually
FREE

The Trade by levels indicator is designed to automatically determine the formation of a model for entering the market on the chart of the selected instrument.
Definitions: ⦁ BFl is the bar that formed the level. ⦁ BCL1 and BCL2 bars, confirming the level.
The graphical model: ⦁ levels high\low the bars BFL and BCL1 must match the accuracy to the point ⦁ there can be any number of bars between BFL and BCL1. ⦁ between BCL1 and BCL2 intermediate ba
FREE

This Indicator was used on EA Advanced Fibo levels . Indicator is designed to trade for most popular Fibonacci strategy that's completely automated. It automatically identifies and show Entry levels included Support/ Resistance Zones , according to the time zone candle by Fibonacci levels. As well as the traditional Fibonacci tool also included. However, it is very user friendly rather than default available one. On the other hand one more tool included. It automatically identifies real Suppo
FREE

El Average True Range ( ATR ) es una medida de la volatilidad del mercado durante un número determinado de días. No debe esperar un gran movimiento de continuación cuando el precio haya alcanzado el final del rango. Se considera que el mercado se ha quedado sin combustible. Si el precio no ha alcanzado el límite, aún tiene margen de movimiento. La fórmula del indicador le permite calcular los niveles Alto-Bajo tanto en conjunto como individualmente. También puede utilizar estos niveles como sopo
FREE
Compruebe lo fácil y sencillo que es comprar un robot en la MetaTrader AppStore, la tienda de aplicaciones para la plataforma MetaTrader.
El Sistema de pago MQL5.community permite efectuar pagos con ayuda de PayPal, tarjeta bancaria y los sistemas de pago más populares. Además, le recomendamos encarecidamente testar el robot comercial antes de la compra, para así hacerse una idea más completa sobre él.
Está perdiendo oportunidades comerciales:
- Aplicaciones de trading gratuitas
- 8 000+ señales para copiar
- Noticias económicas para analizar los mercados financieros
Registro
Entrada
Si no tiene cuenta de usuario, regístrese
Para iniciar sesión y usar el sitio web MQL5.com es necesario permitir el uso de Сookies.
Por favor, active este ajuste en su navegador, de lo contrario, no podrá iniciar sesión.