Nuevos indicadores técnicos para MetaTrader 4 - 41

Night Ghost - Indicador de flecha para opciones binarias.
¡Este es un asistente confiable para usted en el futuro!
- Sin redibujar en el gráfico
-¡Funciona muy bien en todos los pares de divisas!
-Indicador de precisión de hasta el 90% (Especialmente de noche)
-No es necesario configurar durante mucho tiempo (configurar perfectamente para opciones binarias)
- Señales no tardías
- La aparición de una señal en la vela actual.
-Perfecto para el período M1 (¡No más!)
- Color de ve
AverageDirectionalIndex : fórmula de indicador mejorada. Esta versión de ADX determina con mucha más precisión los puntos de inversión del precio y la dirección de la tendencia actual. Además, utilizando este indicador, puede determinar la fuerza de la tendencia. Cuando la línea verde cruza la línea roja de abajo hacia arriba, significa que la tendencia está aumentando o que se está formando un retroceso temporal. Cuando la línea roja cruza la línea verde de arriba hacia abajo, significa que la

Este es un indicador de tendencia. El indicador refleja los miles de cambios en los precios del mercado con una línea sólida roja y verde. El cambio de color de la línea sólida indica que el mercado ha cambiado y que es muy probable que haya una reversión! La línea verde indica que el precio de mercado está en un período ascende nte. La línea roja indica que el precio de mercado está en un período descendente.
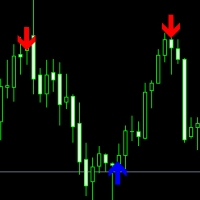
Price Reversal Pro : puntos en los que el precio se invertirá con un 95 % de probabilidad. Esta información ayudará a todos los comerciantes a abrir operaciones de manera efectiva. El indicador en el gráfico dibuja flechas en qué lugar y en qué dirección se invertirá el precio. Debe esperar a que el indicador dibuje una flecha y abrir una orden en la dirección indicada. Esta es la estrategia comercial más simple. El indicador no vuelve a dibujar sus flechas y muestra reversiones de precios para
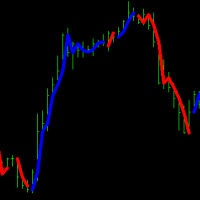
Indicador de tendencia para determinar la dirección de la tendencia. El indicador escanea el mercado en busca de reversiones bruscas de precios y muestra al comerciante dónde comienza una tendencia bajista o alcista. Cuando el mercado se mueve lateralmente, el indicador deja de dibujar líneas de señal. Gracias a este indicador, cada comerciante puede determinar rápidamente la dirección del mercado y abrir las órdenes correctas en la dirección del movimiento del precio. También puede analizar el

Forex Gump Trend es un indicador universal para la determinación altamente efectiva de la dirección de la tendencia. Si identifica la tendencia correctamente, este es el 95% del éxito comercial, ya que podrá abrir operaciones en la dirección del movimiento del precio y beneficiarse de ello. El indicador de tendencia Forex Gump ayuda a los operadores con un alto grado de eficiencia a determinar la dirección de la tendencia actual, así como los puntos de inversión de la tendencia. La dirección de

DESCRIPTION
The CHAOS INDICATOR has been developed to be used for the TRADING STRATEGY OF CHAOS, as described in the book. The book is in italian language only and can be obtained only on my website indicated below.
DATAS COLLECTED AND SHOWN ON GRAPHS
The CHAOS INDICATOR apply easily to any graph and any asset, and it is a TRADING FACILITATOR, as it identify immediately the following items on any graph: - The GP (= RIGHT PRICE) i.e. the price to which the asset should be attracted within 24
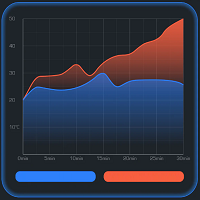
Fixation Trend indicator showing buy and sell areas. The indicator follows the price movement, works at the opening price. It also displays information about the trend following the breakout of the minimum and maximum. The indicator has very simple but effective graphics: above the opening price, an orange dot is displayed - a sell signal, below the opening price - blue, a buy signal. The indicator also accompanies the signals with a sound alert and a pop-up window notifying the signal on the op
Are you tired of the constant ups and downs? Do not become a victim of unstable market movements, it's time to get rid of it somehow! Already now you can use The Trend Setter solutions to balance the price movement analysis and get a clearer picture of the price action.
The Trend Setter is a trend indicator for the MetaTrader 4 trading platform. If you don't have your own trading strategy yet, you can use our ready-made trading strategy. The indicator will help in finding entry points when an

Polynomial Trend - A tool that allows you to determine the direction and strength of a trend. Unlike most indicators, Polynomial Trend finds longer-term trends and gives fewer false signals. This indicator allows you to find the most likely trend reversal points b allows you to identify the current market phase (uptrend, downtrend).
This indicator displays arrows of different colors depending on the current state of the market and thus signals the user about a change in trend. It is easy to u

What are "pivot points"? Pivot point analysis is often used in conjunction with the calculation of support and resistance levels, as is the case with trend line analysis. Pivot point analysis calculates the first support and resistance levels using the trading range width between the pivot point and the previous day's high or low price. The second support and resistance levels are calculated using the entire width between the previous day's high and low prices.
Looking for a quality pivot poi

Introduction to Chart Pattern MT Chart Pattern MT is a chart pattern scanner to detect the triangle pattern, falling wedge pattern, rising wedge pattern, channel pattern and so on. Chart Pattern MT uses highly sophisticated chart pattern detection algorithm. However, we have designed it in the easy to use with intuitive user interface. Chart Pattern MT will show all the patterns in your chart in the most efficient format for your trading. You do not have to do tedious manual pattern detection an

- 50% OFF -
Telegram group : https://t.me/+5RIceImV_OJmNDA0 MT5 version : https://www.mql5.com/en/market/product/85917?source=Site+Market+Product+Page
Master Pullback is a complete system that gives unique trading opportunities and a clear indication of the market: trend, signals as well as stop loss and take profit levels. This system has been designed to be as simple as possible and detects extreme overbought and oversold zones, support and resistance levels, as well as the major trend. You
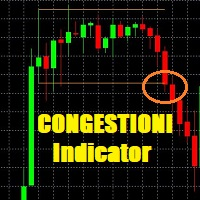
This indicator is very usefull to TRADE Trading Ranges and helps identify the following TREND. Every Trader knows that any market stay 80% of the time in trading ranges and only 20% of the time in TREND; this indicator has been built to help traders trade trading ranges. Now instead of waiting for the next TREND, You can SWING TRADE on trading ranges with this simple yet very effective indicator.
TRADING with CONGESTIONI INDICATOR:
The CONGESTIONI Indicator identify a new trading range and a

This indicator is designed for those people who want to trade and make money on any instrument and time frame. It gives a very good point to enter the market, to trade is very simple, arrows will show when to open a deal, set and trade without thinking about anything, stop-loss and take profit, set everything depends on your trading style, who is scalping and who keeps the deal for a few days.

The Mechanism Trend indicator is a hybrid indicator that shows the moments for entering the market with arrows. This indicator was created on the basis of the original indicators for searching for extreme points, the indicator is well suited for determining a reversal or a large sharp jerk to one side.
When the trend changes, the Mechanism Trend indicator uses color signaling: green - when changing from a downtrend to an uptrend, and red - vice versa, to a downtrend. You can use the indicator

This indicator provides several drawing tools to assist in various methods of chart analysis.
The drawings will keep their proportions (according to their handle trendline) across different chart scales, update in real time, and multiple drawings are supported.
#
Drawing Option
Description
1 Grid box draggable boxed grid, user defines rows x colums, diagonal ray option 2 Grid partial or fullscreen grid, sized by handle line 3 Grid flex a diagonal grid, sized and sloped by handle line

Market Profile 3 MetaTrader 4 indicator — is a classic Market Profile implementation that can show the price density over time, outlining the most important price levels, value area, and control value of a given trading session. This indicator can be attached to timeframes between M1 and D1 and will show the Market Profile for daily, weekly, monthly, or even intraday sessions. Lower timeframes offer higher precision. Higher timeframes are recommended for better visibility. It is also possible t
FREE

Flow Trend BLACK FRIDAY: 50% DISCONT > OLD PRICE 100$ > NOW 50$
Flow trend is designed to detect the market trend with special calculation and a combination of Bolinger band and statistical moving period
to detect the market trend without frequency change and fault.
This indicator is designed with simple parameters to use fast and easy and helpful tools to trade in a pure direction and set your SL/TP with this indicator cloud system.
FREE

Relative Volume or RVOL is an indicator that averages the volume of X amount of days, making it easy to compare sessions volumes.
The histogram only has 3 colors:
Green - Above average volume
Yellow - Average volume
Red - Below average volume
The default setting is 20 days, which corresponds more or less to a month of trading.
With the data obtained from this indicator you can better gauge the commitment behind a move. For example, you will be better equipped to judge if a bre
FREE

Hello all. This indicator helps you to open a trade, when break out occurred, also you can add to your position and ride it if trend continued. I use it on 1-5 min chart, as you can use short stop loss. Also profit target should be small as well. It is better to enter few small position, so you can book some profit early and ride the rest for bigger gains. Look at the past to have a plan. Enjoy.
FREE
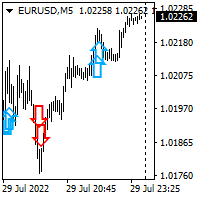
Hello all. This indicator helps you to open a trade, when break out occurred, also you can add to your position and ride it if trend continued. I use it on 1-5 min chart, as you can use short stop loss. Also profit target should be small as well. It is better to enter few small position, so you can book some profit early and ride the rest for bigger gains. Look at the past to have a plan. Enjoy.
FREE
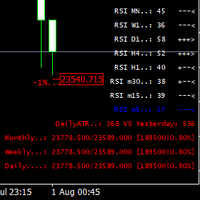
This indicator was created most for personal use. I decided to look up the last 3 bars of RSI, it is good for scalping or for weekly trading and looks as universal fx-toy. In menu you can turn on daily percentage gain info, it is good for crypto as for me, weekly and monthly gains also included as informers. Short ATR helps to determine when price was stopped and entry for pulse pump/dump. The filter of numbers of RSI can be tuned for overbought/oversold values with colors you needed. Exam
FREE

A useful dashboard that shows the CCI values for multiple symbols and Time-frames.
It can be easily hidden/displayed with a simple click on the X top left of the dashboard.
You can input upper and lower CCI values and the colours can be set to show when above/below these values. The default values are 100 and 30-100 There are also input colours for when the CCI is positive or negative (but not exceeding the upper/lower levels
Symbols and time-frames are input separated by commas.
Sym
Divergence is one best ways to trade the financial market as it is a leading indicator of price action that detect high probability reversal and continuation setups. The AlgoKing Divergence Detector is an RSI and Stochastics Indicator with Divergence Detection. Features Hidden Divergence for trend continuation. Standard or Normal Divergence for trend reversal. Screen Alerts. MetaQuotes Notifications. Email Notifications. RSI Indicator built in. Stochastics Indicator built in. Types of Divergen
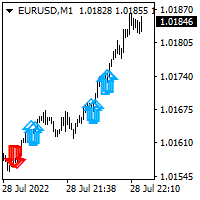
This indicator helps you to build position and profit when market turns in your favor. You will build your full position by trading many small position. Once blue arrow appear on the chart, you could add long position. Once red arrow appear on the chart, you could add short position. I personally spread my full size position in to 5-10 small position. I use small target of 2-5 pips on eurusd pair.
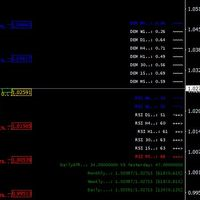
I decided to add parallel function with DeMarker to free version of my indicator with RSI MTF. it is good for scalping or for weekly trading and looks as universal fx-toy. In menu you can turn on daily percentage gain info, it is good for crypto as for me, weekly and monthly gains also included as informers. Short ATR helps to determine when price was stopped and entry for pulse pump/dump. The filter of numbers of RSI can be tuned for overbought/oversold values with colors you needed. Examp

Long term stats is a trend indicator. As the name suggests, it computes long term running average, standard deviation and min/max values Average and standard deviation are plotted on the graph and deviation value is taken as input parameter (similarly to bollinger bands). Historical minimum and maximum are plotted on the graph and updated for each bar, considering historical time series slope. (this is to somehow account for inflation/deflation) Can be used as filter for signals, as trigger to
FREE

Las líneas de resistencia de velocidad son una poderosa herramienta para determinar la tendencia y las líneas de resistencia. El indicador construye líneas utilizando gráficos extremos y fórmulas matemáticas especiales. El indicador se puede utilizar para determinar la dirección de la tendencia y los puntos de inversión.
<---------------------------->
Parámetros del indicador:
"Depth of search" - profundidad (en barras) de búsqueda de gráficos extremos "Back step of search" - distancia mí
FREE

Máximos y mínimos de UR
UR Highs&Lows realiza un análisis en profundidad del movimiento de precios y su volatilidad, y crea un canal dentro del cual se mueve el precio. Ese canal se mueve ahora como un oscilador y se superpone con la desviación del precio para señalar posibles agotamientos y posibles reversiones.
Ventajas de usar UR Highs&Lows:
Sin parámetros Tiene 3 líneas que describen el movimiento del precio: la línea blanca, que es un promedio del precio, y las líneas azules, que s
Binaripex es un indicador de opciones binarias. El indicador muestra con una flecha en el gráfico en qué dirección irá el precio en un futuro próximo. Según nuestras estadísticas, en el 95 % de los casos, el precio en un futuro cercano (de 1 a 5 minutos en pequeños marcos de tiempo) irá por encima o por debajo de la indicación de la flecha. Esto le permite usar este indicador con alta eficiencia para operar con opciones binarias. Además, el indicador en el gráfico indica cerca de cada transacci
This program will make analysing multiple timeframes more convenient.
It will help to sync all charts in a different Timeframe sync charts to show same symbol, same specific time period and sync drawing objects Show on all charts at the same time
How to use it >> https://youtu.be/NEHUW7v1h1c In this edition there are only 6 object types that can be synced all chart. Drawing Object Type Support : Vertical/Horizontal Line, Trendline, Rectangle, Arrow, Fibo-Retracement
Additional Featu
FREE
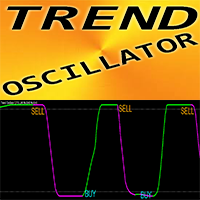
Trend Oscillator: es un indicador personalizado avanzado y una herramienta comercial eficiente.
Se utiliza un nuevo método de cálculo avanzado: 20 opciones para el parámetro "Precio para el cálculo" El oscilador más suave jamás desarrollado Color verde para tendencias al alza, color rojo para tendencias a la baja Valores de sobreventa: por debajo de 5; Valores de sobrecompra: más de 95 Hay muchas oportunidades para mejorar incluso las estrategias estándar con este indicador.
// Más asesores

The indicator refers to the means of probabilistic analysis. Prediction is performed by the Monte Carlo method together with a mathematical model of a neuron. But, the modeling of samples for this method is made not artificially, but comes from the original "nature", that is, from history. The number of samples and the detail of their modeling is achieved using the lower (relative current) timeframe.
Indicator algorithm :
In general terms, the algorithm boils down to the fact that the ind
!! FLASH SALE !! Over 80% off !! For ONE week only. Now only $47 - normally $297! >>> Ends on 30 June 2023 - Don't miss it!
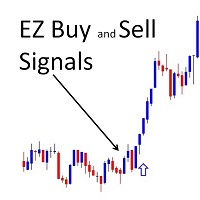
Buy and Sell Signals Directly Onto Your Charts. It couldn't be EZ-er! Aslo Gives Alerts – On Your MT4 To Your Phone To Your Email.
Does not repaint! This couldn't be EZ-er to use - just drag it onto your chart (any timeframe, any pair) set the time of day you want signals and where you want alerts, and wait for the signals. Spreads from 0.1pip RAW/ECN Acc

It could help to calculate Risk-Reward easily before placing a BUY-SELL position. TradeSizeCalculator is a Multi-Tasking Calculator. It will calculate the others when we define the value in one of the columns. Stoploss, risk percentage, risk-money, lot size, take-profit , reward-money, and reward-ratio. Depending on which value is changed. All values in the columns are editable. Also, we can get those calculation results by drag-drop the stop-loss/take-profit line. Parameter: The inputs below ar
Reminder: After purchasing the unlimited version of this indicator send me the proof and I will add you to my private group so that you join the community and continue to learn more about this tool and grow together with other traders. You will also learn the strategy that will change your trading story! Dear Traders I am so glad to introduce my forex trading product called "Day Traders Master Board". This tool is designed for serious traders of any trading strategy. My goal is to help trader b
For Nasdaq trading, the most important principle is to know the trend of the fund.
This indicator with 6 green and red lights provides you with the daily path of this important indicator.
This indicator has been tested for 6 months and has a win rate of over 85%.
Be sure to contact me before purchasing to get the necessary instructions on how to use and set up this indicator.
You should use a broker that has dollar index, vix, and commodities. MT5 Version
You can contact us via Instagram,

Golden section price action indicator - is a trend-scalping complete system with enter and exit points. Indicator is based on most powerfull price action japan patterns that are filtered by volume, volatility, market phase. Pattern is not a simple combinations of candles. Patterns must have "weight" to move market in right direction. "Weight" - is the summary of pattern's volume, the size of pattern candles according to last average volatility and ofcourse pattern must appear in correct market p
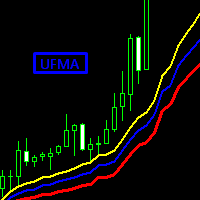
NUEVA CARACTERISTICA !
Ahora puedes seleccionar la opción de dos MA para ver el increíble cruce de MA de Dos UFMA.
Con la rápida reacción de este UFMA puedes evitar la mayoría de las falsas señales de un Cruce de MA normal.
Nueva fórmula para calcular la media móvil, se adapta rápidamente al precio pero mantiene el análisis para determinar si es necesario un cambio de tendencia.
Parámetros de entrada:
Period : se utiliza para seleccionar el número de barras que se utilizarán para los

Identification of support and resistance areas
A useful indicator for traders
completely free
Can be used in all symbols
Can be used in all time frames
It has three different trends: short term, medium term, long term
Settings:
Clr1,2: You can change the color of the lines
Type Trend: You can determine the trend
Message me for questions, criticism and suggestions
FREE

Hypothetical trend line display
Distance from the trend line
Can be used in all symbols
Can be used in all time frames
An interesting indicator for predicting small waves
The greater the distance from the trend line, the more likely it is to return to the trend line
Settings:
The first three(osic 1,2,3):
are the same as the settings of the zigzag indicator
The bigger these numbers are, the bigger the trend lines and the longer the trend
Back Show:
The number of candles displayed
FREE

CFF Day Trader Machine
CFF Day Trader Machine is the best trading system you will ever find when you want to go right every time with the market so that you will never have to trade against the market again, It’s providing marvelous trading signals based on such and amazing algorithm.
*** 5 Copies left for next price $613 ***

Th3Eng HistoMaster indicator Free Histogram Indicator to detect the current trend direction. The indicator is based on CCI indicator. Also draw arrows when it detect the trend is strong buy or strong sell, with Alerting system (Popup with sound, Email alerting and mobile notification). Also draws a dashboard shows all Time-Frames' current signal.
Requirements
works with all pairs, stocks, CFDs and crypto currencies. works with all Spreads works with all Account types works on all Time-Frames
FREE

Magic Lines MT4 is an indicator which can be categorized as trend, levels and channels type. It draws a colored line which is colored in green and red depending where last close is. The value at the current open bar should not be taken into account. This part of the indicator can give us a sense whether it is trending up or down or its going sideways. Magic Lines indicator also draws blue top and bottom levels which can be taken into account for breakouts and false breakouts. A sideway zone shou

CFF New Plan
CFF New Plan is the best trading indicator especially for scalping traders , It’s providing marvelous trading signals based on such and amazing algorithm.
--6 copies has been sold with price $60--
*** 6 Copies left for next price $613***
CFF Follow Me
*** 10 Copies left for next price $613***
* Entry signals without repainting or delays * Error-free opening of trades * Provides signals for any direction sell & Buy * Provides multiple timeframes on a single chart * Colored Histogram based on the market direction * Arrows entry signals
How does the CFF Follow Me Works?
Our CFF Follow Me trading system based on a very accurate "Trend-Following" Trading Strategy. Here's how to Start using ou
AI Signal is an indicator that is a ready to made scalping system that doesn't repaint
Instructions: Load indicator. Use arrows as entries in trends and stay out of sideways markets. Trade with the larger trend and trade only active volatile hours Buy blue arrow above yellow and exit at red arrow or at discretion. Sell red arrow below yellow and exit at blue arrow or at discretion.
Easy to follow and is based on trends. The indicator works on all time frames and assets. Use at your own

Indicator help you recognize trend quickly ( recommended to use TF M30-Daily ) Parameters: Alert when have signal Push Notification to MT4 mobil2 Benefits Easy to use. input parameters is simple The ability to use as filter for any strategy. It work on stock, index, oil, gold, and on all time frames. It has the function of push-notifications, and sound alerts. Importance : Non Repainting Indicator

Diagnosis of major and minor pivot
Trend detection
with many signals
Can be used in all symbols
Can be used in all time frames
Settings:
Back Show: The number of candles it displays
If you need any adjustments, or have any questions or suggestions, message me
How to trade:
Blue: sell signal
Red: buy signal
Blue and red at the same time: no signal
Exit signal: Opposite signal

Forecasting the future by combining trend and average price
with many signals
Can be used in all symbols
Can be used in all time frames
Settings:
BackShow: The number of candles displayed
Osi: Main setting, the larger the number, the longer the trend
If you need more settings, or have any questions or suggestions, message me
How to trade:
Blue: sell signal
Red: buy signal
Blue and red at the same time: no signal
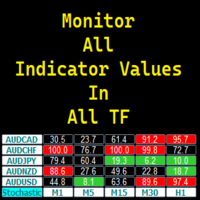
ALL in ONE Indicator Display Indicator values in all Timeframes Display Multiple Symbols/Pairs Fully customizable Click any value/box to open the chart of the corresponding symbol and timeframe Attach multiple instance of the program to display other indicator values Flexible Dashboard Positioning in chart You may request more indicators or additional feature for future updates!

NOTE: NEXT PRICE WILL BE 550$ Dear Trader I hope you have been eagerly waiting and looking for a tool to improve your trading. I am so glad to introduce my other product to you called Trend Shooter Index. The main goal of this tool is to help traders shoot the trend (target the trend) from the bottom or from the top of the trend for maximum profitability. How is the Indicator designed
This tool is designed to show the following Red arrows pointing down for sell signals. Blue arrows pointing up

Forex trading support timer: - This is an indicator that supports a trader's trading process. - Before placing a BUY or SELL order, it is advisable to observe what the current time is like, to get the best position when trading. Function of indicator: - Display information about candle closing time of different timeframes (M1,M5,M15,H1), best used when Scalping. - Show market spreads. - Show TimeZone Trading. - Displays the remaining time of a session.
FREE

Tendencia URAgotamiento
UR TrendExhaustion es la mejor solución para los comerciantes que no quieren lidiar con valores de parámetros ni otras configuraciones: es fácil y visualmente comprensible para todos.
Ventajas de usar UR TrendExhaustion:
Sin parámetros Tiene 3 líneas que describen mejor lo que está pasando en el gráfico: Línea de agotamiento de tendencia, Línea de dinero de ballena y Línea de dinero minorista. La interfaz muestra el agotamiento de cualquiera de las líneas en ambo

Dyj camaleón se basa en el sistema de seguimiento de tendencias y anti - tendencias. Dyj camaleón es un indicador de alta probabilidad. El índice utiliza un índice mixto único que combina un índice complejo con el juicio de los usuarios. Este índice es un algoritmo de cruce y varianza ma más avanzado. El indicador muestra flechas direccionales monocromas y bolas de tendencia, indicando las mejores posiciones de entrada y salida del comerciante. Entrada INP period = 50 - Period Precio de entrada

Observador de divergencia UR
UR DivergenceSpotter es el resultado de muchos años de experiencia y, a veces, las formas más fáciles son las mejores. Hay una buena correlación entre algunos indicadores, pero cuando no coinciden, el precio intenta "reajustarse", y es en ese momento cuando recibimos una señal con UR DivergenceSpotter.
Ventajas de usar UR Divergence Spotter:
Sin parámetros No se vuelve a pintar después de crear la vela. Señales cuando la señal ya no es válida (lo que signifi

Tendencia de volumen UR
UR VolumeTrend es el indicador de volumen más claro que muestra la tendencia actual en términos de volumen. Funciona perfectamente con otros indicadores, como UR TrendExhaustion, para señalar máximos y mínimos locales.
Limitado a solo 2 parámetros: cuanto más altos sean los valores, más largas serán las tendencias que mostrará. Los extremos de gradiente muestran posibles agotamientos de volumen para captar una posible reversión. Dos líneas: la tendencia del volumen
"Estrategia de negociación de reventa": el indicador se creó para operar utilizando el sistema de reventa. La "estrategia comercial de reventa" se muestra en el gráfico con una flecha donde irá el precio ahora. Después de que el indicador dibuje una flecha, el precio irá en la dirección de la flecha en al menos 20 puntos. Esto es suficiente para que podamos comerciar de manera efectiva. La "estrategia comercial de reventa" no vuelve a dibujar sus señales. El indicador tiene muchos modos diferen
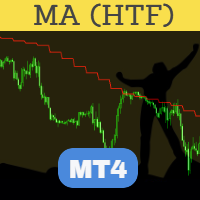
Perfected MA (Moving Average) HTF (Higher Time Frame) es quizás el indicador HTF más avanzado y confiable. Altamente optimizado en términos de ejecución, el indicador viene con la configuración estándar del indicador MA que se suministra con la plataforma MT4. Coloque el indicador en el gráfico, en cualquier período de tiempo. Puede seleccionar un marco de tiempo más alto en las entradas del indicador. El mismo indicador se puede usar en un gráfico varias veces para dibujar MA de múltiples marco
FREE

indicators to facilitate analysis based on Oma Ally's BBMA strategy by displaying CSAK (CSD), CSM and Extreme labels on the chart 1. Displays the Bollinger Band line 2. LWMA 5-10 High and Low 3. EMA 50 4. Fibonacci 5. MHV . area 6. Alert & Show labels BBMA consists of the use of 2 indicators: Moving Averages Bollinger Bands BBMA consists of 3 types of entries: Extreme MHV Re-Entry Moving Average Settings: There are 5 MAs used in the system: 2 High Moving Averages, 2 Low Moving Averages and
FREE

Price pivot points H1 - an indicator that shows price pivot points on the H1 timeframe with an accuracy of up to 95%. 95 signals from 100 will accurately indicate the place of the price reversal in the opposite direction. The indicator does not redraw its values. Suitable for trading on any currency pair. It can be used for both intraday scalping and long-term trading. Price pivot points H1 shows signals as arrows. When the price reverses, the indicator will draw an arrow on the chart. If the p
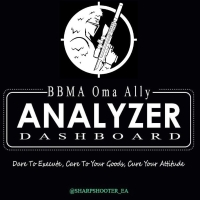
This is a Multi pair and Multi time frame dashboard. The founder of the system is Mr. Oma Ally, which is a system based from Bollinger Band and Moving Average(BBMA). BBMA consists of the use of 2 indicators: Moving Averages Bollinger Bands BBMA consists of 3 types of entries: Extreme MHV Re-Entry Rejection EMA50 This Dashboard Help you to scan current Extreme, Reentry setup, Rejection EMA50 and also MHV How to read signals:
find the same color in 3 different timeframes in succession
For exam
FREE

Professional Support&Resistance Indicator. This indicator is primarily intended for professional use by brokers. There are countless options to choose from and it is one of the best tools in the stock market today. The indicator is optimized for use with EAs.
For programmers to retrieve output index value is for MQL4; (EXAMPLE)
bool buySNR=false,sellSNR=false;
char count=100;
char limit=1;
char dist=3;
for(short cnt=0;cnt<=count;cnt++)
{
double snr_middle=iCustom(NULL,TF_,"::Indica
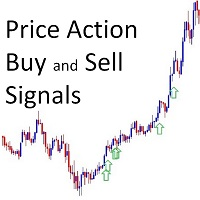
!! FLASH SALE !! Over 80% off !! For ONE week only. Now only $47 - normally $297! >>> Ends on 30 June 2023 - Don't miss it!
Buy and Sell Arrows On The Chart According To Price Action Sends Alerts On MT4 To Your Phone To You Email
Does NOT repaint. Works on any pair, any timeframe.
10 Activations allowed so you are free from limitations. MT5 Version here . For spreads from a tiny 0.1pip RAW/ECN Accounts, click here . Check out my Waka Esque EA signal here: >> High Risk

Fractal Structures Breakout Trader !!SPECIAL PRICE FOR THE FIRST 10 COPIES!!
A next generation powerfull indicator which brings a new approach to fractal theory Indicator tries to scan and find the fractal breakouts. Momentum, price action and harmonic calculations are also used to complete the algo. Advantages: No Repaint Works on all chart timeframes. Works for every instrument including Currency Pairs, Gold, Oil, Commodities, Indices, Stocks and Cryptocurrencies. Easy to use. User and CPU f

This indicator provides common shapes as drawing object options. The shapes are rotatable, resizable, draggable, and will keep their proportions (according to their handle trendline) across different chart scales. Multiple drawings are supported.
Shapes: Square Rhombus
Triangle (quadrilateral & isosceles) Circle (grid, overlapped grid, flexi grid, rotatable grid, concentric circles) Features: rays (all object edges will be rays) show/hide each individual drawing type, or all delete last drawn
FREE

Robin Scalper indicator is calculated based on advanced algorithm of several indicators.
The algorithm provides highly reliable entry points, and its simple settings allow using it for all symbols, time frames and trading styles.
Signals are generated at the closing of a bar and are not repaint .
Setting Parameters : Indicator Name - Indicator Name. Trend Period - Trend Period of the indicator. Filter - Signal smoothness. EMA fast Filter - Fast EMA filter. EMA slow Filter - Slow EMA
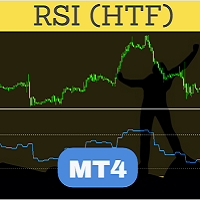
Perfected RSI (Relative Strength Index) HTF (Higher Time Frame) is perhaps the most advanced and reliable HTF indicator. Highly optimized in terms of execution, the indicator comes with standard settings of the RSI indicator which is supplied with the MT4 platform. Place the indicator on the chart, any timeframe. You may select a higher time frame in indicator inputs. The same indicator can be used on a chart multiple times to draw RSI from multiple timeframes or for different RSI period values
FREE

The Spots Indicator can be used for Entering and Exiting your trades based on the common candlestick patterns such as: engulfing, hanging man, doji etc. It is designed to publish desktop and mobile notification every time a signal is triggered. However, it is worth noting that this indicator is recommended to be used with other indicator for confirming the entries. It is best to use it with the Investment Castle Trend Lines indicator and the Supply and Demand indicator
MetaTrader Market - robots comerciales e indicadores técnicos para los trádres, disponibles directamente en el terminal.
El sistema de pago MQL5.community ha sido desarrollado para los Servicios de la plataforma MetaTrader y está disponible automáticamente para todos los usuarios registrados en el sitio web MQL5.com. Puede depositar y retirar el dinero a través de WebMoney, PayPal y tarjetas bancarias.
Está perdiendo oportunidades comerciales:
- Aplicaciones de trading gratuitas
- 8 000+ señales para copiar
- Noticias económicas para analizar los mercados financieros
Registro
Entrada
Si no tiene cuenta de usuario, regístrese
Para iniciar sesión y usar el sitio web MQL5.com es necesario permitir el uso de Сookies.
Por favor, active este ajuste en su navegador, de lo contrario, no podrá iniciar sesión.