Nuevos indicadores técnicos para MetaTrader 4 - 28

"Price reversal arrows" Forex indicator, which shows price reversal points on an hourly chart (PERIOD_H1) with arrows, is one of the most popular tools for traders in the Forex market. This indicator is used to identify the most likely price reversal points, which can help traders make better trading decisions. The "Price reversal arrows" indicator works on the basis of various mathematical algorithms and formulas that analyze data on previous price movements in the market. At the same time, th
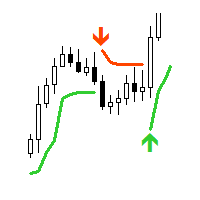
"AV SuperTrend" is an indicator for MetaTrader 4. The supertrend indicator is popular for determining the trend and positioning stops or as trailing support. I use this indicator in several expert advisors for trend analysis.
Supertrend indicator signals can be selected in the form of entry arrows and notifications, as well as various sounds.
Settings :
- Period
- Multiplier
- Alert buy signal: arrow color
- Alert sell signal: arrow color
- Alert yes/no
- Sound: choice or no
-

Binary Options Trading Indicator: A Reliable Tool for Your Trades This indicator is specifically designed for binary options trading and has proven to be a high-quality, reliable, and fairly accurate tool, depending on the chart's dynamics. Key Points: Signal Interpretation: When a blue cross signal appears, it indicates a potential trade entry, although it's considered a weak signal on its own. However, if the blue cross is accompanied by an arrow, it is considered a more reliable signal for b

Short-Term Trading Indicator: The Foundation of Your Successful Strategy This tool is designed for scalping or pip trading in financial markets. It can serve as an excellent starting point for creating your own trading strategy. Key Features: Non-repainting signals: The indicator provides reliable signals that do not change after their appearance. A signal appears on the next candle after the event that triggered it. Excellent signals in high volatility conditions: With good volatility on the ch
The indicator for binary options without repainting is a powerful tool for traders. It ensures signal reliability without altering them after their appearance. Features: Non-repainting signals: The indicator provides stable and reliable signals that do not change after formation. Expiration time: Signals appear at the candlestick opening and expire within one candlestick of the current timeframe. Overlay method: In the event of a losing trade, it is recommended to use the overlay method with an

This outside bar indicator is the opposite of the inside bar. So what this MT4 outside bar indicator does is identifies outside bars for you as they form on your charts. Outside bar is a famous trading pattern in which the bar carry higher high and lower low compared with the previous bar, also known as mother bar. To trade based on Outside Bars, simply place buy stop order above the high price level of a bullish Outside Bar, and sell stop order should be placed below the low price level of a be
FREE

Real Pro Signal indicator is designed for signal trading. This indicator generates trend signals.
It uses many algorithms and indicators to generate this signal. It tries to generate a signal from the points with the highest trend potential.
This indicator is a complete trading product. This indicator does not need any additional indicators.
The indicator certainly does not repaint. The point at which the signal is given does not change.
Features and Suggestions Time Frame: H1 W

Perfect Cross Arrows indicator is designed for signal trading. This indicator generates trend signals.
It uses many algorithms and indicators to generate this signal. It tries to generate a signal from the points with the highest trend potential.
This indicator is a complete trading product. This indicator does not need any additional indicators.
The indicator certainly does not repaint. The point at which the signal is given does not change. Signals are sent at the beginning of new can

Great Strong System indicator is designed for signal trading. This indicator generates trend signals.
It uses many algorithms and indicators to generate this signal. It tries to generate a signal from the points with the highest trend potential.
This indicator is a complete trading product. This indicator does not need any additional indicators.
The indicator certainly does not repaint. The point at which the signal is given does not change.
Features and Suggestions Time Frame:

The product Divergence Macd Obv Rvi Ao Rsi is designed to find the differences between indicators and price. It allows you to open orders or set trends using these differences. The indicator has 4 different divergence features. To View Our Other Products Go to the link: Other Products
Divergence types Class A Divergence Class B Divergence Class C Divergence Hidden Divergence
Product Features and Rec ommendations There are 5 indicators on the indicator Indicators = Macd Obv Rvi Ao Rsi 4 dif

Simple supply and demand indicator which should help identify and visualize S&D zones. Settings:
Color for supply zones, color for demand zones - default colors are set for dark (black) background.
Number of how much zones should be created above and below current price - value "3" means there will be 3 zones above current price and 3 zones below current price. Principle:
When price creates "V", reversal zone is registered. Rectangle filled based on zone type (supply / demand) is drawn if pri
What is the RVOL Indicator?
It is well established that volume (including tick volume) is a valuable indicator of trader commitment to a price movement. The challenge with using volume for intraday trading is that there is a general cycle of increasing and decreasing volume associated with the different regional trading sessions. The Relative Volume, or RVOL, indicator helps to overcome this by comparing the current volume with the average volume for that time of day, calculated over a period

Use my recommended broker: https://icmarkets.com/?camp=61478 You have most likely heard about the term "Less is more". I can tell you one thing that's also the case with the Monkey RSI on Bollinger indicator! One indicator will give you the best of both worlds, easy to determine trend, the strength of the trend and overbought and oversold levels. This indicator is very simple to follow: Green line uptrend Red line downtrend Above band overbought Below band oversold With this indicator you cou
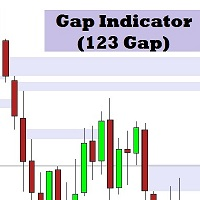
This indicator identifies the gap between the first and third candles in 3 consecutive candles. This area can be used to identify strong areas that the price may return to after a reversal or pullback.
The indicator has 4 user defined settings: 1. Display Distance: This is how many previous candles the indicator will use to identify gaps.
2. BearBarColor: This is the color that will be used for gaps created during a downtrend.
3. BullBarColor: This is the color that will be used for gaps cre

This Indicator will notified you when time to entry into the market, build with double william percent range strategy. --> Buy Notification will flag with the blue arrow --> Sell Notification will flag with the red arrow After Flag Appear, the market usually explode but carefully you must performs double check because weakness of this indicator when in the end of the trend

This Indicator will notified you when market going to trend reversal, build with candlestick pattern strategy
--> Sell Reversal Notification will flag with the Yellow arrow
--> Buy Reversal Notification will flag with the Pink arrow
After Flag Appear, the market usually reverse but carefully you must performs double check because weakness of this indicator when market in the middle of the trend
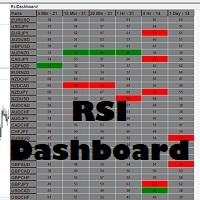
Never miss when a pair is being oversold or overbought again!! This RSI dashboard allows you to monitor RSI levels on 6 different time frames for up to 30 different currency pairs. This dashboard is packed with features including: 1. Monitoring of 6 customizable time frames (M1, M5, M15, M30, H1, H4, D1, W1, M1) 2. You can set the overbought/oversold levels you want for EACH time frame and they will be highlighted in the dashboard when a pair gets to that level
3. You can also set the RSI perio

This Indicator is use the ZigZag to calculate the Upper and Lower Bound and the uptrend and the downtrned. Red for downtrend, Green for uptrend and Yellow is for the horizontal trend this horizontal trend also bookmarked the upper limited and the lower limited the the price swings. Or in simple the Support and the Resistance level. However, You may use the Heikin Ashi to confirm the trend of the buy sell signal above. I cannot guarantee the win rate, Nevertheless, you must study well the timef
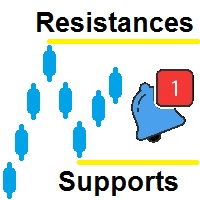
Soportes y resistencias, se creó para ayudarlo a identificar los máximos y mínimos automáticamente en varios marcos de tiempo diferentes y, por lo tanto, representar estos máximos y mínimos en el gráfico actual. Vamos a la explicación de la creación de resistencias Hay un campo de regla, en el que puede definir qué es superior e inferior. La regla superior se establece de forma predeterminada de esta manera:
Dónde:
Elemento Descripción H significa alto
[0] significa vela actual [1]
FREE

Version MT5 | FAQ | EA Universal Breakout Universal Box traza intervalos de precios en el gráfico que pueden utilizarse posteriormente para operar en la ruptura de un intervalo de precios. Hay muchas estrategias que pueden aplicarse a este indicador. El indicador está configurado por defecto para marcar en el gráfico los intervalos de la sesión de negociación Asiática, Europea y Americana . Los intervalos se trazan como rectángulos, cuyos límites son las horas de inicio y fin de la sesi
FREE

Bienvenido a nuestro patrón de ondas de precios MT4 --(Patrón ABCD)-- El patrón ABCD es un patrón comercial poderoso y ampliamente utilizado en el mundo del análisis técnico.
Es un patrón de precio armónico que los comerciantes utilizan para identificar oportunidades potenciales de compra y venta en el mercado.
Con el patrón ABCD, los operadores pueden anticipar posibles movimientos de precios y tomar decisiones informadas sobre cuándo ingresar y salir de las operaciones. Versión EA:
FREE

WARNING: PRICE IS SUBJECT TO RISE AT ANY TIME. GET YOUR COPY TODAY TO AVOID MORE COST! Dear Traders I am so glad to introduce to you my other tool called the Forex Sniper Entries Indicator. This tool is designed to help serious traders and investors capture big moves in the currency price movements. The philosophy behind this tool is all about winning big and riding the price movement from its beginning until the maximum point. We want to capture those big moves in both down and up markets as mu

Versión MT5 | Indicador Valable ZigZag | FAQ La Teoría de las Ondas de Elliott es una interpretación de los procesos en los mercados financieros, que se basa en el modelo visual de las ondas en los gráficos de precios. Según esta teoría, podemos saber exactamente qué tendencia prevalece ahora en el mercado, ascendente o descendente. El indicador Valable ZigZag muestra la estructura de ondas del mercado , así como indica la dirección de la tendencia principal en este momento en el timeframe
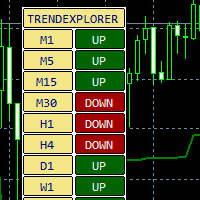
An indicator of the trend direction of a trading instrument on different timeframes. The author's method of calculating the trend is used.
You can enable and disable different timeframes.
Suitable for working with currency pairs, stocks, futures, cryptocurrencies.
Settings:
ATR Multiplier - ATR multiplier; ATR Period - ATR indicator period; ATR Max Bars (Max 10.000) - Number of bars to calculate; Candle shift to Calculate - Report start bar; On/Off Timeframe M1 - Enable different timefra

The technical indicator "Reversal patterns" is a mathematical interpretation of the classic reversal patterns: Pin Bar, Harami and Engulfing. That is, the "reversal bar", "Harami" and "Absorption". This indicator allows you to determine the moment of reversal of quotes based on market dynamics and the winner between the "bulls" and "bears".
The indicator displays the moment of reversal at the local highs and lows of the chart of any timeframe, which allows you to increase the accuracy of the

O indicador criado por Didi Aguiar, o mestre das Agulhadas!
O padrão do indicador é o cruzamento de três médias móveis simples. Média rápida, período 3. Média normalizada, período 8. Média lenta, período 20.
Quando as três médias se cruzam próximas o suficiente, acontece a agulhada! Pela posição das médias é possível identificar: Agulhada de compra, agulhada de venda, ponto falso e beijo da mulher aranha.
Quer saber mais? Procure pelo site dos robôs oficiais da Dojistar: tradesystembots.co
FREE

O indicador TRIX, conforme o utilizado pelo grafista Didi Aguiar.
Este indicador é composto pela Triple Exponencial Average (TRIX), que neste setup é utilizada com o período 9, e um sinal de média simples do próprio indicador que é utilizado com o período 4.
Parâmetros: Período: 9 Sinal: 4
Os demais indicadores do sistema operacional de Didi Aguiar são:
Bollinger: período 8, desvio 2 ADX: período 8 DidiIndex com médias simples, períodos: 3, 8 e 20 Estocástico: 8, 3 3
FREE

The Multi Channel Trend indicator was developed to help you determine the trend direction by drawing channels on the graphical screen. It draws all channels that can be trending autonomously. It helps you determine the direction of your trend. This indicator makes it easy for you to implement your strategies. The indicator has Down trend lines and Up trend lines. You can determine the price direction according to the multiplicity of the trend lines. For example , if the Down trend lines start to

Panelux - информационная панель показывающая актуальную информацию для трейдера, такую как: Номер торгового аккаунта и торговое плечо; Символ, период, последнюю цену, время до закрытия бара и спред; Отдельный блок для мани менеджмента; Данные свопа инструмента; Блок информации о депозите, балансе, профите, позициях, equity и margin; Блок о прибылях и убытках за год, квартал, месяц, неделю и по последним пяти дням. Имеется опция для включения отображения совершенных сделок на графике цены. Что уд
FREE

If you are boring in repeatedly changing of trading symbol in every charts when use multiple charts to analyzing prices or trading. This indicator can help you. It will change the symbol of any other charts in the terminal to the same as in the chart you have attached this indicator to it whenever you add new symbol to the chart or click on the button. After finished the job it will sleep quietly waiting for new occasion in order to minimize resource usage of the computor.
FREE
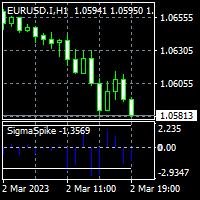
To get access to MT5 version please click here . - This is the exact conversion from TradingView: "SigmaSpikes(R) per Adam H. Grimes" by "irdoj75" - This is a light-load processing and non-repaint indicator. - All input options are available. - Buffers are available for processing in EAs. - You can message in private chat for further changes you need. Thanks for downloading
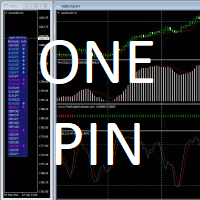
Transform indicators into trading signals JagzFX OnePin Basic allows a wide range of MT4 Custom Indicators to be transformed into multi-symbol trading signals without the need to write any code. You can use OnePin to create 'At A Glance' dashboards showing your preferred technical indicators and even send buy/sell signals to a PIN compatible dashboard just as JagzFX pinTrader. Whilst I have tried to limit the amount of technical jargon needed to use this PIN, there are a few terms that might nee
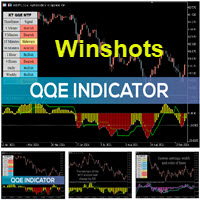
The Qualitative Quantitative Estimation (QQE) indicator is a technical analysis tool developed for the MetaTrader 4 (MT4) trading platform. It is designed to help traders identify potential trend reversals and to determine the strength of a current trend. The QQE indicator is calculated based on the Relative Strength Index (RSI) and Moving Average (MA) indicators. The RSI is used to determine the momentum of price movements, while the MA is used to smooth out the price data and identify trends.
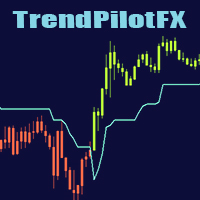
This Mql4 indicator smooths the trend by changing candle colors without altering their size, allowing for better price action reading. It also includes a trend line for trade entry and exit points. Smooth out market trends and improve your price action reading with this powerful Mql4 indicator. Unlike Heikin Ashi, this indicator changes candle colors without altering their size, providing you with a clearer picture of market movements. In addition, it includes a trend line that traders can rely
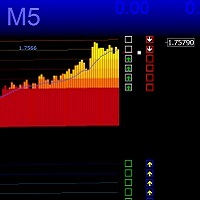
Канал TMA формирует расчёт зеркальным методом, что позволяет плавно компенсировать пробойные удары и точнее определять разворот, канал имеет дополнительную защиту от сужения, канал имеет ускоритель направляющей с заданными настройками, сигналы появляются на возврате направляющей линии, Версия MTF 2023 позволяет индивидуально настраивать канал на другие временные рамки и разные инструменты, возможны доработки, рекомендуется Gold M1 M5

MetaForecast predice y visualiza el futuro de cualquier mercado basándose en las armonías de los datos de precios. Aunque el mercado no siempre es predecible, si existe un patrón en el precio, MetaForecast puede predecir el futuro con la mayor precisión posible. En comparación con otros productos similares, MetaForecast puede generar resultados más precisos al analizar las tendencias del mercado.
Parámetros de entrada Past size (Tamaño del pasado) Especifica el número de barras que MetaForecas

INDICADOR DE REGRESIÓN LINEAL ==> El indicador representa la línea de regresión lineal y las líneas de soporte y resistencia, obtenidas en base a la desviación estándar con respecto a la Regresión Lineal. Personalización: se pueden ajustar los siguientes valores: Rango Tendencia: El número de barras o períodos, dentro del marco temporal considerado, tomado como referencia para el indicador. AmpDesv: La amplitud o número de veces para considerar la desviación estándar de la regresión lineal para

Clock GMT Live tiene todo lo que necesitas saber más sobre nuestro broker, muchas veces te habrás preguntado en que gmt estoy o en que gmt esta trabajando mi broker, pues con esta herramienta podrás saber en tiempo real tanto el GMT compensación horaria del corredor y de su hora local, también sabrá constantemente el ping del corredor Con solo colocarlo en un momento del día se puede obtener la información
El precio aumenta por cada adquisición, con esto protegeremos para que pocos puedan ten
FREE
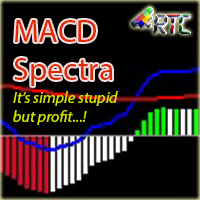
¡MACD Spectra , un indicador de trading simple pero rentable! Este indicador se puede usar en todos los marcos de tiempo y todos los pares de divisas. Con una precisión superior al 90%, este indicador es perfecto tanto para traders novatos como profesionales que buscan el mejor indicador para ayudar en sus actividades de trading. Simplemente siguiendo el color del histograma, la posición del histograma y la posición de las líneas de señal y MACD, se puede entrar y salir del mercado fácilmente. N

Extreme Price Meter En base a la información histórica del mercado, el indicador calcula cual será el próximo precio extremo con una alta probabilidad para una reversión. Genera 2 bandas de precios donde existe una alta probabilidad de compra o de venta. Es fácil observar la alta exactitud del indicador considerando las flechas que coloca cuando una vela cierra afuera de las bandas de probabilidad.
Notificaciones para escritorio, teléfono y email.
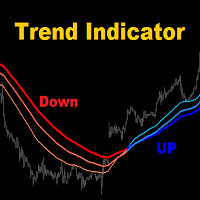
MA3 Trend - is the good trend indicator on three MAs. Benefits of the indicator: The indicator produces signals with high accuracy.
The confirmed signal of the indicator does not disappear and is not redrawn.
You can trade on the MetaTrader 4 trading platform of any broker.
You can trade any assets (currencies, metals, cryptocurrencies, stocks, indices etc.).
You can trade on any timeframes (M5-M15 scalping and day trading / M30-H1 medium-term trading / H4-D1 long-term trading). Indiv
FREE

El indicador de flecha de Forex es una herramienta indispensable para una reventa exitosa en el mercado de divisas. Con él, los comerciantes pueden determinar fácilmente cuándo vale la pena abrir una posición de compra o venta y, por lo tanto, obtener ganancias sin perder tiempo analizando gráficos. Las flechas rojas y azules del indicador, una especie de semáforo, son herramientas visuales que facilitan determinar la dirección de la tendencia. La flecha roja indica la posibilidad de abrir una

** All Symbols x All Timeframes scan just by pressing scanner button ** *** Contact me after the purchase to send you instructions and add you in "Head & Shoulders Scanner group" for sharing or seeing experiences with other users. Introduction: Head and Shoulders Pattern is a very repetitive common type of price reversal patterns. The pattern appears on all time frames and can be used by all types of traders and investors. The Head and Shoulders Scanner indicator Scans All charts

MT5 Version Order Blocks ICT Kill Zones SMT Divergences ICT Breakers
The ICT Breakers indicator is a powerful tool for traders looking to gain an edge in the market. This indicator is based on the order flow and volume analysis, which allows traders to see the buying and selling pressure behind the price action. This information can be extremely valuable in identifying key levels of support and resistance, as well as potential turning points in the market. Breaker blocks are areas where i

Indicator customers will get Ea based on Fiter indicator for free as a Bonus. (watch video to see Ea in action) Fiter is EMA+ATR*RSI hibrid yellow line combined with Moving average red line, cross of which gives much smoother results than two simple Ma cross usage in trading. Effectiveness is proven by backtest and comparison with two simple Ma crosses. History shows that this method Fits with different market conditions and it can be boldly used in real manual trading for determining big trend

The most Flexible & Reliable Trend-Based Fibonacci indicator by Safe Trading. This indicator helps you calculate Trend-Based Fibonacci levels base on the main and retracement trends to predict future price . If you just looking for a simple Fibonacci Retracement indicator, please use this Free indicator .
### FEATURES ### Auto-calculate up to 7 Trend-Based Fibonacci levels on adjustable frame. Adjust Fibonacci levels as your need. Adjust the start and the end of calculated frame in indicato
FREE

Order Blocks are supply or demand zones in which big traders can find the comfort of placing large buy and sell orders and completing a big, very big transaction. Order blocks are a unique trading strategy that helps traders find a direction in the market. Usually, it allows traders to find out what financial institutions are planning to do in a particular market and better indicate the next price movement.

This indicator demonstrates that the price change of financial instruments is NOT a random walk process, as advocated by the "Random Walk Hypothesis", and as popularised by the bestselling book "A Random Walk Down Wall Street". I wish that were the case! It is shown here that the real situation with price change is actually much worse than a random walk process! Deceptive market psychology, and the bulls-bears tug of war, stack up the odds against traders in all instruments, and all time frame
FREE
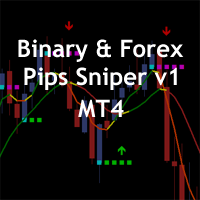
The Binary & Forex Pips Sniper MT4 indicator is based on technical analysis of two moving average and the slope of the slow moving average. The moving average helps to level the price data over a specified period by creating a constantly updated average price. Upward momentum is confirmed with a bullish crossover "Arrow UP", which occurs when a short-term moving average crosses above a longer-term moving average. Conversely, downward momentum is confirmed with a bearish crossover "Arrow Down", w

The indicator is a 15-minute signal indicator for all types of traders. Meaning, you could make lots of profits trading two different signals in one indicator.
NOTE: Both indicators are channels for achieving the same result. RED ARROW -- Sell Signal BLUE ARROW -- Buy Signal
Purchase now to be part of our community. We offer standard chart setups for both novice and intermediate traders. Trade with ease!
FREE
I have developed an indicator based on both the fibo musang strategy and the price breaking of the ichimoku cloud and it has amazing results
the features are:
1- Once activated it give you the trend where you are from the chart
2- After a trend change it gives you an alert on PC or notification on your phone if you are away.
3- It sends you the exact prices to take an order and 3 take profit levels and your stoploss.
4- It works on every timeframes from 1m to MN.
5- It works on pairs

Volatility Limit Trend Indicator (VLT), an original indicator by this developer, is a trend indicator based on setting a fixed volatility limit as a percentage of price. Volatile price is allowed to wander between two channel lines defining the fixed volatility about a central line. The price crossing one of the channel lines defines an exceeding of the allowed volatility, and ushering in one of two situation : either a continuation or a reversal of trend. The first buffer of the indicator (not
FREE
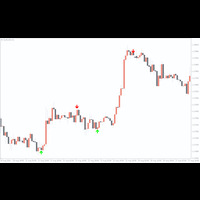
The indicator is a 15-minute signal indicator for all types of traders. Meaning, you could make lots of profits trading two different signals in one indicator.
NOTE: Both indicators are channels for achieving the same result. RED ARROW -- Sell Signal BLUE ARROW -- Buy Signal
Purchase now to be part of our community. We offer standard chart setups for both novice and intermediate traders. Trade with ease!
FREE

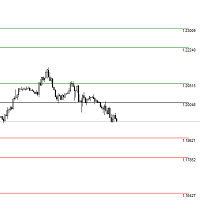
This indicator uses a special algorithm to plot the 4 lines for trading. Great for scalping. Does not feature any alerts and is best used manually after confirming the line displays. No need to set up the indicator. How to use: Attach to any chart. Can be used on any time frame. If used on lower time frames, check higher time frames for confirmation. Buy : - Wait for green and white lines to be above the level 50 dotted line, then open buys. - Buy when the green line crosses below the white line
Check My Product
Contact me to discover all my services
Pivot indicator is a tool used by many traders. It can be used by beginners and experts alike and allows you to identify support and resistance levels. Pivot indicator is a widely used tool because over the years it has shown the validity of the levels it calculates and can be easily integrated into your trading strategy. Pivot levels can be used on different timeframes and based on the chosen time duration, calculate levels using dail
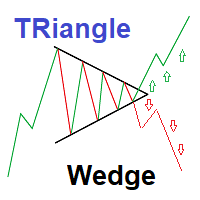
Strategy set to trade Triangle wedge break
This is a simple very effective strategy based on detecting and showing triangle wedges formation Strategy set to trade Triangle wedge break Red Arrows appears on crossing triangle down Green Arrows appears on crossing triangle Up You can also trade lower and upper triangle limit :(new version may be released to allow arrows for side ways trading) ---Sell on price declines from High triangle Level - Buy on increasing from Lower triangle level 2 inpu

Осциллятор Чайкина ( Chaikin Oscillator ) — это индикатор импульса, созданный Марком Чайкиным , и, очевидно, индикатор назван в честь своего создателя. Он измеряет импульс линии распределения и накопления, используя формулу схождения-расхождения скользящих средних (MACD). На основе данных об этом импульсе мы можем получить представление о направленных изменениях в линии распределения и накопления.

This indicator is a supporting tool which helps you draw/update any chart object once. The additions or changes are automatically synchronized to all linked chart windows of the same instrument. Setup is simple. Open all required charts you want to work on, attach the indicator to each chart window and start using it.
Its only allowed to attach one indicator to each chart. Once attached, you can draw on any chart (as long as it has this tool attached as indicator) and the drawing will show up

This indicator was constructed using decision trees. I will only give a few insights into the algorithm since it is original. But there are 4 trees in the inputs and by default they are 10. The decision tree logic for buy signals is as follows: If the MACD line is less than certain bullish divergence (determined by the "BUY_TREE_1" and "BUY_TREE_2" variables) The decision tree logic for sell signals is as follows: If the MACD line is greater than certain bearish divergence (determined by the

This is an arrow formed by strong reversal candlesticks it is used on muti time frame or m15 and above for gold and h1 and above for currency pairs (can be used at m5 after strong volatile news) This indicator is 100% non-repain and non-repoint Have a success probability of bringing in more than 90% profit Your stop loss when entering your order is behind the arrow and will be very low it will only be 20 pips or 30 pips at m15 (note in larger timeframes it may be longer) How To USE When the
Really simple tool that can be attached to any graph to keep an eye on the account status. It run as an indicator but actually is just a simple monitor. There are three sections: -account market status : infos about global open orders profit/loss, margin required, market status, etc. -account info: simple infos but good for setting lots amount, knowing contract size, server id, etc. -time data: in order not to get mad on time shifts, you have some info about local, broker, GMT time, plus winter/
The "Stochastic Multi Period Buy Sell Alert" is a powerful technical indicator designed to analyze price momentum and trend strength across multiple timeframes. This indicator is a valuable tool for traders looking to identify profitable trading opportunities. With the indicator, you can monitor price movements in three different timeframes, namely M15, M30, and H1. The indicator calculates the Stochastic K value for each timeframe and determines whether the price is in an oversold or overbought

It identifies the pivot, support, and resistance price levels of the selected timeframe and then draws lines onto the chart. FEATURES: Option to specify the Timeframe Period in the PivotSR calculation. Option to display the PivotSR of the last candle, of every candle, or of the current candle. Options for displaying labels, line thickness, and line color. PivotSR can be interpreted as reversal levels or past price reactions that can be used as the basis for current price analysis. Some traders b
FREE
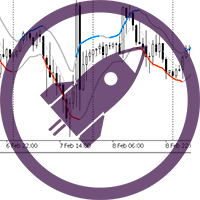
"Scalper Channel MT4" is a modern channel indicator that shows the trader the direction of the trade. For work, the indicator uses built-in and proprietary technical means and a new secret formula. Load it on the chart and the indicator will show you the entry direction in color:
If the upper limit of the price channel of the indicator is blue, open a buy position. If the lower limit of the price channel of the indicator is red, open a sell position. If the border of the indicator is gray, ne

It works based on the Stochastic Indicator algorithm. Very useful for trading with high-low or OverSold/Overbought swing strategies. StochSignal will show a buy arrow if the two lines have crossed in the OverSold area and sell arrows if the two lines have crossed in the Overbought area. You can put the Stochastic Indicator on the chart with the same parameters as this StochSignal Indicator to understand more clearly how it works. This indicator is equipped with the following parameters: Inputs d
FREE
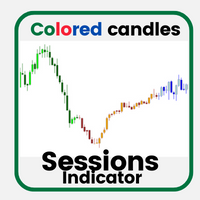
This indicator shows trading sessions using colored candles. It's made for volume profile and supply/demand traders to quickly see when specific candles are formed during different times or trading sessions.
Take a look at the screenshots for a usage example.
Core Features: Different colors for bullish and bearish candles, allowing users to distinguish between bullish/bearish candles.
FREE

Just another Auto Fibonacci Retracement indicator . However, this is the most Flexible & Reliable one you can find for FREE. If you use this indicator and you like it, please leave a review/comment. If you are looking for a more advanced Fibo indicator, check this Free Trend-Based Fibo indicator .
### FEATURES ### Auto-calculate up to 7 Fibonacci levels on your customized frame. Adjust levels as your need. Use High/Low price or Open/Close price to calculate. Freeze the levels and don't re
FREE
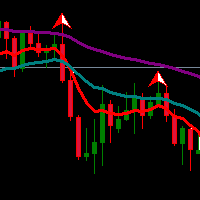
Exponential Moving Average (EMA) is an indicator that often be used by traders. Combination of two or three EMA indicators often applied to determine trend direction. Multiple EMA combined with fractals or oscillator indicator to detect overbought/oversold and divergence point also great to do in trading system.
If you like EMA indicator and want to get better indicator, highly recommended using EMA SuperTrend Strategy Indicator if you want to get better result in here:
https://www.mql5.com/
FREE

In case you get Laguerre S crat indicator, you will get Laguerre Scrat Ea as a Gift. To get Ea and det a iled m anu al PDF contact me PM. Default settings are for usd/cad H4 For St able Long term Profits Laguerre Scrat is a trading system based on 4 indicator combinations in the shape of one indicator. Laguerre indicator (upgraded), CCI, Bollinger bands and market volatility factor. It generates arrows in the indicator window and nuts on the price chart, doubling arrows for a better view where
El Mercado MetaTrader es una plataforma única y sin análogos en la venta de robots e indicadores técnicos para traders.
Las instrucciones de usuario MQL5.community le darán información sobre otras posibilidades que están al alcance de los traders sólo en nuestro caso: como la copia de señales comerciales, el encargo de programas para freelance, cuentas y cálculos automáticos a través del sistema de pago, el alquiler de la potencia de cálculo de la MQL5 Cloud Network.
Está perdiendo oportunidades comerciales:
- Aplicaciones de trading gratuitas
- 8 000+ señales para copiar
- Noticias económicas para analizar los mercados financieros
Registro
Entrada
Si no tiene cuenta de usuario, regístrese
Para iniciar sesión y usar el sitio web MQL5.com es necesario permitir el uso de Сookies.
Por favor, active este ajuste en su navegador, de lo contrario, no podrá iniciar sesión.