Nuevos indicadores técnicos para MetaTrader 4 - 2
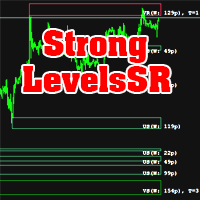
The indicator calculates support and resistance levels. There is a hint in the upper left corner. This hint can be removed. Hint in two languages (English and Russian). The width of support and resistance levels is shown. The number of levels touched is displayed. Works on all timeframes. Can be used as an independent trading system, and as an addition to another system. Download the demo version of the indicator right now and try it in the strategy tester!
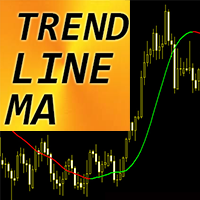
Indicador Forex "Promedio móvil de línea de tendencia" para MT4
Trend Line MA: ¡es la próxima generación de medias móviles! Se utiliza un nuevo método de cálculo avanzado. El indicador muestra tendencias sin demoras. Es mucho más rápido y claro que los indicadores estándar SMA, EMA y LWMA. Hay muchas oportunidades para mejorar incluso las estrategias estándar con este indicador. El color verde significa tendencia alcista. El color rojo es una tendencia bajista.
// Más asesores expertos e in
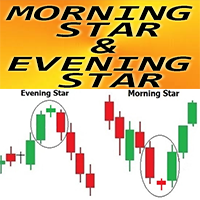
Indicador Forex "Patrón estrella de la mañana y estrella de la tarde" para MT4
El indicador "Patrón Morning Star y Evening Star" es un indicador muy poderoso para el comercio de acción del precio: sin repintado, sin demoras; El indicador detecta patrones de estrella de la mañana y estrella de la tarde en el gráfico: Patrón alcista Morning Star: señal de flecha azul en el gráfico (ver imágenes) Patrón de estrella vespertina bajista: señal de flecha roja en el gráfico (ver imágenes) Se incluyen
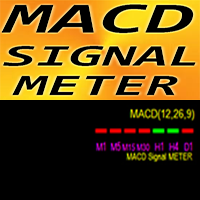
Indicador Forex MACD METER de señal para MT4
El indicador MACD Signal METER muy útil muestra el valor MACD actual (por encima/debajo de la señal) durante 7 períodos de tiempo simultáneamente Cuadro verde: MACD está por encima de la señal Cuadro rojo: MACD está por debajo de la señal El indicador de Forex MACD Signal METER se puede utilizar como filtro de entrada comercial para operaciones con marcos de tiempo múltiples
// Más asesores expertos e indicadores excelentes están disponibles aquí
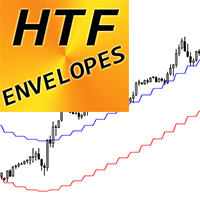
Indicador Forex "Sobres HTF" para MT4
Actualice sus métodos comerciales con los sobres HTF profesionales para MT4. HTF significa - Marco de tiempo más alto Sobres es uno de los mejores indicadores de tendencias del mercado: herramienta perfecta para operar Se utiliza para ayudar a los operadores a identificar condiciones extremas de sobrecompra y sobreventa, así como rangos de negociación. El indicador HTF Sobres es excelente para sistemas de comercio de marcos de tiempo múltiples con entrada
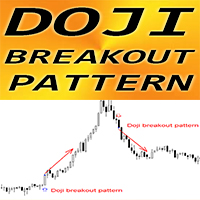
Indicador Forex "Patrón de ruptura Doji" para MT4
El indicador "Patrón de ruptura de Doji" es puro comercio de acción del precio: sin repintado, sin demoras; El indicador detecta una ruptura del patrón Doji en la dirección de la tendencia donde la vela Doji está en el medio del patrón y la última vela es la de ruptura: Patrón de ruptura alcista de Doji: señal de flecha azul en el gráfico (ver imágenes) Patrón de ruptura bajista de Doji: señal de flecha roja en el gráfico (ver imágenes) Se inc

Indicador Forex "Histograma de entrada de tendencia" para MT4
El indicador de histograma de entrada de tendencia se puede utilizar para buscar señales de entrada en la dirección de la tendencia una vez que aparece la barra de entrada. Este indicador tiene una característica única: para los cálculos se necesitan tanto el precio como el volumen. El histograma de entrada de tendencia puede estar en 2 colores: rojo para una tendencia bajista y azul para una tendencia alcista. Una vez que vea una

Contact me after payment to send you the user manual PDF file. Introduction Introducing the Wolfe Pattern Indicator, a powerful tool designed to help traders identify and capitalize on the elusive Wolfe Pattern in financial markets. This innovative indicator uses advanced algorithms to scan for the Wolfe Pattern in all symbols and time frames, providing traders with a unique edge in the market. How to trade with the Wolfe Pattern The Wolf Pattern is a rare and lucrative trading opportunity that
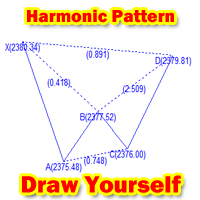
Are you a harmonic trader?
Are you still troubled by having to go to a T website to draw the harmonic index XABCD?
This tool for drawing harmonic indicators on MT4 is just for you!
Instructions: After loading the indicator on MT4, you can set the X postion and Y postion of the indicator. And the color of the line drawn by XABCD (default is blue) After loading the indicator, if postion have not changed, a "Draw" button will appear in the lower right corner by default. After the button
FREE

Le presentamos el indicador "Candle closing counter", que se convertirá en su asistente indispensable en el mundo del trading.
Es por eso que saber cuándo se cerrará la vela puede ayudar:
Si usted tiene gusto de negociar usando patrones de la vela, usted sabrá cuando la vela será cerrada. Este indicador le permitirá comprobar si se ha formado un patrón conocido y si hay una posibilidad de negociación. El indicador le ayudará a prepararse para la apertura del mercado y el cierre del mercado.

The Renko indicator is a technical analysis tool used in the forex market to visualize price movements and trends by eliminating market "noise." Unlike traditional candlestick or bar charts, Renko is built based on price changes of a specified number of points, called the "brick size." When the price moves by this amount of points, a new "brick" is added to the chart. This indicator ignores time and volume, focusing exclusively on price changes. The main features of the Renko indicator include:
Confident trading with levels of support and resistance! We present to you the indicator " Levels of support and resistance ", which will become your indispensable assistant in the world of trading.
The indicator automatically identifies key levels of support and resistance , on the basis of which you can:
Make Exact Deals : Entering the market at levels of support and resistance greatly increases the chances of successful trading. Identify trend movements : A breakthrough or rebound from

PrecisionWedge Detector X
Description: PrecisionWedge Detector X is an innovative indicator designed to identify and analyze wedge patterns on financial charts with unparalleled accuracy and precision. Developed using advanced algorithms, this indicator provides traders with a powerful tool to detect potential trading opportunities based on wedge formations. Key Features: Automatic Wedge Detection: Powered by sophisticated algorithms, PrecisionWedge Detector X automatically scans price data to
FREE
The presented product is an effective trend indicator which, depending on the settings, can be used for both short-term trading (scalping) and medium/long-term trading strategies. The ease of use of the indicator makes it a good choice for both beginners and experienced traders. The essence of the NRTR (Nick Rypock Trailing Reverse) indicator is that it is always located at a constant distance from the reached price extremes - below the chart on uptrends and above the chart on downtrends. The fo

The presented indicator clearly and very accurately displays the current trend, its beginning and end. The indicator is also used to identify support/resistance levels. The operating principle of the indicator is based on another popular and time-tested indicator - Bollinger Bands. The indicator allows you to send notifications to a mobile terminal and email. Customizable parameters: Bollinger Bands Period; Bollinger Bands Deviation; Offset Factor; Alerts - displays a dialog box containing inf

Indicator ini memudahkan kita untuk memantau Trend Aligator secara Multi Time Frame dalam 1 layar tanpa perlu berpindah pindah time frame pada mt4
Untuk cara penggunakan indicator ini sebagai berikut : 01. Cek Multi Time Frame Monitoring untuk Trade Harian ( Cek D1, H4 , H1 jika 1 arah buy kita Fokus pada pattren buyyer untuk follow tren Time Frame H1 ) 02. Cek Multi Time Frame Monitoring untuk Trade 4 Jam( Cek H4, H1 , M30 jika 1 arah buy kita Fokus pada pattren buyyer untuk follow tren Time

AdvaneZigZag Indicator
Are you tired of the limitations of the traditional ZigZag indicator? Meet AdvaneZigZag, the ultimate tool to simplify your market structure analysis and enhance your trading strategies. Designed with flexibility and precision in mind, AdvaneZigZag brings you advanced features to navigate the market with confidence.
Key Features:
1. Enhanced Flexibility:
- While maintaining the familiar simplicity of the conventional ZigZag indicator, AdvaneZigZag offers superi
FREE
>>> BIG SALE PROMOTION: 50% OFF + GIFT EA! - Promo price: $64 / Regular price $129 <<< - The promotion will end soon!
The Forex Trend Tracker is an advanced tool designed to enhance the trading capabilities of forex traders. This sophisticated indicator uses complex mathematical formulas alongside the Average True Range (ATR) to detect the beginnings of new upward and downward trends in the forex market. It offers visual cues and real-time alerts to give traders a competitive advantage in th

Overview
In the evolving landscape of trading and investment, the demand for sophisticated and reliable tools is ever-growing. The AI Trend Navigator is an indicator designed to meet this demand, providing valuable insights into market trends and potential future price movements. The AI Trend Navigator indicator is designed to predict market trends using the k-Nearest Neighbors (KNN) classifier.
By intelligently analyzing recent price actions and emphasizing similar values, it help
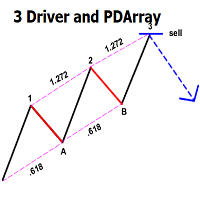
This indicator automatically identifies the SMC 3-Drive pattern and sends notifications to users when the pattern is detected. Additionally, the indicator identifies PDArray (including FVG and OB) and offers an option to combine the 3-Drive pattern with PDArray. This combination provides users with more reliable signals. What is the 3-Drive Pattern? This pattern is formed by three price pushes in one direction, providing a strong reversal signal (Figure 3). The key to identifying this pattern is

The Zigzag Indicator is a powerful tool, developed to assist traders in identifying market trends by highlighting significant highs and lows of a trade. It is designed with the flexibility to adjust to fluctuating market conditions and to filter the minor price fluctuations in the market to focus on substantial ones.
The Zigzag Indicator adheres only to movements that meet a specific percentage or a defined number of points, allowing it to weed out minor price movements and focus solely on
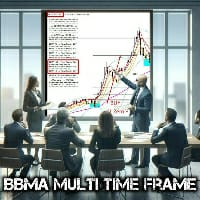
Indicator ini memudahkan kita untuk memantau Trend BBMA Multi Time Frame dalam 1 layar tanpa perlu berpindah time frame
Tentukan arah trading menggunakan indicator yang kami sedikan dengan cara : 01. Cek Multi Time Frame Monitoring untuk Trade Mingguan ( Cek W1, D1, H4 ) jika Time Frame H4 Membentuk Full Setup bbma Fokus Pada Reentry )
02. Cek Multi Time Frame Monitoring untuk Trade Harian ( Cek D1, H4, H1 ) jika Time Frame H1 Membentuk Full Setup bbma Fokus Pada Reentry )
03. Cek Mu

Contact me for instruction, any questions! Introduction Chart patterns are an essential tool traders and investors use to analyze the future price movements of securities. One such pattern is the triple bottom or the triple top pattern, which can provide valuable insights into potential price reversals. This pattern forms when a security reaches a low price level three times before reversing upward or reaches a high price level three times before reversing downward.
Triple Top Bottom

3 Indicators in 1 indicator
Strategy based on price action
Made specifically for the best forex currency pairs
Can be used in the best time frame of the market
at a very reasonable price This indicator is basically 3 different indicatos . But we have combined these 3 indicators in 1 indicator so that you can use 3 indicators at the lowest price.
All three strategies are based on price action. But based on different trends. Long term, medium term and short term
Attributes : No repaintin

You can visually backtest Elliot Wave Impulse to see how it behaved in the past!
Manual guide: Click here Starting price of $59 for the first 25 copies ( 1 left)! -- Next price is $120 .
This indicator is unstoppable when combined with our other indicator called Katana . After purchase, send us a message and you could get it for FREE as a BONUS! The Elliot Wave Impulse is a pattern identified in the Elliott Wave Theory, a form of technical analysis used to a

on free demo press zoom out button to see back.. cnt number is bar numbers.you can change up to 3000 related to chart bars numbers. minimum value is 500. there is g value set to 10000. no need to change it.
this indicator almost grail,no repaint and all pairs ,all timeframe indicator. there is red and blue histograms. if gold x sign comes on red histogram that is sell signal. if blue x sign comes on blue histogram that is buy signal. this indicator on thise version works all pairs.al timeframe
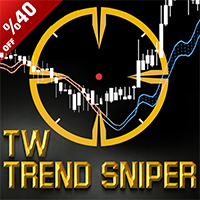
Presentamos el indicador "TW trend sniper" , un potente indicador que se utiliza para identificar las principales tendencias mediante el uso de la fórmula de indicador exclusiva "Trade Wizards" junto con el uso de la acción del precio, la detección de sesiones de negociación de divisas, Fibonacci y funciones de detección y Métodos de eliminación de ruido de inteligencia artificial con alta precisión. Esta estrategia diseñada por el "grupo Trade Wizards", formado por operadores exper

Introduction
The Price Action, styled as the "Smart Money Concept" or "SMC," was introduced by Mr. David J. Crouch in 2000 and is one of the most modern technical styles in the financial world. In financial markets, Smart Money refers to capital controlled by major market players (central banks, funds, etc.), and these traders can accurately predict market trends and achieve the highest profits.
In the "Smart Money" style, various types of "order blocks" can be traded. This indicator

Con esta herramienta comercial, puede escanear 15 mercados simultáneamente.
Presentamos el nuevo indicador comercial 2024:
️ Panel de control Multidivisa Múltiple Marco de tiempo Doble RSI.
Hay al menos dos razones por las que creé esta herramienta comercial:
Primero, estoy aburrido de observar sólo un mercado. En segundo lugar, no quiero perder el momento de entrada en otro mercado.
Por eso quiero conocer al mismo tiempo otras condiciones del mercado.
Por este motivo, necesito un
Introduction
The "Smart Money Concept" transcends mere technical trading strategies; it embodies a comprehensive philosophy elucidating market dynamics. Central to this concept is the acknowledgment that influential market participants manipulate price actions, presenting challenges for retail traders.
As a "retail trader", aligning your strategy with the behavior of "Smart Money," primarily market makers, is paramount. Understanding their trading patterns, which revolve around supply
Otras herramientas de volumen para combinar: https://www.mql5.com/en/market/product/72744 Identificación de extremos de alto volumen: Posicione el indicador como una poderosa herramienta para que los operadores identifiquen períodos de intensa presión de compra o venta. Resalte cómo el amortiguador principal del indicador, que utiliza el volumen, ayuda a los operadores a identificar picos en el volumen que indican una mayor actividad del mercado. Enfatice la importancia de estos extremos de al
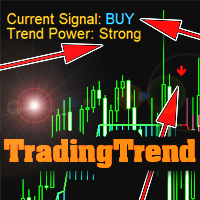
The indicator is not redrawn.
Can be used as a ready-made trading strategy.
Shows: Trend direction; Trend strength; Points of trend reversal or fading. Settings: Trend sensitivity (the lower, the more accurate) - operating sensitivity (the higher, the more accurate); Calculation method - calculation method; Info position - angle of location of the info label (or remove); Text Color - text color; Trend Color Buy - color of the BUY text; Trend Color Sell - SELL text color; Sound Alert - Pop-up

Title: BBMA Structure Guide - BBMA Structure Guide
Description: BBMA Structure Guide is a specialized MQL4 indicator designed to help traders understand the journey of BBMA structure more easily and efficiently. BBMA, or "Bollinger Bands Moving Average," is known for its motto "One Step Ahead," highlighting the importance of understanding market structure in depth.
With BBMA Structure Guide, you can quickly identify the underlying market structure patterns that drive price movements. This w
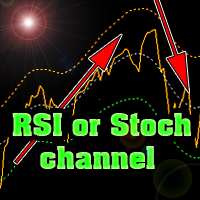
The indicator plots Stochastic or RSI levels in the price channel of a trading instrument.
Download the indicator for FREE right now and test it in the strategy tester.
It is easy to determine the trend direction and overbought or oversold levels.
The settings are standard for any of these indicators.
It is possible to change settings for each trading instrument separately.
You can use currencies, stock markets, futures or cryptocurrencies.
The indicator can be used as an independen
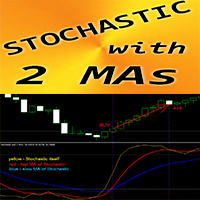
Indicador Forex "Estocástico y 2 medias móviles" para MT4
El oscilador estocástico es uno de los mejores indicadores del mercado y es una herramienta perfecta para muchos traders. El indicador "Estocástico y 2 medias móviles" le permite ver las medias móviles rápidas y lentas del oscilador estocástico Zona de sobrecompra: por encima de 80; Uno sobrevendido: menos de 20 Es fantástico aceptar entradas de venta de zonas superiores a 80 y entradas de compra de zonas inferiores a 20. Puedes ver la

Introducción al indicador MT4: Indicador de nivel de K-line, ayuda a los traders a identificar oportunidades de trading al 100% Resumen: El indicador de nivel de K-line es una herramienta de análisis técnico poderosa que ayuda a los traders a identificar oportunidades de trading de alta probabilidad. Al analizar los máximos, mínimos, aperturas y cierres de las K-lines, este indicador revela niveles ocultos de soporte y resistencia que actúan como imanes para la acción del precio. Funciones: Iden
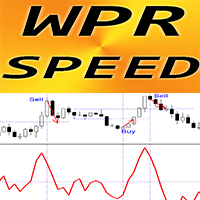
Indicador Forex "WPR SPEED" para MT4: ¡excelente herramienta predictiva!
El cálculo de este indicador se basa en ecuaciones de la física. WPR SPEED es la primera derivada del propio oscilador WPR WPR SPEED es bueno para especular entradas en mercados laterales y planos El indicador WPR SPEED muestra qué tan rápido el propio WPR cambia de dirección: es muy sensible Se recomienda utilizar el indicador WPR SPEED para estrategias comerciales de especulación de impulso: encuentre picos de indicado

The Deep Space Divergence indicator carefully analyzes price dynamics, identifying temporary weakening of the trend or sharp changes in its direction. By monitoring the readings of this indicator, you can easily notice changes in the market and take appropriate action. Entering the market may be easy, but staying in it is much more difficult. With Deep Space Divergence, you will have a reliable base to successfully stay ahead of the trend. This indicator allows you to analyze historical data an
Free for a limited time! It may be terminated at any time, please seize the opportunity If you think the indicator is useful, you can give me 5 stars!
This indicator is not an EA,so it does not have the 'ORDER' function. It only simulates placing orders, so please use it with confidence.
Instructions for use: |←:Choice Bar. →:Start.You can also press the 'X' key on the keyboard to go back and the 'Z' key to go forward. X1:Bar Speed. →|:Back to current time.
Note: If you pull too far forwa
FREE

Introduction
"Smart money" is money invested by knowledgeable individuals at the right time, and this investment can yield the highest returns.
The concept we focus on in this indicator is whether the market is in an uptrend or downtrend. The market briefly takes a weak and reversal trend with "Minor BoS" without being able to break the major pivot.
In the next step, it returns to its main trend with a strong bullish move and continues its trend with a "Major BoS". The "order bloc

Market Magnet - This is not just a convenient tool, but rather an indispensable assistant for those who prefer to analyze the market using a clean chart. Sometimes even experienced traders need an additional analytical tool to identify key entry and exit points for trades. That's where Market Magnet comes in.
This indicator is ideal for those who often have difficulty identifying trend inflection points or drawing trend lines on a chart. It offers a visual representation of key market moments
The indicator determines the ATR value (points) in a classic way (taking into calculation paranormal bars/candles) and more correctly - ignoring paranormal movements of the Instrument. Correctly it is excluding paranormal bars from the calculation, extremely small bars (less than 5% of the standard ATR) and extremely large bars (more than 150% of the standard ATR) are ignored. The Extended version - allows you to set calculation parameters and a lot of other input parameters Ver

hint: my basic indicators are used like that KingLevel combind with KingSequence will provides basic insights of the price action of the markets and KingSequenceSgn is just for the convienent for watching. And plus with Forex Trading mentor subsccription I will assist you to win the market at first later if it's great will be upgraded to King Forex trading mentor.
It just the main chart sign of the "KingSequence" indicator.
Here is the detals from the "KingSequence" indicator
Slide 1: Ti
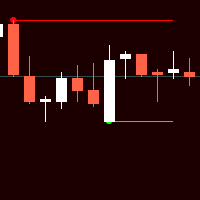
Индикатор Форекс и бинарных опционов основан на простых паттернах из двух свечей. Стрелки вообще не рисуют. Даже при смене таймфреймов.
В настройках можно включить или отключить линию уровня.
Также в настройках можно менять коды стрел, их цвета (также цвета линии уровней), Размер и расстояние от свечи (баров).
Индикатор прост в применении. А настройки тоже не сложные. Единственно не рекомендуется увеличивать период (step). По умолчанию прописано 500. Больше этого уже загружает терминал.
FREE
Highly configurable Trader Dynamic Index (TDI) indicator.
Features: Highly customizable alert functions (at levels, crosses, direction changes via email, push, sound, popup) Multi timeframe ability (higher and lower timeframes also) Color customization (at levels, crosses, direction changes) Linear interpolation and histogram mode options Works on strategy tester in multi timeframe mode (at weekend without ticks also) Adjustable Levels Parameters:
TDI Timeframe: You can set the lower/higher
FREE

EMA Above Below Bid price Технический индикатор в помощь трейдеру. Данный индикатор, показывает расположение пяти ЕМА,
пяти средних скользящих, относительно цены формирующей японские свечи или бары (цена Bid ).
О понятии ЕМА.
Скользящая средняя (moving average, MA) — это дополнительная линия на графике цены актива.
Внешне она повторяет график цены, но с небольшим запозданием и более гладко, без колебаний. Основные характеристики:
1. Показывает тренды. Если скользящая устрем
FREE

Contact me for instruction, any questions! Introduction Triangle chart patterns are used in technical analysis , which is a trading strategy that involves charts and patterns that help traders identify trends in the market to make predictions about future performance.
Triangle Pattern Scanner Indicator It is usually difficult for a trader to recognize classic patterns on a chart, as well as searching for dozens of charts and time frames will take time, and there is also a possibility of a
AlphaTrend AM is an indicator that allows you to open a position at the very beginning of a significant price movement. The second most important quality of the indicator is the ability to follow the trend as long as possible in order to obtain all potential profits while minimizing potential losses. The indicator allows you to notify the user about your signals by sending messages to the terminal and e-mail. This indicator does not repaint or not recalculate.
The indicator is a synthesis of t

This indicator will show week and monthhigh low, very useful to understand the market sentiment. To trade within the range/ break out. Low- can act as support- can used for pull back or break out High- can act as resistance- can used for pull back or break out Breakout strategy refers to the day trading technique that provides traders with multiple opportunities to go either long or short . The main idea is to identify the trend in its most juicy state followed by a trending move.
FREE

High and Low Levels EMA Технический индикатор в помощь трейдеру. Однажды пришла идея при изучении индикатора Moving A verage ( MA ).
Так как мувинги эти сглаженное, среднее значения цены за выбранный период, то как и у обычной цены и у мувинга
должны быть «хаи и лои».
Данный индикатор, показывает уровни High и Low . Динамических уровней поддержки и сопротивления.
О понятии High и Low .
Хай — от английского high — обозначает наиболее высокую цену («рынок на хаях » — капитализ
FREE

Safe Trade Indicator MT4
The Safe Trade indicator is an analytical and technical tool that has different features and very accurate signals. This indicator can be used in various markets such as the stock market and the forex market. It states and also provides buy and sell signals.
Features of the Safe Trade indicator
Receiving signals as notifications on the Metatrader mobile application. Receive signals by email. Receiving signals in the form of warning messages or alarms on Metatrader.

TrendWave Oscillator is an advanced MT4 oscillator that not only identifies the trend direction but also provides visual and audio alerts to enhance trading strategies.
Key Features: - Color-coded trend indication: - Blue : Indicates an uptrend, signaling potential price growth. - Orange : Indicates a downtrend, suggesting possible price decline. - Gray : Represents a flat market or lack of clear entry signals.
- Graphical signals on the chart : - Aqua : Highlights an uptrend, empha

TLBD Chart Indicator MT4
Drawing a trend line in price charts is one of the most important methods to identify the market trend, many traders use the trend line break for positioning because they believe that the trend line break means changing the trend and creating a new trend. As a result, the breaking of the trend line is an important sign for traders to open their positions in the direction of the trend. The TLBD indicator is a very suitable tool for detecting the breaking of dynamic tren
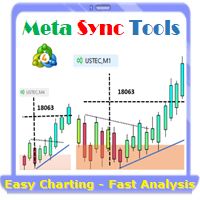
Supercharge Your MetaTrader Analysis and Trading with Meta Sync Tools! Struggling to analyze price action across different timeframes? Meta Sync Tools eliminates the frustration of unsynced crosshairs and charts, allowing seamless multi-timeframe analysis. Missing key correlations between assets and constantly switching between charts? Meta Sync Tools empowers you to visualize relationships between instruments effortlessly. Tired of wasting time on repetitive tasks? With 30+ Customizable Short

hint: my basic indicators are used like that KingLevel combind with KingSequence will provides basic insights of the price action of the markets and KingSequenceSgn is just for the convienent for watching. And plus with Forex Trading mentor subsccription I will assist you to win the market at first later if it's great will be upgraded to King Forex trading mentor.
Slide 1: Title Slide Title: Unveiling Market Rhythms with Advanced Price Momentum Analysis Subtitle: A Revolutionary Trading Ind

Use GANN 369 to use a combination of 30's,60's,90's time to cross 3's,6's,9's. Any larger combination of these cross smaller combinations of these
Using GANN 369 Method for Trading Reversals The GANN 369 method, inspired by the works of W.D. Gann and Nikola Tesla's 3, 6, 9 numerical patterns, can be employed to identify potential reversals in financial markets. By combining specific periods (30, 60, and 90) with the numbers 3, 6, and 9, traders can seek opportunities for trend changes.
Our custom Kalman Filter indicator is a sophisticated, adaptive tool designed for MetaTrader 4 (MT4), giving traders a dynamic approach to analyzing the financial markets. This indicator is based on the Kalman Filter algorithm, a powerful statistical method used to estimate linear dynamic systems. It is specifically designed for traders who need an advanced, responsive tool to monitor market trends and make informed decisions. We have slightly modified the algorithm for this filter to provide b

There is No use in the Testing Demo. You will understand nothing from running flashing numbers. It is a Dashboard. Just try to understand idea, get it and I will help in everything further. Symbols must be separated by commas (,) and entered into the parameters exactly as displayed by your broker to ensure they are recognized in the dashboard. These symbols will be used for analysis by the indicator.
With one click open any pair any timeframe directly from dashboard The MA Speedometer Dashboar
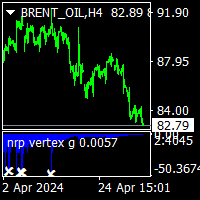
nrp vertex g indicator is no repaint vertex indicator. it works all time frame and all pairs. working princible is wery easy and can use beginners. when histogram up side and there is a white star on it that is buy signal.. and reverse signal sell comes when histogram below zero and white star on it.that is sell signal. indicator hold long time to signal.and it is not neccesary to stay on computer. minimum bar number is 500 bars on chart to work of it. and the cnt nr is minimum 500 can be. but p

volatility level indicator is a volatility oscillator to see trend reversal points. price trends has reverese when volatility inreased . this indicator show trend reversal points volatility. mostly same level up and down volatility is reversal points. red colour shows up points of volatilty.and probably trend will down. blue colour oscillator shows deep point of price when increased volatiliyty. on pictures horizontal lines on oscillator has drawed by hand.to see the before level and compare now
El Smart Volume Tracker es un indicador diseñado para proporcionar información sobre el sentimiento del mercado al presentar visualmente datos de volumen de oferta y demanda en una ventana dedicada. Esta herramienta intuitiva ayuda a los operadores a identificar rápidamente dónde se concentra la actividad de compra y venta, lo que les permite tomar decisiones comerciales más informadas.
Con Smart Volume Tracker, puede evaluar fácilmente si el mercado se inclina hacia una tendencia alcista o b
El indicador RSI Pro Analyzer es una poderosa herramienta diseñada para operadores que buscan tomar decisiones informadas en múltiples períodos de tiempo simultáneamente. Este indicador utiliza el RSI para proporcionar señales de sobrecompra, sobreventa y tendencia , lo que facilita la identificación de oportunidades de entrada al mercado. Su principal ventaja es su facilidad de lectura gracias a sus códigos de colores claros y distintos para indicar las diferentes condiciones del mercado.
El

Con esta herramienta comercial, puede escanear 15 mercados simultáneamente.
Presentamos el nuevo indicador comercial 2024:
️ Panel de control Multidivisa Multiplazo Doble CCI.
Hay al menos dos razones por las que creé esta herramienta comercial:
En primer lugar, estoy aburrido de observar sólo un mercado. En segundo lugar, no quiero perder el momento de entrada en otro mercado.
Por eso quiero conocer al mismo tiempo otras condiciones del mercado.
Por este motivo, necesito un escáne
Indicador Forex HTF Force Oscillator para MT4
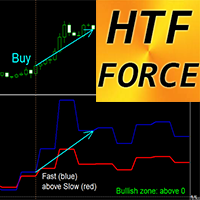
HTF Force es un poderoso indicador para el comercio de marcos de tiempo múltiples. HTF significa - Marco de tiempo más alto El índice de fuerza es uno de los principales indicadores que combina datos de precio y volumen en un solo valor. Los valores del período de tiempo máximo pueden mostrarle la dirección de la tendencia (tendencia bajista - por debajo de 0; tendencia alcista - por encima de 0) Fuerza Rápida - Línea Azul, Fuerza Lenta - Línea Ro
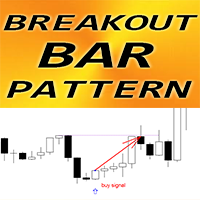
Indicador Forex "Patrón de barra de ruptura" para MT4
El indicador "Patrón de barra de ruptura" es un indicador muy poderoso para el comercio de acción del precio: sin repintado, sin demoras; El indicador detecta patrones de barras de ruptura en el gráfico: Patrón de barra de ruptura alcista: señal de flecha azul en el gráfico (ver imágenes) Patrón de barra de ruptura bajista: señal de flecha roja en el gráfico (ver imágenes) con alertas para PC, móvil y correo electrónico El indicador "Patró
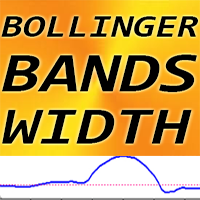
Ancho de las bandas de Bollinger del indicador Forex para MT4, sin repintado.
-El indicador de ancho BB es aplicable para usar junto con el indicador estándar de Bandas de Bollinger. -Este software es imprescindible para todo fanático del indicador de Bandas de Bollinger, porque su combinación es muy eficiente para operar con Breakouts -El indicador de ancho BB muestra la distancia (alcance) entre las bandas de Bollinger.
CÓMO UTILIZAR el ancho de BB (consulte el ejemplo en la imagen): 1) E
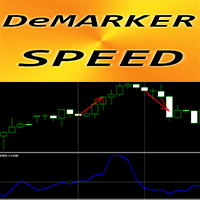
Indicador Forex "Velocidad DeMarker" para MT4
El cálculo de este indicador se basa en ecuaciones de la física. DeMarker Speed es el primer derivado del propio DeMarker La curva del oscilador DeMarker indica la posición actual del precio en relación con los máximos y mínimos anteriores durante el período de cálculo del indicador. La velocidad de DeMarker es buena para especular entradas cuando el oscilador DeMarker estándar está en la zona de Sobreventa/Sobrecompra (como en las imágenes) El in
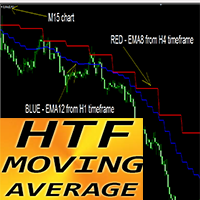
Indicador Forex HTF PROMEDIO MÓVIL para MT4
Actualice sus métodos comerciales con el indicador HTF MA profesional para MT4. HTF significa - Marco de tiempo más alto Este indicador es excelente para los operadores de tendencias con entradas de acción del precio. El indicador HTF MA le permite adjuntar la media móvil desde un período de tiempo superior a su gráfico actual. El indicador muestra la tendencia desde un período de tiempo más alto -> este es siempre un método rentable. El indicador H
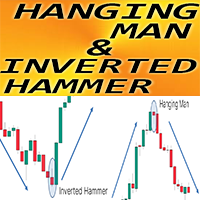
Indicador Forex "Patrón de hombre colgado y martillo invertido" para MT4
El indicador "Patrón de hombre colgado y martillo invertido" es un indicador muy potente para el comercio de acción del precio: sin repintado, sin retrasos; El indicador detecta patrones alcistas de Martillo invertido y bajistas del Hombre colgado en el gráfico: Martillo invertido alcista: señal de flecha azul en el gráfico (ver imágenes) Hombre ahorcado bajista: señal de flecha roja en el gráfico (ver imágenes) Se inclu
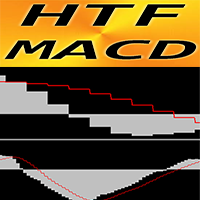
Indicador Forex HTF MACD Oscilador para MT4
HTF significa - Marco de tiempo más alto El indicador MACD en sí es uno de los indicadores más populares para el comercio de tendencias. Este indicador es excelente para sistemas de negociación de marcos de tiempo múltiples con entradas de acción del precio o en combinación con otros indicadores. El indicador HTF MACD le permite adjuntar MACD desde un período de tiempo superior a su gráfico actual -> este es un enfoque comercial profesional El indic
MetaTrader Market es el mejor lugar para vender los robots comerciales e indicadores técnicos.
Sólo necesita escribir un programa demandado para la plataforma MetaTrader, presentarlo de forma bonita y poner una buena descripción. Le ayudaremos publicar su producto en el Servicio Market donde millones de usuarios de MetaTrader podrán comprarlo. Así que, encárguese sólo de sus asuntos profesionales- escribir los programas para el trading automático.
Está perdiendo oportunidades comerciales:
- Aplicaciones de trading gratuitas
- 8 000+ señales para copiar
- Noticias económicas para analizar los mercados financieros
Registro
Entrada
Si no tiene cuenta de usuario, regístrese
Para iniciar sesión y usar el sitio web MQL5.com es necesario permitir el uso de Сookies.
Por favor, active este ajuste en su navegador, de lo contrario, no podrá iniciar sesión.