Help me finding a stable region from my strategy
Hello, newbie here. I have a question about finding a stable setting in optimization. I attached an image of the strategy with 1d, 2d, and 3d graph below.
What criteria that you use to determine a stable region?
From 1d graph I looked at area besides (left and right) the peak or the most profitable strategy. I don't really used 2d graph as the gradient not really clear if it's not really a contrast different. Lastly, on 3d graph I looked at orange-greenish to bright green. From the optimization result my stable are for entry is around 24, 26, 28 and 40ish and the exit is around 8, 10 and 12. Does my deduction correct?
You need a new strategy, if i can be honest. The strategy does not seem to work all that well. You need to remember, there is a big difference between back tested and forward tested results. When you test an Ea or indicator, you can clearly see if it will have a chance to be profitable or not. This comes with years of experience, having tested 1000's and 1000's of Ea's and indicators. Just like a sick patient, there are certain symptoms to look at to diagnose the sickness, the same with Ea's and indicators, We as Developers and coders (the few developers that are left) can see if the strategy is punchy or not. So from me as a developer and coder. I would say it is good to test it in the market on a demo, although i can not find a reasonable answer to your question. My answer would be just to try another strategy, or to forward test this one, and make necessary adjustments.
Remember, sometimes its the simple strategies that are greatly profitable, trading does not have to be a pain. Don't think too hard, then from there you will see how easy it gets. A good way to test strategies is by getting Forex Tester. You can add indicators to the chart and see how they perform, when the best profitable strategy is found, then you can code it, it just creates a piece of mind that you are on the right path
Just like a sick patient, there are certain symptoms to look at to diagnose the sickness, the same with Ea's and indicators
do you mean an intuition that tells you if it's a profitable strategy or not?
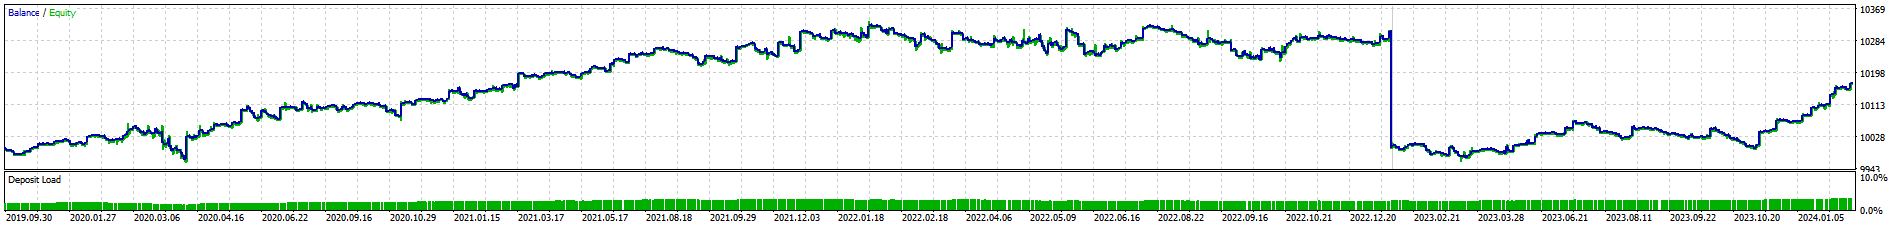
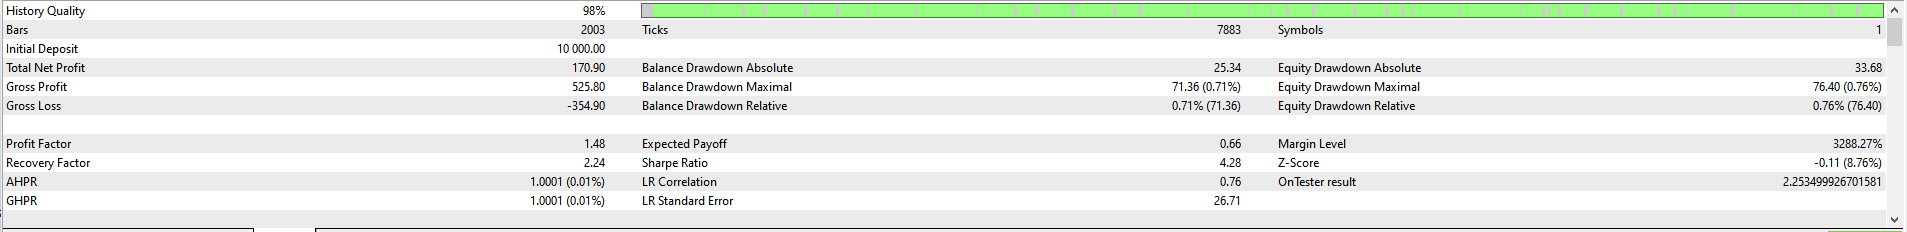
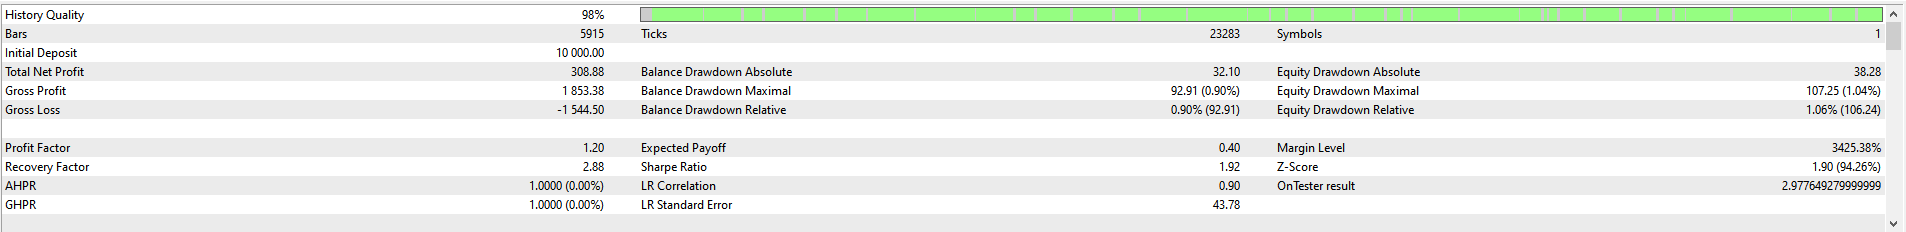
I attached the best backtest and forward test from the best optimization below. It looked good to be honest that's why I wanna hear an opinion from other if it's a good strategy or not.
Remember, sometimes its the simple strategies that are greatly profitable, trading does not have to be a pain
TBH this is a simple strategy and doesn't use any indicator just a bar chart and price action.
If this is a good strategy I will try to run it on demo account and try to see if this is profitable or not.
do you mean an intuition that tells you if it's a profitable strategy or not?
I attached the best backtest and forward test from the best optimization below. It looked good to be honest that's why I wanna hear an opinion from other if it's a good strategy or not.
TBH this is a simple strategy and doesn't use any indicator just a bar chart and price action.
If this is a good strategy I will try to run it on demo account and try to see if this is profitable or not
- Free trading apps
- Over 8,000 signals for copying
- Economic news for exploring financial markets
You agree to website policy and terms of use
Hello, newbie here. I have a question about finding a stable setting in optimization. I attached an image of the strategy with 1d, 2d, and 3d graph below.
What criteria that you use to determine a stable region?
From 1d graph I looked at area besides (left and right) the peak or the most profitable strategy. I don't really used 2d graph as the gradient not really clear if it's not really a contrast different. Lastly, on 3d graph I looked at orange-greenish to bright green. From the optimization result my stable are for entry is around 24, 26, 28 and 40ish and the exit is around 8, 10 and 12. Does my deduction correct?