Experiment - page 42
You are missing trading opportunities:
- Free trading apps
- Over 8,000 signals for copying
- Economic news for exploring financial markets
Registration
Log in
You agree to website policy and terms of use
If you do not have an account, please register
Yeah, well..,
and they run like trams... strictly on time and with stops. But there are nuances.
Tram DepotTheory
and they run like trams... strictly on time and with stops. But there are nuances.
Tram DepotTheory
and they run like trams... strictly on time and with stops. But there are nuances.
Tram DepotTheory
Strictly scheduled tramways can be disrupted by a power line breakdown.
Strictly scheduled tramways can be disrupted by a power line breakdown.
it's all about fun bubbles ;-) as always, "the devil is in the details"
---
at an (objectively, statistically) trending rate of just a few points per hour, the volatility is orders of magnitude higher.
Trams can leapfrog
---
PS/ by the way, funny word "cropped" ; the meaning depends on the I/E and the reader's perception
Maybe so, I just don't know where to start anymore.
The only solution as to how to apply PNB is to look for pivot points like in the picture below.
Well ... maybe... the market is changing so fast that even the price chart itself sometimes lags, not to mention the indicators that summarize it... until the NDP builds something the market changes its key condition 10 times.
Yeah..,
Very simple, enter when it is not there yet in principle.
Googling digital noise reduction the other day and you know, I googled a hand-drawn screen with red and blue paste.
Only two bars work, with one more for beauty.
I have made the indicator, it is a trend indicator, I tried it and it works like in a primer.
On the history of well.
I had a problem before - reversal signal is received but price is not there. In other words, price is on a low instead of the high one, or vice versa. It is not profitable to open.
The issue is sort of solved here - google it yourself.
This is a brilliant screenshot, take your word for it.
If the phrase "digital processing" scares you - in principle, any indicator is one.SELL on EUR/NZD was closed and BAY was opened. See how this happens:
Equity over balance exceeded $2. It was predicted to fall. Equity and balance will rise steadily..: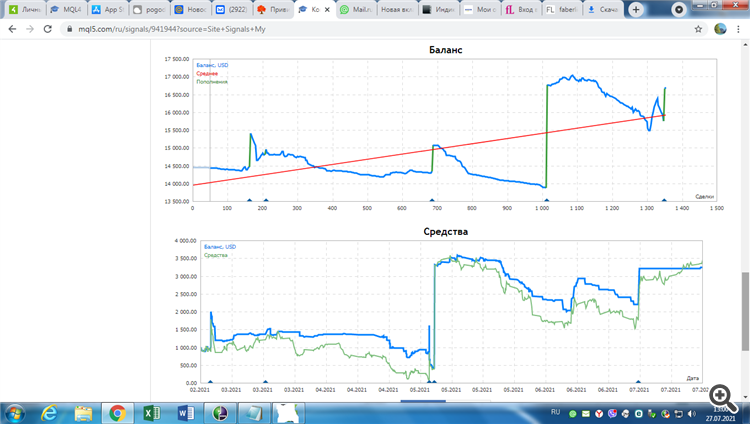
SELL on EUR/NZD was closed and BAY was opened. See how this happens:
Equity over balance exceeded $2. It was predicted to fall. Equity and balance will rise steadily.
You have a sample of 300 days. Do you understand the frequency with which things can change? And you draw conclusions from a few days.