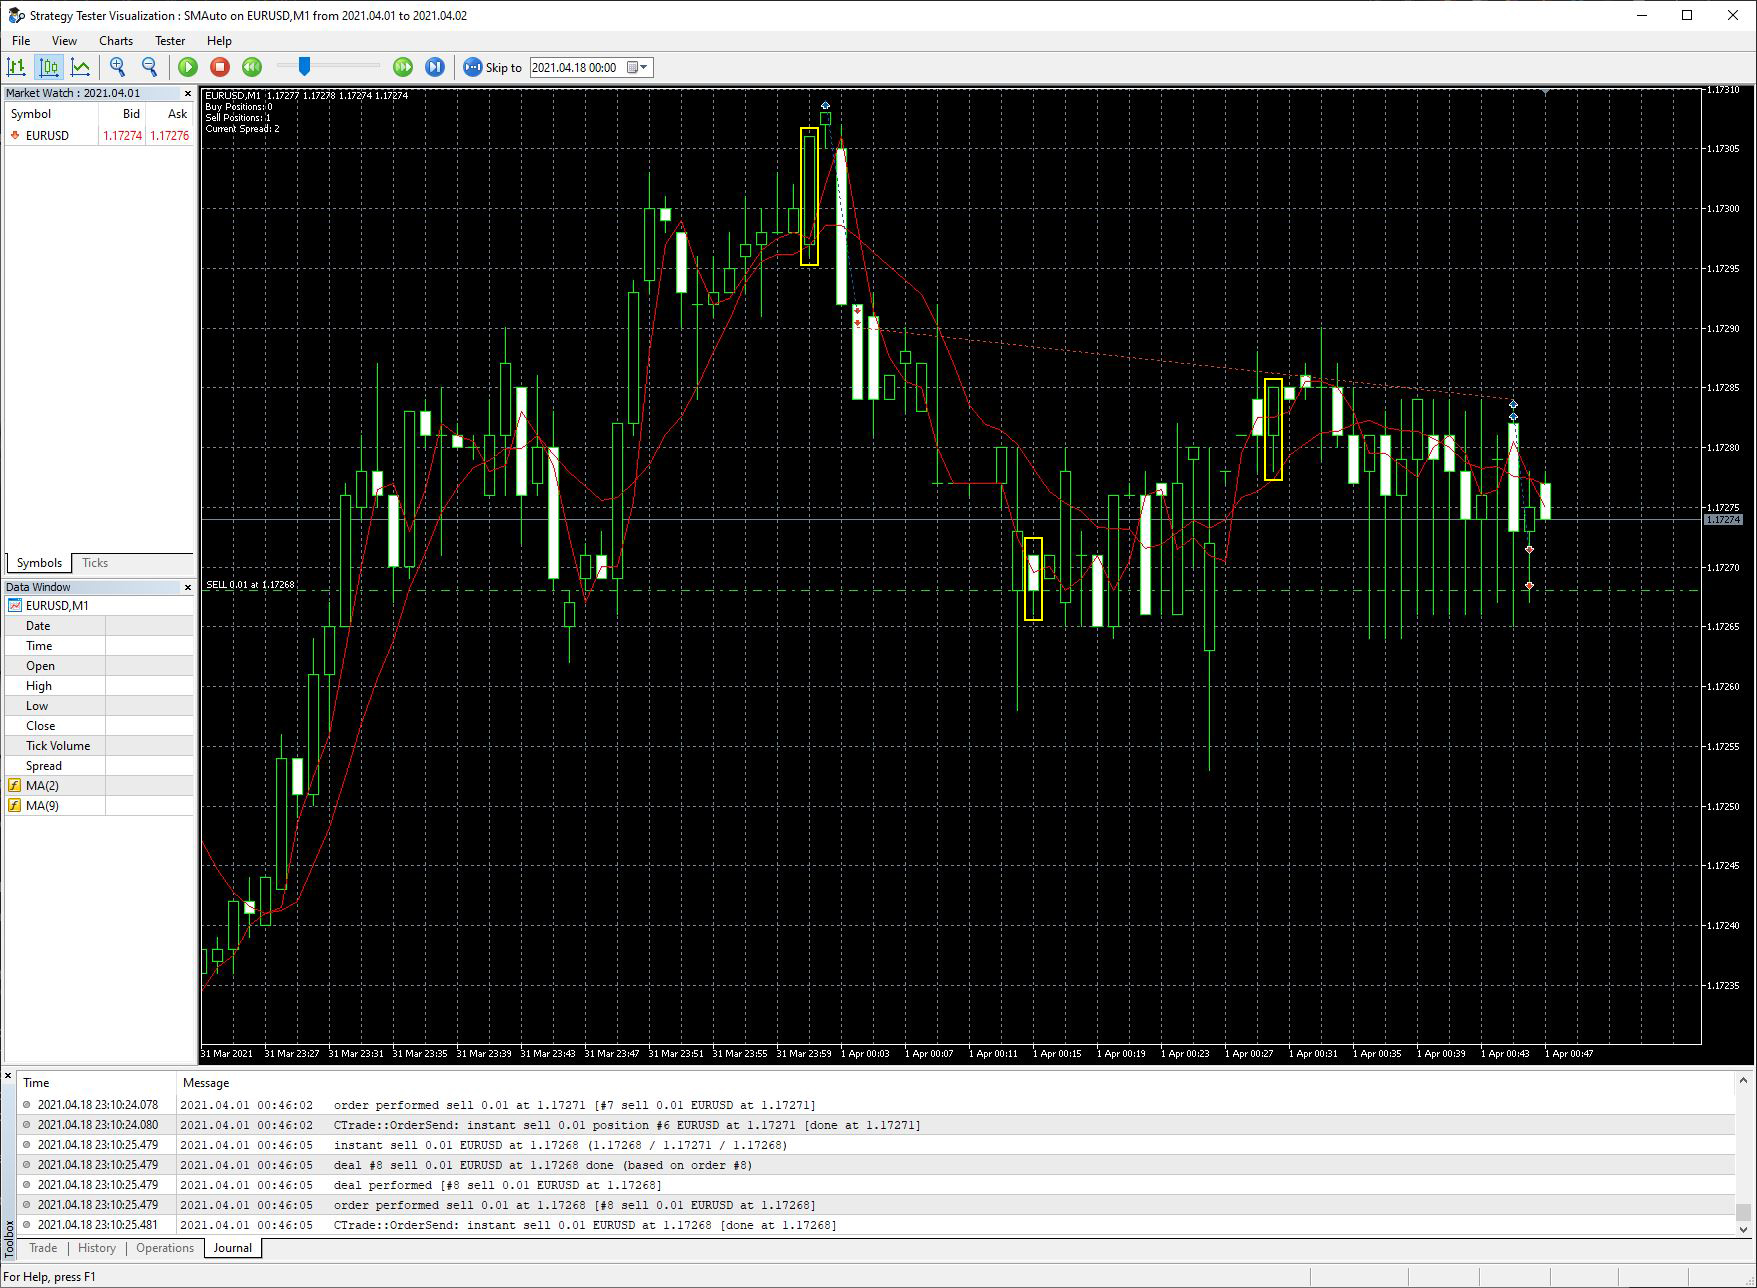
Strategy tester and resulting graph don't match
The visual tester is designed for VISUAL testing control. Do not use the maximum testing speed and trades will be in place.
Hi Vlad.
I slowed down the visualizer significantly and ran it for a few minutes and the results still seem to be the same. Again, the visual tester is giving me results which should be correct according to my planning, the graph in MetaTrader is giving me rogue trade buy/sell indicators.
Results attached. I highlighted where the the rogue trades are.
Side note: Thanks so much for your help on my previous issue, it worked perfectly.
Specify more precisely - what confuses you? Show ONE trade and describe in detail what is wrong with it.
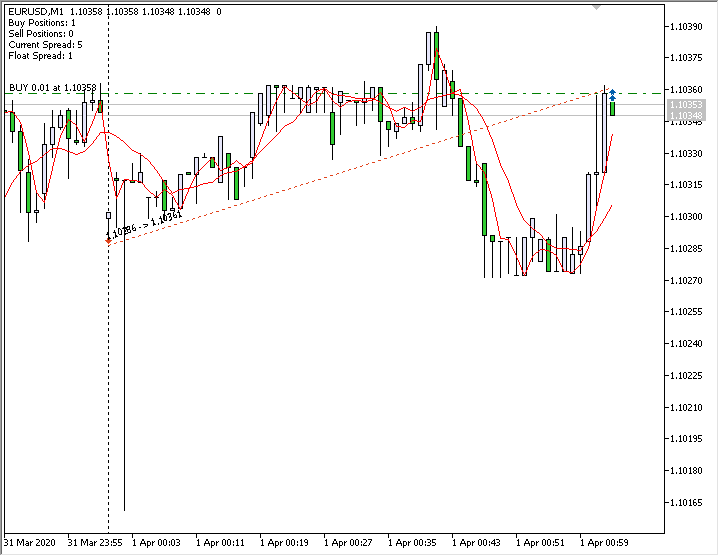
Also remember to display TWO prices: 'ASK' and 'BID' - This is very important.The trades highlighted on the image labeled "Graph.JPG" shouldn't be there - especially that second one in the middle, the code wont allow a buy trade if the candle's opening price is below the SMA lines, and they correctly don't show up on "Tester.JPG" So I'm confused why they are on "Graph.JPG"
Specify the exact date. Enter ONE trade.
Specify the exact date. Enter ONE trade.
I should clarify this is an EA making the trades for me, I'm not entering the trades manually. The time frame I'm testing on is April 1 - 2. I attached the code in the original post if it helps to look at.
Theres are a few trades that only show up on Graph.JPG, specifically the buy trade on April 1st at 00:13 , there's no way that should be there.
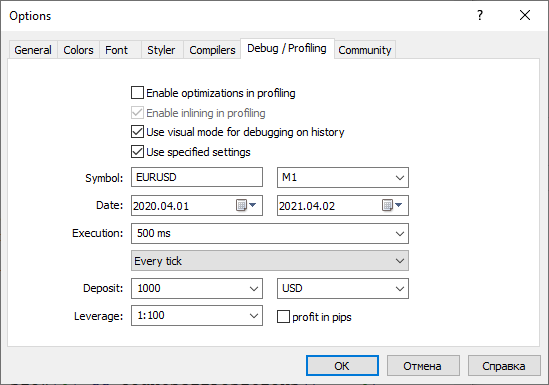
Set breakpoints

and investigate your problem.
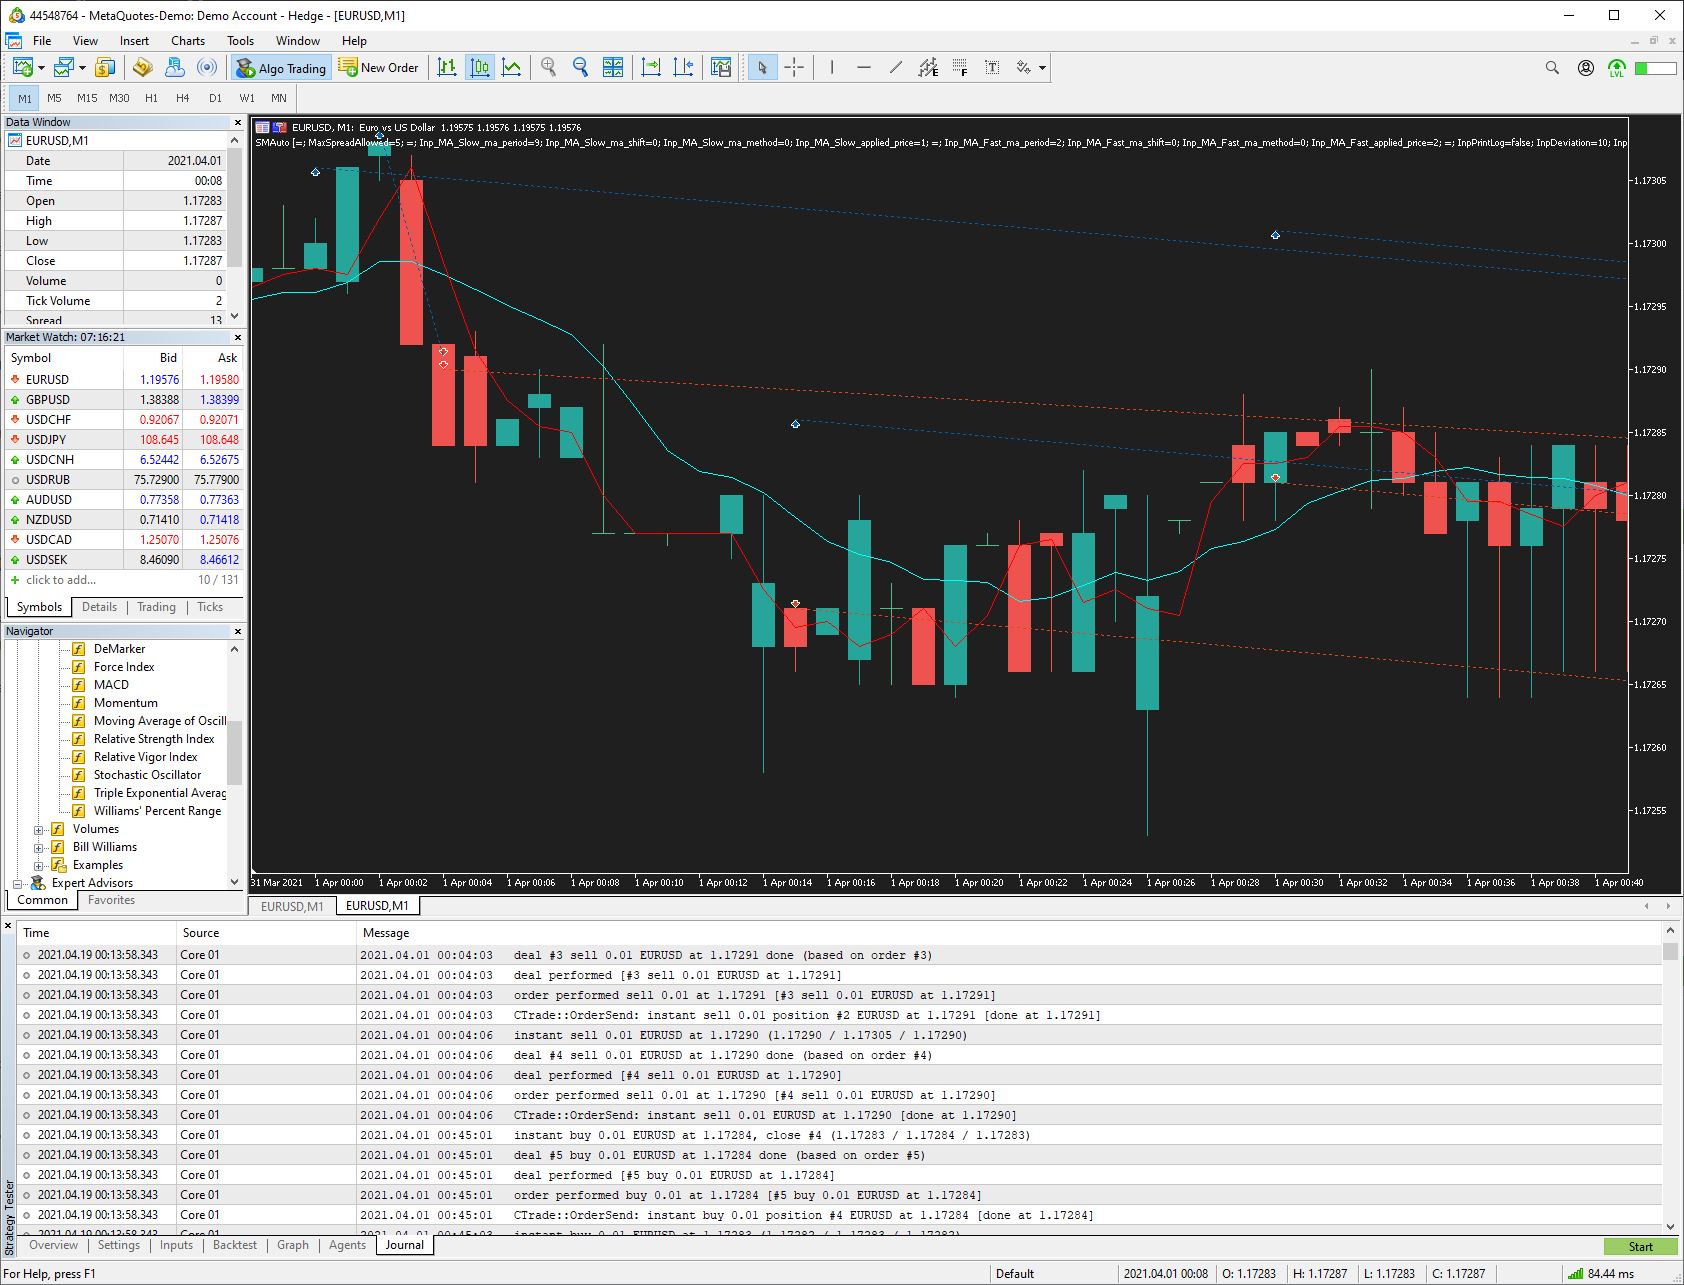
I have so:
Transactions:
2021.04.19 07:14:30.859 2020.04.01 00:00:30   instant sell 0.01 EURUSD at 1.10286 (1.10286 / 1.10339 / 1.10286)
2021.04.19 07:14:30.859 2020.04.01 00:00:30   deal #2 sell 0.01 EURUSD at 1.10286 done (based on order #2)
2021.04.19 07:14:30.859 2020.04.01 00:00:30   deal performed [#2 sell 0.01 EURUSD at 1.10286]
2021.04.19 07:14:30.859 2020.04.01 00:00:30   order performed sell 0.01 at 1.10286 [#2 sell 0.01 EURUSD at 1.10286]
2021.04.19 07:14:30.861 2020.04.01 00:00:30   CTrade::OrderSend: instant sell 0.01 EURUSD at 1.10286 [done at 1.10286]
2021.04.19 07:14:42.639 2020.04.01 01:03:02   instant buy 0.01 EURUSD at 1.10361, close #2 (1.10356 / 1.10361 / 1.10356)
2021.04.19 07:14:42.639 2020.04.01 01:03:02   deal #3 buy 0.01 EURUSD at 1.10361 done (based on order #3)
2021.04.19 07:14:42.640 2020.04.01 01:03:02   deal performed [#3 buy 0.01 EURUSD at 1.10361]
2021.04.19 07:14:42.640 2020.04.01 01:03:02   order performed buy 0.01 at 1.10361 [#3 buy 0.01 EURUSD at 1.10361]
2021.04.19 07:14:42.642 2020.04.01 01:03:02   CTrade::OrderSend: instant buy 0.01 position #2 EURUSD at 1.10361 [done at 1.10361]
2021.04.19 07:14:44.032 2020.04.01 01:03:04   instant buy 0.01 EURUSD at 1.10358 (1.10353 / 1.10358 / 1.10353)
2021.04.19 07:14:44.032 2020.04.01 01:03:04   deal #4 buy 0.01 EURUSD at 1.10358 done (based on order #4)
2021.04.19 07:14:44.032 2020.04.01 01:03:04   deal performed [#4 buy 0.01 EURUSD at 1.10358]
2021.04.19 07:14:44.032 2020.04.01 01:03:04   order performed buy 0.01 at 1.10358 [#4 buy 0.01 EURUSD at 1.10358]
2021.04.19 07:14:44.034 2020.04.01 01:03:04   CTrade::OrderSend: instant buy 0.01 EURUSD at 1.10358 [done at 1.10358]
I should clarify this is an EA making the trades for me, I'm not entering the trades manually. The time frame I'm testing on is April 1 - 2. I attached the code in the original post if it helps to look at.
Theres are a few trades that only show up on Graph.JPG, specifically the buy trade on April 1st at 00:13 , there's no way that should be there.
In fact, I'm also looking at the Journal and the rogue trades dont show up there either. Look at Apr 1, 00:14. There's no trade made 14 minutes on the journal but there is a buy signal way above the candle on the chart.
In fact, I'm also looking at the Journal and the rogue trades dont show up there either. Look at Apr 1, 00:14. There's no trade made 14 minutes on the journal but there is a buy signal way above the candle on the chart.
Where? Where to see? Is it really so difficult for you to make deals ON a WHITE BACKGROUND and highlight the deal with a marker? How am I supposed to guess? I'm not a telepathic person.
- Free trading apps
- Over 8,000 signals for copying
- Economic news for exploring financial markets
You agree to website policy and terms of use
I seem to be having a strange issue with the strategy tester and the graph it renders in MetaTrader.
The strategy testing visualization is showing me what should be correct according to what I planned in my code. However the resulting graph that comes up in MetaTrader shows me something quite different, with Buy and Sell indicators outside of the spread filter and long opening/closing lines shooting across the chart.
I attached two screenshots showing the same time frames. As well as the source code (maybe someone can see if they can replicate the issue)
Any idea what's going on? and which one I'm supposed to trust to be accurate?
Thanks for all the help so far!