Referencing an arrow
I have an indicator in ex4 format that displays the following:
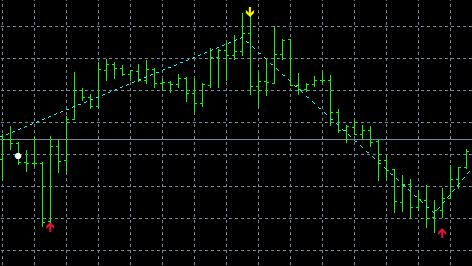
-As a buy signal
Underneath the last bar, it will display a red arrow pointing up.
-As a sell signal
Above the last bar, it will display a yellow arrow pointing down.
I have attached a screenshot so you can see for yourself.
What I don't know is how to reference the arrow.?
Well the arrow is hopefully in an indicator buffer which you can access using iCustom (search this forum for its usage if you struggle with the documentation - which is likely)
The UP arrows will be in one buffer and the down arrows will be in another. You may have to experiment to find out which is which.
Crumbs, my attaching skills aren't very good. I click on choose file and then I can't see a button to actually attach it :-(
Anyway, thanks for the reply Dabbler. I've written a statement using iCustom but can't get it to work. I've gone for:
if (iCustom(NULL, PERIOD_H1, " iSignal ",55,17,5,1) < Low[1]) {
//Buy Order
}
This what I'd do if I was expecting a line to be under the bar. I didn't think an arrow would be different..
Ah ha, I thought I'd read your reply before I posted. Thanks for showing me how to post images Dabbler :-)
JohnnyInamoto:
I've written a statement using iCustom but can't get it to work. I've gone for:
if (iCustom(NULL, PERIOD_H1, " iSignal ",55,17,5,1) < Low[1]) {
//Buy Order
}
JohnnyInamoto:,
but it works now.

- Free trading apps
- Over 8,000 signals for copying
- Economic news for exploring financial markets
You agree to website policy and terms of use
I have an indicator in ex4 format that displays the following:
-As a buy signal
Underneath the last bar, it will display a red arrow pointing up.
-As a sell signal
Above the last bar, it will display a yellow arrow pointing down.
I have attached a screenshot so you can see for yourself.
What I don't know is how to reference the arrow. Obviously with a line, I can check to see whether it is above, below or equal to a certain value. How can I check to see if an arrow exists under a certain bar?
Thanks