Discussion of article "An Example of a Trading System Based on a Heiken-Ashi Indicator"
with block diagrams would be cool.
I'll read
We have received complaints that the Expert Advisor does not always work.
Please replace the file MQL5\Indicators\Examples\Heiken_Ashi.mq5 with the file located in the Code Base at https://www.mql5.com/en/code/33 and recompile it.
After that everything should work.
And please, correct this file in the standard delivery.

- votes: 10
- 2010.01.26
- MetaQuotes Software Corp.
- www.mql5.com
The recursive construction referring to itself is not clear: "haOpen=(haOpen[ancestor]".
Hi, i red this article and i found it very interesting. first of all thanks, second is it possible to have it translated for MT4 ?
Thanks in advance
Dear Dmitry, this is really great, well explained, enormous contribution to MQL5 community, unfortunately I can't follow everything you explained, that is more from my side than yours, that's how my brains are wired, I can understand say 70% rest is magic to me.
However, something is wrong with the code.
I ran a test from 2014.01.01 till 2024.01.19. EURUSD, H1, 1.000,00 EUR.
Right from the bat at the first candle it goes wrong.
The first candle 2014.01.01 23:00 Open 1.37550 High 1.37648, Low 1.37372, Close 1.37580.
The graph show a red candle and it should be a blue candle.
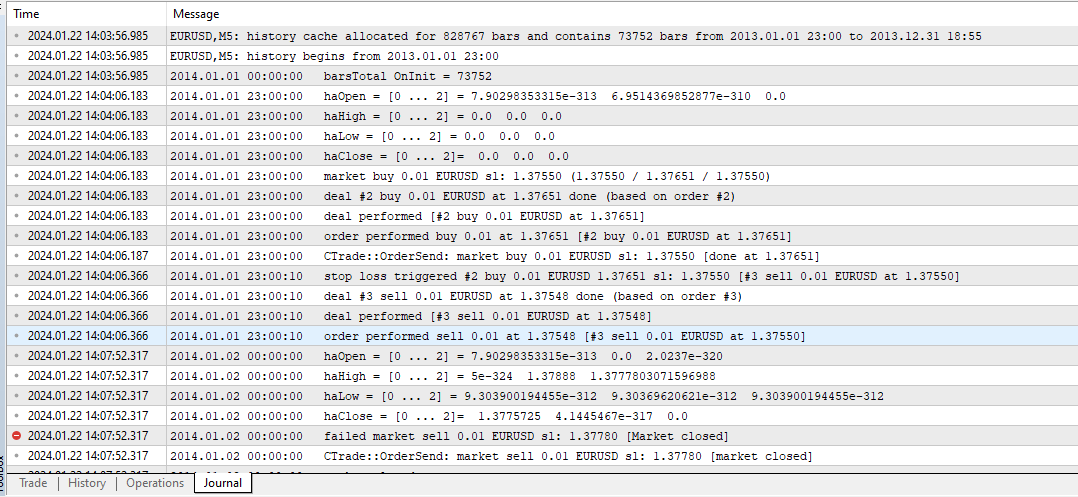
deal #1 can not be found in Journal tab.
deal # 2 buy 0.01 EURUSD sl: 1.3755 (1.3755 / 1.37651 / 1.37550)
deal performed ( #2 0.01 EURUSD at 1.37651 ), this is almost in the middle of the candle body, while I expect to open a Sell trade at Close for a bear candle or a buy at the close of a bull candle.
Short after that a Sell order is place in the middle of the buy order entry and candle close, see attachment.
I added the follow Print[] instruction to be able to read the arrays, but the result doesn't make any sense to me, see attachment .
double haOpen[BAR_COUNT],haHigh[BAR_COUNT],haLow[BAR_COUNT],haClose[BAR_COUNT];
Print("haOpen = [0 ... 2] = ",haOpen[0],"  ", haOpen[1], "  ", haOpen[2]);
Print("haHigh = [0 ... 2] = ",haHigh[0],"  ", haHigh[1], "  ", haHigh[2]);
Print("haLow = [0 ... 2] = ",haLow[0],"  ", haLow[1], "  ", haLow[2]);
Print("haClose = [0 ... 2]=  ",haClose[0],"  ", haClose[1], "  ", haClose[2]);
I really strongly believer in Heiken Ashi since it perfectly show the trend particular on Indexes US30, DE40 etc, Index trend prediction is 75 - 80 %, manual tested this with many Trading view graphs.
I really appreciate if you could help to find what is wrong with the code and provide the corrected version.
Velyke spasybi,
Richard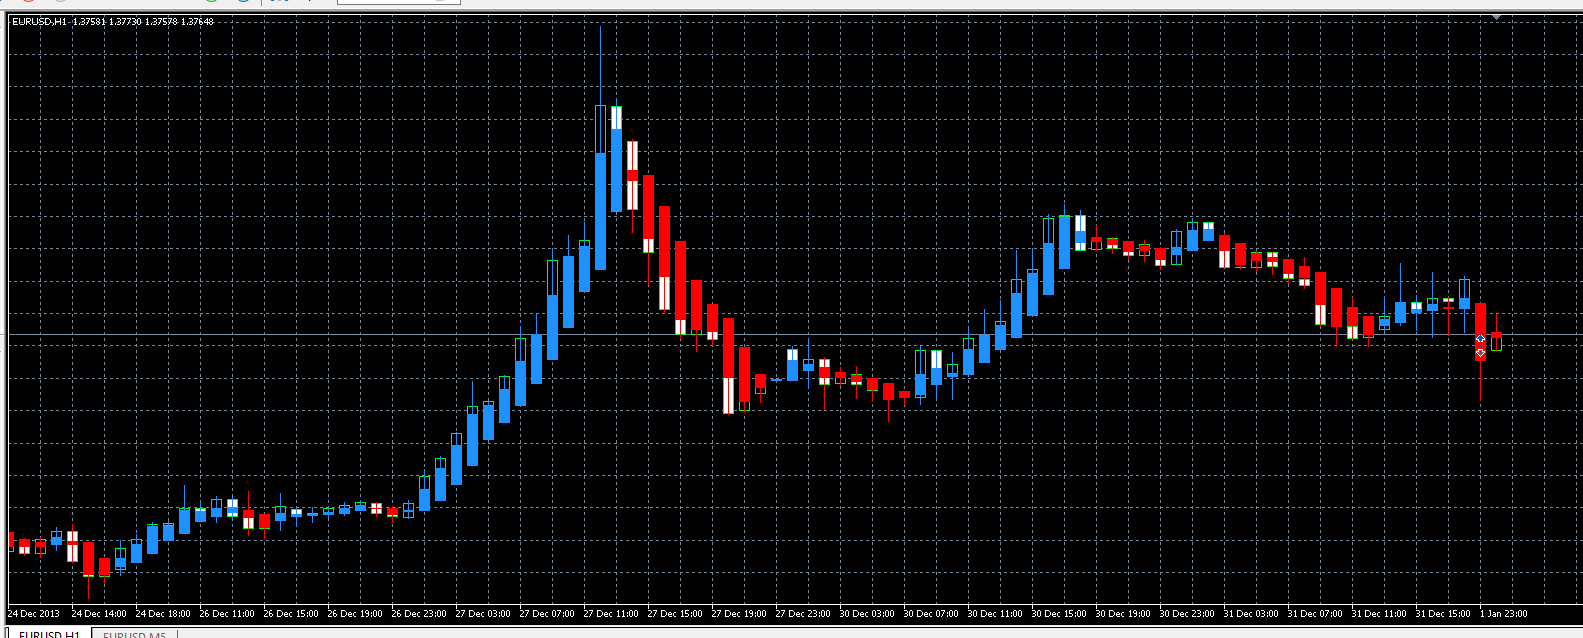
- Free trading apps
- Over 8,000 signals for copying
- Economic news for exploring financial markets
You agree to website policy and terms of use
New article An Example of a Trading System Based on a Heiken-Ashi Indicator is published:
In this article we look into the question of using a Heiken-Ashi indicator in trading. Based on this indicator, a simple trading system is considered and an MQL5 Expert Advisor is written. Trading operations are implemented on the bases of classes of the Standard class library. The testing results of the reviewed trading strategy, are based on the history, and obtained using the built-in MetaTrader 5 strategy tester, are provided in the article.
Author: Dmitry