
An Example of a Trading System Based on a Heiken-Ashi Indicator

Introduction
With the appearance of candlestick chart in the U.S., more than two decades ago, there was a revolution in the understanding of how the forces of bulls and bears work on the Western markets. Candlesticks became a popular trading instrument, and traders began working with them in order to ease the reading of the charts. But the interpretation of candlesticks differ from one another.
One of these methods, which changes the traditional candlestick chart, and facilitates its perception, is called the Heikin Ashi technology.
1. «Nani Desu Ka?»*
The first publication about this topic, appeared in 2004 in the February issue of the «Technical Analysis of STOCKS & COMMODITIES» journal, where Dan Valcu published an article entitled «Using The Heikin Ashi Technique» (link to the original article)
On his Website the author points out that during the summer of 2003 he studied the technology of Ichimoku, and as often happens, accidentally discovered a few diagrams, on which he saw a clearly visible trend of the market. It turned out to be a Heikin-Ashi diagram, or to be more precise, some altered candlesticks.
This method of analysis was developed by a Japanese trader who became very successful and uses this method to this day. To the surprise of the author, he found no other related information in books or the Internet, so he decided to make it available to all traders by publishing it in a journal.
The Heikin-Ashi method ( heikin in Japanese means the "middle" or the "balance", and ashi means "foot" or "bar"), and is a visual tool for assessing trends, their direction and strength. This is not a "Holy Grail" of trading, but it is definitely a good and easy-to-use instrument for visualizing trends.
Let's consider how the calculation of the OHLC candlestick value is performed:
Closure of the current bar: haClose = (Open + High + Low + Close) / 4
Opening of the current bar: haOpen = (haOpen [before.] + HaClose [before]) / 2
Maximum of the current bar: haHigh = Max (High, haOpen, haClose)
Minimum of the current bar: haLow = Min (Low, haOpen, haClose)
The values of "Open," "High," "Low" and "Close" are referring to the current bar. The prefix "ha" indicates the corresponding modified values of heikin-ashi.
To facilitate the perception of market information, the Heikin-Ashi technology modifies the traditional candlestick chart, by creating so-called synthetic candlesticks, which remove irregularity from the normal chart, offering a better picture of trends and consolidations. Just by looking at the candlestick chart, created using this method, you get a good overview of the market and its style:
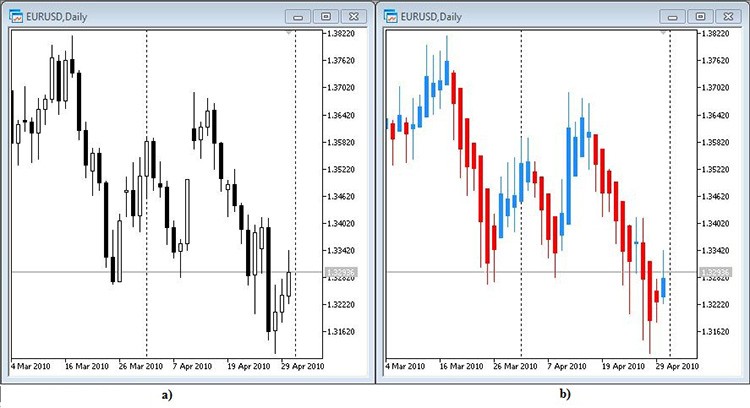
Figure 1. On the left is regular candlestick chart(a), on the right (b) Heikin-Ashi chart
Fig. 1 shows the difference between traditional Japanese candlesticks from Heiken Ashi candlesticks. The distinctive feature of these graphs is that in an upwards trend the majority of white candles have no shadow. In a downward trend there is no top shadow for the majority of black candles. Heiken Ashi chart show no breaks, so a new candle opens at the level of the previous one's middle.
The candlesticks on the Heiken-Ashi chart show a greater extent of trend indication than traditional candlesticks. When the trend weakens, the bodies of candlesticks are reduced, and the shadows grow. The change in the color of candlesticks is a signal to buy / sell. It is most convenient to determine the end of a corrective movement, based on these charts.
This indicator is a part of MetaTrader 5 and you can locate it in the folder «Indicators \\ Examples \\ Heiken_Ashi.mq5». Before installing the indicator onto the chart, I recommend making the graph linear. Also, in the properties of the graph, in the "General" tab, uncheck the item "from the top graph".
I would like to once again focus your attention on the fact that the Heiken-Ashi method is not a "Holy Grail". To prove this, I will try to create a simple trading system (TS) using only this technique.
To do this, we need to create a simple Expert Advisor, using the MQL5 programming language and standard library classes, and then test it on historical data, using the strategy tester of the MetaTrader 5 terminal.
2. Trading System Algorithm
Without making things too complex, we create the algorithm by using the six basic rules of the Heiken-Ashi procedure, proposed by Dan Valcu on the following site: http://www.educofin.com/
- An increasing trend - blue candlestick haClose> haOpen
- A decreasing trend - red candlestick haClose <haOpen
- A strong increasing trend - a blue candlestick, in which there is no Low haOpen == haLow
- A strong decreasing trend - a red candlestick, which is no High haOpen == haHigh
- Consolidation - a sequence of candlesticks with small bodies (of any color) and long shadows
- Change of trend - a candlestick with a small body and long shadows of the opposite color. It's not always a reliable signal, and sometimes can be just a part of consolidation (5).
A tendency of (1,2) is easy to understand - if we are in a transaction, we simply hold the position, moving the stop by 1-2 points below / above the previous candlestick.
A strong tendency (3,4) we acts the same way - by pulling up the stop.
Consolidation (5) and a change of trend (6), closes the position (if it is not closed by the stop), however we need to then decide whether or not to open an opposite position. To make the decision, we need to somehow determine whether a consolidation or a reversal is taking place. We will need a filter, built on indicators, candlestick analysis, or graphical analysis.
The objectives of our article does not include the establishment of a profitable strategy, but who knows what we will accomplish as a result. Therefore, let us consider that the appearance of a candle of the opposite color, we will close the position and open a new one with the opposite direction.
And so, our algorithm is as follows:
- After the formation of a candle of the opposite color, we close the previous position, if we have one, and open a positions at the opening of a new candle, setting a stop 2 points below/above the minimum/maximum of the previous candle.
- The trend - we move the stop 2 points below /above minimum/ maximum of the previous candle.
- With a strong trend, we take the same steps as we did with the trend, ie move the stop.
Overall, everything is quite simple, and hopefully clear to the reader. Now we will implement this on the language of MQL5.
3. Programming the Expert Advisor in MQL5
To create an Expert Advisor, we will need only one input parameter - the size of the lot, the two event handler functions OnInit (), OnTick (), and our own function CheckForOpenClose ().
To set the input parameters in MQL5 we use Input variables.
//--- input parameters
input double Lot=0.1;    // Port size
Function OnInit () is the event handler Init. Init events are generated immediately after loading the Expert Advisor.
In the code of this function we will connect the indicator to the Expert Advisor. As I mentioned above, the standard MetaTrader 5 includes a Heiken_Ashi.mq5 indicator.
You may wonder why there is so much complexity, if we have the formulas for calculating the indicator, and we can calculate the values in the code of the Expert Advisor. Yes, I admit, it is possible to do so, but if you look at one of them carefully:
haOpen=(haOpen[prev.]+haClose[prev])/2
you'll see that it uses the previous values, which creates a certain inconvenience to independent calculations and complicates our life. Therefore, instead of independent calculations, we will exploit the capabilities of MQL5 for connecting our custom indicator, specifically, the function iCustom.
To do this, we add to the body of the function OnInit () the following line:
hHeiken_Ashi=iCustom(NULL,PERIOD_CURRENT,"Examples\\Heiken_Ashi");
and we obtain a global variable hHeiken_Ashi - handle of the Heiken_Ashi.mq5,indicator, which we will need in the future.
The function OnTick () is the handler of the NewTick () event , which is generated with the appearance of a new tick.
//+------------------------------------------------------------------+
//| Expert tick function                                             |
//+------------------------------------------------------------------+
void OnTick()
  {
//--- check the ability of trading and the calculated number of bars
   if(TerminalInfoInteger(TERMINAL_TRADE_ALLOWED))
      if(BarsCalculated(hHeiken_Ashi)>100)
        {
         CheckForOpenClose();
        }
//---
  }
Function TerminalInfoInteger (TERMINAL_TRADE_ALLOWED) checks whether trading is permitted or not. Using the function BarsCalculated (HHeiken_Ashi), we check the amount of calculated data for the requested indicator, in our case Heiken_Ashi.mq5.
And if both conditions are met, we see the fulfillment of our function CheckForOpenClose () where the main work takes place. Let's look at it more carefully
Since the terms of our TS specify that the installation of orders take place at the opening of a new candlestick, we need to determine whether a new candlestick has opened or not. There are many ways to do this, but the simplest one is to check the volume of ticks. Thus, if the tick volume is equal to one, this indicates the opening of a new bar, and you should check the terms of TS and put out orders.
We implement it the following way:
//--- process the orders only after receiving the first tick of the new candlestick
   MqlRates rt[1];
   if(CopyRates(_Symbol,_Period,0,1,rt)!=1)
     {
      Print("CopyRates of ",_Symbol," failed, no history");
      return;
     }
   if(rt[0].tick_volume>1) return;
Create a variable array of the type MqlRates of the size of one element. Using the function CopyRates () obtain into it the values of the last bar. Then check the tick volume and if it is greater than one, terminate the function, if not, then continue the calculations.
Next, using the directive #define we declare a few mnemonic constants:
//--- to check the conditions we need the last three bars
#define  BAR_COUNT   3
//--- the number of indicator buffer for storage Open
#define  HA_OPEN     0
//--- the number of the indicator buffer for storage High
#define  HA_HIGH     1
//--- the number of indicator buffer for storage Low
#define  HA_LOW      2
//--- the number of indicator buffer for storage Close
#define  HA_CLOSE    3
Then we declare the array:
double haOpen[BAR_COUNT],haHigh[BAR_COUNT],haLow[BAR_COUNT],haClose[BAR_COUNT];
and using the function CopyBuffer () we obtain the values of the indicator in the appropriate arrays.
   if(CopyBuffer(hHeiken_Ashi,HA_OPEN,0,BAR_COUNT,haOpen)!=BAR_COUNT
      || CopyBuffer(hHeiken_Ashi,HA_HIGH,0,BAR_COUNT,haHigh)!=BAR_COUNT
      || CopyBuffer(hHeiken_Ashi,HA_LOW,0,BAR_COUNT,haLow)!=BAR_COUNT
      || CopyBuffer(hHeiken_Ashi,HA_CLOSE,0,BAR_COUNT,haClose)!=BAR_COUNT)
     {
      Print("CopyBuffer from Heiken_Ashi failed, no data");
      return;
     }
I want to focus your attention on how data is stored in the variables of the array.
The "oldest" (historically) bar is stored in the first element of the array (zero).
The "youngest" (current) bar in the latter, BAR_COUNT-1 (Fig. 2).

Figure 2. The order of the candlesticks and the values of the indexes of the array
And so we have obtained the OHLC Heiken-Ashi values, and it remains to verify the conditions for the opening or maintenance of a positions.
Consider in detail the processing of the sale signal .
As I pointed out before, we got the values of three Heiken-Ashi candlesticks. The current value is located In the cells with the number [BAR_COUNT-1 = 2], and it is not necessary to us. The previous values are in cells [BAR_COUNT-2 = 1], and earlier bars are in [BAR_COUNT-3 = 0] (see Fig. 2), and based on these two bars we will check the terms and conditions of making the trade.
Then we need to check for open positions on the instrument. To do this we will use the CPositionInfo class of trading classes of the default library. This class allows us to obtain information about open positions. Using the method Select (_Symbol) we determine the presence of open positions on our instrument, and if they are present, then using the method Type () we determine the type of open positions.
If at the current moment we have an open position to buy, then we need to close it.
To do this we use the methods of class CTrade of the standard class library, which is designed to perform trading operations.
Using the method PositionClose (const string symbol, ulong deviation) we will close the purchase, where the symbol is the name of the instrument, and the second parameter, deviation, is the permissible deviation of the closing price.
Then we check the combination of candlesticks according to our TS. Since we have already checked the direction of the newly formed candlesticks (with the index [BAR_COUNT-2]), we only need to check the candlestick prior to it (with index [BAR_COUNT-3]), and perform the steps, necessary to open the position.
     //--- check if there is an open position, and if there is, close it
      if(posinf.Select(_Symbol))
        {
         if(posinf.Type()==POSITION_TYPE_BUY)
           {
            //            lot=lot*2;
            trade.PositionClose(_Symbol,3);
           }
        }
      //--- check and set Stop Loss level
      double stop_loss=NormalizeDouble(haHigh[BAR_COUNT-2],_Digits)+_Point*2;
      double stop_level=SymbolInfoDouble(_Symbol,SYMBOL_ASK)+SymbolInfoInteger(_Symbol,SYMBOL_TRADE_STOPS_LEVEL)*_Point;
      if(stop_loss<stop_level) stop_loss=stop_level;
      //--- check the combination: the candle with the opposite color has formed
      if(haOpen[BAR_COUNT-3]<haClose[BAR_COUNT-3])
        {
         if(!trade.PositionOpen(_Symbol,ORDER_TYPE_SELL,lot,SymbolInfoDouble(_Symbol,SYMBOL_BID),stop_loss,0))
            Print(trade.ResultRetcodeDescription());
        }
      else
      if(posinf.Select(_Symbol))
        {
         if(!trade.PositionModify(_Symbol,stop_loss,0))
            Print(trade.ResultRetcodeDescription());
        }
Here it is necessary to turn your attention to the use of three methods of the CTrade class:
- Method PositionOpen (symbol, order_type, volume, price, sl, tp, comment) Used to open a position where symbol is the name of the instrument, order_type - order type, volume - the lot size, price - purchasing price, sl - Stop, tp - profit, comment - a comment.
- Method PositionModify (symbol, sl, tp) Used to change the value of the stop and profit, where symbol - the name of the instrument, sl - Stop, tp - profit. I would like to draw your attention to the fact that before using this method, you should check for the presence of an open position.
- The method ResultRetcodeDescription () is used for obtaining the description of the code error in the form of a line.
In calculating the variable stop_loss, the value of the haHigh [BAR_COUNT-2] is a calculation, received from the indicator, and needs normalization, done by the function NormalizeDouble (haHigh [BAR_COUNT-2], _Digits) in order to be used correctly.
This completes the processing of the signal to sell.
To buy we use the same principle.
Here is the complete code of the Expert Advisor:
//+------------------------------------------------------------------+
//|                                           Heiken_Ashi_Expert.mq5 |
//|                                               Copyright VDV Soft |
//|                                                 vdv_2001@mail.ru |
//+------------------------------------------------------------------+
#property copyright "VDV Soft"
#property link      "vdv_2001@mail.ru"
#property version   "1.00"

#include <Trade\AccountInfo.mqh>
#include <Trade\PositionInfo.mqh>
#include <Trade\Trade.mqh>

//--- the list of global variables
//--- input parameters
input double Lot=0.1;    // Lot size
//--- indicator handles
int      hHeiken_Ashi;
//+------------------------------------------------------------------+
//| Expert initialization function                                   |
//+------------------------------------------------------------------+
int OnInit()
  {
//---
   hHeiken_Ashi=iCustom(NULL,PERIOD_CURRENT,"Examples\\Heiken_Ashi");
//---
   return(0);
  }
//+------------------------------------------------------------------+
//| Expert tick function                                             |
//+------------------------------------------------------------------+
void OnTick()
  {
//--- trading should be allowed and number of bars calculated>100
   if(TerminalInfoInteger(TERMINAL_TRADE_ALLOWED))
      if(BarsCalculated(hHeiken_Ashi)>100)
        {
         CheckForOpenClose();
        }
//---
  }
//+------------------------------------------------------------------+
//| Checking of the position opening conditions                      |
//+------------------------------------------------------------------+
void CheckForOpenClose()
  {
//--- process orders only when new bar is formed
   MqlRates rt[1];
   if(CopyRates(_Symbol,_Period,0,1,rt)!=1)
     {
      Print("CopyRates of ",_Symbol," failed, no history");
      return;
     }
   if(rt[0].tick_volume>1) return;

//--- to check the conditions we need the last three bars
#define  BAR_COUNT   3
//--- number of the indicator buffer for storage Open
#define  HA_OPEN     0
//--- number of the indicator buffer for storage High
#define  HA_HIGH     1
//--- number of the indicator buffer for storage Low
#define  HA_LOW      2
//--- number of the indicator buffer for storage Close
#define  HA_CLOSE    3

   double   haOpen[BAR_COUNT],haHigh[BAR_COUNT],haLow[BAR_COUNT],haClose[BAR_COUNT];

   if(CopyBuffer(hHeiken_Ashi,HA_OPEN,0,BAR_COUNT,haOpen)!=BAR_COUNT
      || CopyBuffer(hHeiken_Ashi,HA_HIGH,0,BAR_COUNT,haHigh)!=BAR_COUNT
      || CopyBuffer(hHeiken_Ashi,HA_LOW,0,BAR_COUNT,haLow)!=BAR_COUNT
      || CopyBuffer(hHeiken_Ashi,HA_CLOSE,0,BAR_COUNT,haClose)!=BAR_COUNT)
     {
      Print("CopyBuffer from Heiken_Ashi failed, no data");
      return;
     }
//---- check sell signals
   if(haOpen[BAR_COUNT-2]>haClose[BAR_COUNT-2])// bear candlestick
     {
      CPositionInfo posinf;
      CTrade trade;
      double lot=Lot;
     //--- check if there is an open position, and if there is, close it
      if(posinf.Select(_Symbol))
        {
         if(posinf.Type()==POSITION_TYPE_BUY)
           {
            //            lot=lot*2;
            trade.PositionClose(_Symbol,3);
           }
        }
      //--- check and set Stop Loss level
      double stop_loss=NormalizeDouble(haHigh[BAR_COUNT-2],_Digits)+_Point*2;
      double stop_level=SymbolInfoDouble(_Symbol,SYMBOL_ASK)+SymbolInfoInteger(_Symbol,SYMBOL_TRADE_STOPS_LEVEL)*_Point;
      if(stop_loss<stop_level) stop_loss=stop_level;
      //--- check the combination: the candle with the opposite color has formed
      if(haOpen[BAR_COUNT-3]<haClose[BAR_COUNT-3])
        {
         if(!trade.PositionOpen(_Symbol,ORDER_TYPE_SELL,lot,SymbolInfoDouble(_Symbol,SYMBOL_BID),stop_loss,0))
            Print(trade.ResultRetcodeDescription());
        }
      else
      if(posinf.Select(_Symbol))
        {
         if(!trade.PositionModify(_Symbol,stop_loss,0))
            Print(trade.ResultRetcodeDescription());
        }
     }
//---- check buy signals
   if(haOpen[BAR_COUNT-2]<haClose[BAR_COUNT-2]) // bull candle
     {
      CPositionInfo posinf;
      CTrade trade;
      double lot=Lot;
     //--- check if there is an open position, and if there is, close it
      if(posinf.Select(_Symbol))
        {
         if(posinf.Type()==POSITION_TYPE_SELL)
           {
            //            lot=lot*2;
            trade.PositionClose(_Symbol,3);
           }
        }
      //--- check and set Stop Loss level
      double stop_loss=NormalizeDouble(haLow[BAR_COUNT-2],_Digits)-_Point*2;
      double stop_level=SymbolInfoDouble(_Symbol,SYMBOL_BID)-SymbolInfoInteger(_Symbol,SYMBOL_TRADE_STOPS_LEVEL)*_Point;
      if(stop_loss>stop_level) stop_loss=stop_level;
      //--- check the combination: the candle with the opposite color has formed
      if(haOpen[BAR_COUNT-3]>haClose[BAR_COUNT-3])
        {
         if(!trade.PositionOpen(_Symbol,ORDER_TYPE_BUY,lot,SymbolInfoDouble(_Symbol,SYMBOL_ASK),stop_loss,0))
            Print(trade.ResultRetcodeDescription());
        }
      else
      if(posinf.Select(_Symbol))
        {
         if(!trade.PositionModify(_Symbol,stop_loss,0))
            Print(trade.ResultRetcodeDescription());
        }

     }
  }
//+------------------------------------------------------------------+
The complete text of the Expert Advisor can be found in the attached file Heiken_Ashi_Expert.mq5. Copy it to the catalog .. \\ MQL5 \\ Experts, then run MetaEditor through the menu "Tools -> Editor MetaQuotes Language», or use the «F4» key. Next in the "Navigator" window, open the tab «Experts», and download the file Heiken_Ashi_Expert.mq5, by double clicking on it, into the edit window and compile it by pressing «F7».
If all of the operations were performed correctly, then in the tab "Expert Advisors", in the "Navigator" window the file Heiken_Ashi_Expert will be crated. The Heiken_Ashi.mq5 indicator must be compiled in the same way, it is located in the catalog \\ MQL5 \\ Indicators \\ Examples \\.
4. Testing the trading system on historical data
To check the viability of our trading system, we will use the MetaTrader 5 strategy tester, which is a part of the trading platform. The tester is run through the terminal menu "View -> Strategy Tester " or by pressing the key combination « Ctrl + R ». Once it is launched, we locate the "Settings" tab (Figure 3).

Figure 3. Strategy Tester settings
Configuring the Expert Advisor - choose from a list of our Expert Advisors, indicate the testing interval as the beginning of 2000 through the end of 2009, the amount of initial deposit is 10,000 USD, disable the optimization (since we have only one input parameter, and we just want to check the viability of the TS).
Testing will be done using two currency pairs. I decided to choose the currency pairs EURUSD and GBPUSD.
For testing, I decided to take the following time intervals: H3, H6 and H12. You will ask why? The answer is because I wanted to test the TS on time intervals, which were not present in the MetaTrader4 terminal.
So here we go. We select the testing currency EURUSD, the testing period H3, and click "Start". Upon completion of testing, we see two new tabs in the tester window: "Results" (Fig. 4) and "Graph" (Fig. 5).

Figure 4. The Results strategy testing EURUSD H3
From the test results (Fig. 4) You can see that for the period from early 2000 to late 2009, with the given parameters, the TS yielded a loss of $ -2560,60 USD.
The graph (Fig. 5) shows the distribution of profits and losses over time, which gives us the opportunity to review the performance of TS throughout time, and make an analysis of system errors.
")
Figure 5. "Graph" tab of the Strategy Tester (EURUSD H3)
I almost forgot to mention that the tab "Results", by default, creates a simple report. In addition, we have the ability to view transactions, orders, and written file reports.
To do this, we simply place the cursor over the tab, click the right mouse button, and select the appropriate menu item:

Figure 6. Context menu of the Strategy Tester Results tab
Here is the results of testing on over a six-hour period (H6):
")
Figure 7. Strategy Tester Results tab (EURUSD H6)
over a twelve-hour period (H12).
")
Figure 8. Strategy Tester Results tab (EURUSD H12)
It seems that on the currency pair, such as EURUSD, our strategy is not effective. But we can notice that the variation of the working period significantly affects the result.
We extend our test to the currency pair GBPUSD, in order to make final conclusions about the efficiency of our TS.
")
Figure 9. Strategy Tester Results tab (GBPUSD H3)
")
Figure 10. Strategy Tester Results tab (GBPUSD H6)
")
Figure 11. Strategy Tester Results tab (GBPUSD H12)
")
Figure 12. Strategy Tester Graph tab (GBPUSD H12)
After analyzing the test results, we see that using a currency pair, such as GBPUSD, our system demonstrated positive results in two separate cases. Over a twelve-hour period, we received a considerable profit of 8903,23 USD, although it was received over nine years.
Those who are interested can test other currency pairs. My assumption is that the more volatile the pair is, the better result should be obtained, and the longer time period should be used.
Conclusion
In conclusion, I emphasize, that this trading system is not the "Holy Grail" and can not be used on its own.
However, if with additional signals (candlestick analysis, wave analysis, indicators, trends) we separate the reversal signals from the consolidation signals, then on some volatile trading instruments, it can be quite viable, though unlikely to bring a "crazy" profit.
__________________________________
* "Nani Desu Ka?" - What is this? (Japanese)
Translated from Russian by MetaQuotes Ltd.
Original article: https://www.mql5.com/ru/articles/91
 Guide to writing a DLL for MQL5 in Delphi
 Using WinInet.dll for Data Exchange between Terminals via the Internet
 A DLL-free solution to communicate between MetaTrader 5 terminals using Named Pipes
 Research of Statistical Recurrences of Candle Directions
- Free trading apps
- Over 8,000 signals for copying
- Economic news for exploring financial markets
You agree to website policy and terms of use
Hello,
I ran the test on EURUSD from the beginnign of the year but the results are not consistent with the indicatore, i.e. there are wrong arrows on the chart, buying on short bars and viceversa.
Which could be the problem?
thanks
Hi, i red this article and i found it very interesting. first of all thanks, second is it possible to have it translated for MT4 ?
Thanks in advance
Dear Dmitry, this is really great, well explained, enormous contribution to MQL5 community, unfortunately I can't follow everything you explained, that is more from my side than yours, that's how my brains are wired, I can understand say 70% rest is magic to me.
However, something is wrong with the code.
I ran a test from 2014.01.01 till 2024.01.19. EURUSD, H1, 1.000,00 EUR.
Right from the bat at the first candle it goes wrong.
The first candle 2014.01.01 23:00 Open 1.37550 High 1.37648, Low 1.37372, Close 1.37580.
The graph show a red candle and it should be a blue candle.
deal #1 can not be found in Journal tab.
deal # 2 buy 0.01 EURUSD sl: 1.3755 (1.3755 / 1.37651 / 1.37550)
deal performed ( #2 0.01 EURUSD at 1.37651 ), this is almost in the middle of the candle body, while I expect to open a Sell trade at Close for a bear candle or a buy at the close of a bull candle.
Short after that a Sell order is place in the middle of the buy order entry and candle close, see attachment.
I added the follow Print[] instruction to be able to read the arrays, but the result doesn't make any sense to me, see attachment .
I really strongly believer in Heiken Ashi since it perfectly show the trend particular on Indexes US30, DE40 etc, Index trend prediction is 75 - 80 %, manual tested this with many Trading view graphs.
I really appreciate if you could help to find what is wrong with the code and provide the corrected version.
Velyke spasybi,
Richard