TradeighT
- Indikatoren
- Lorenzo Monari
- Version: 31.48
- Aktualisiert: 9 Mai 2024
- Aktivierungen: 5
⭐ Das Tool identifiziert die reale Marktbewegung mit mathematischen Berechnungen auf der Grundlage der Preisänderungen.
⭐ Die Ausführung von TradeighT basiert auf dieser mathematischen Beziehung, die schon immer existiert hat.
⭐ Die meisten Investoren schauen auf die gleichen Indikatoren und benutzen die gleichen Informationen, weshalb die Mehrheit Geld verliert.
⭐ Es handelt sich um ein Produkt, das nicht auf den Ideen der Mehrheit basiert, sondern auf den 4 realen Grundlagen, die den Markt bestimmen.
⭐ Ist ein visuelles, leicht zu verstehendes und einfach zu bedienendes Tool, das für alle Symbole, für die einen Backtest durchgeführt werden kann, verfügbar ist.
Nur für MT4.
Der Indikator nutzt hohe Reaktionspreise:
☆ liefert aktuelle Take-Profit-Preise
☆ liefert Niveaus für die technische Analyse
☆ liefert den ZigZag-Indikator
☆ liefert den aktuellen Trend
☆ identifiziert Ziele mit hoher Erfolgswahrscheinlichkeit
________________________________________________________________________________________________________________________________________________
TRENDLINE (wählbar)
HORIZONTALE NICHT PERMANENTE BUY-TRENDLINIE
- nummeriert von 1 bis 5
- Farbe unter INDIKATOR-EIGENSCHAFTEN änderbar
- Preis, der als Take-Profit in einem BUY-Order zu verwenden ist
HORIZONTALE NICHT PERMANENTE SELL-TRENDLINIE
- nummeriert von 1 bis 5
- Farbe unter INDIKATOR-EIGENSCHAFTEN änderbar
- Preis, der als Take-Profit in einem SELL-Order zu verwenden ist
HORIZONTALE PERMANENTE TRENDLINIE
-
als Unterstützung oder Widerstand zu verwenden
VERTIKALE TRENDLINIE
-
zur Verwendung als Zeitreferenz für den Start einer HORIZONTALEN NICHT PERMANENTEN TRENDLINIE
________________________________________________________________________________________________________________________________________________
ALLGEMEINE METRIK
Jede ZAHL ist mit einer Kerze verbunden.
Jede ZAHL hat ihre eigene HORIZONTALE NICHT PERMANENTE TRENDLINIE.
Jede HORIZONTALE NICHT PERMANENTE TRENDLINIE hat eine eigene VERTIKALE TRENDLINIE.
Wenn die HORIZONTALE NICHT PERMANENTE TRENDLINIE vom Kurs berührt wird, verschwindet sie.
Wenn eine HORIZONTALE NICHT PERMANENTE TRENDLINIE verschwindet, verschwinden auch die ZAHL und die VERTIKALE TRENDLINIE, die mit dieser HORIZONTALEN NICHT PERMANENTEN TRENDLINIE verbunden sind.
Wenn eine HORIZONTALE NICHT PERMANENTE TRENDLINIE verschwindet, bevor sie vom Kurs berührt wird, erscheint eine neue HORIZONTALE NICHT PERMANENTE TRENDLINIE mit der nächsten ZAHL in entgegengesetzter Richtung.
________________________________________________________________________________________________________________________________________________
VERTIKALE LINIEN
VERTIKALE BUY-LINIE
- Farbe der HORIZONTALEN NICHT PERMANENTEN BUY-TRENDLINIE
- zeigt einen TREND BUY
VERTIKALE SELL-LINIE
- Farbe der HORIZONTALEN NICHT PERMANENTEN SELL-TRENDLINIE
- zeigt einen TREND SELL
________________________________________________________________________________________________________________________________________________
OPERATIVITÄT
Das Tool liefert alle notwendigen Informationen, um künftige Kursbewegungen mit äußerster Präzision zu identifizieren,
und bietet die Möglichkeit, den Verlauf für Recherche und Statistik zu analysieren.
Außerdem liefert das Tool sämtliche Details, die für eine vollständige Analyse erforderlich sind, und generiert Signale mit einer hohen Erfolgsquote.
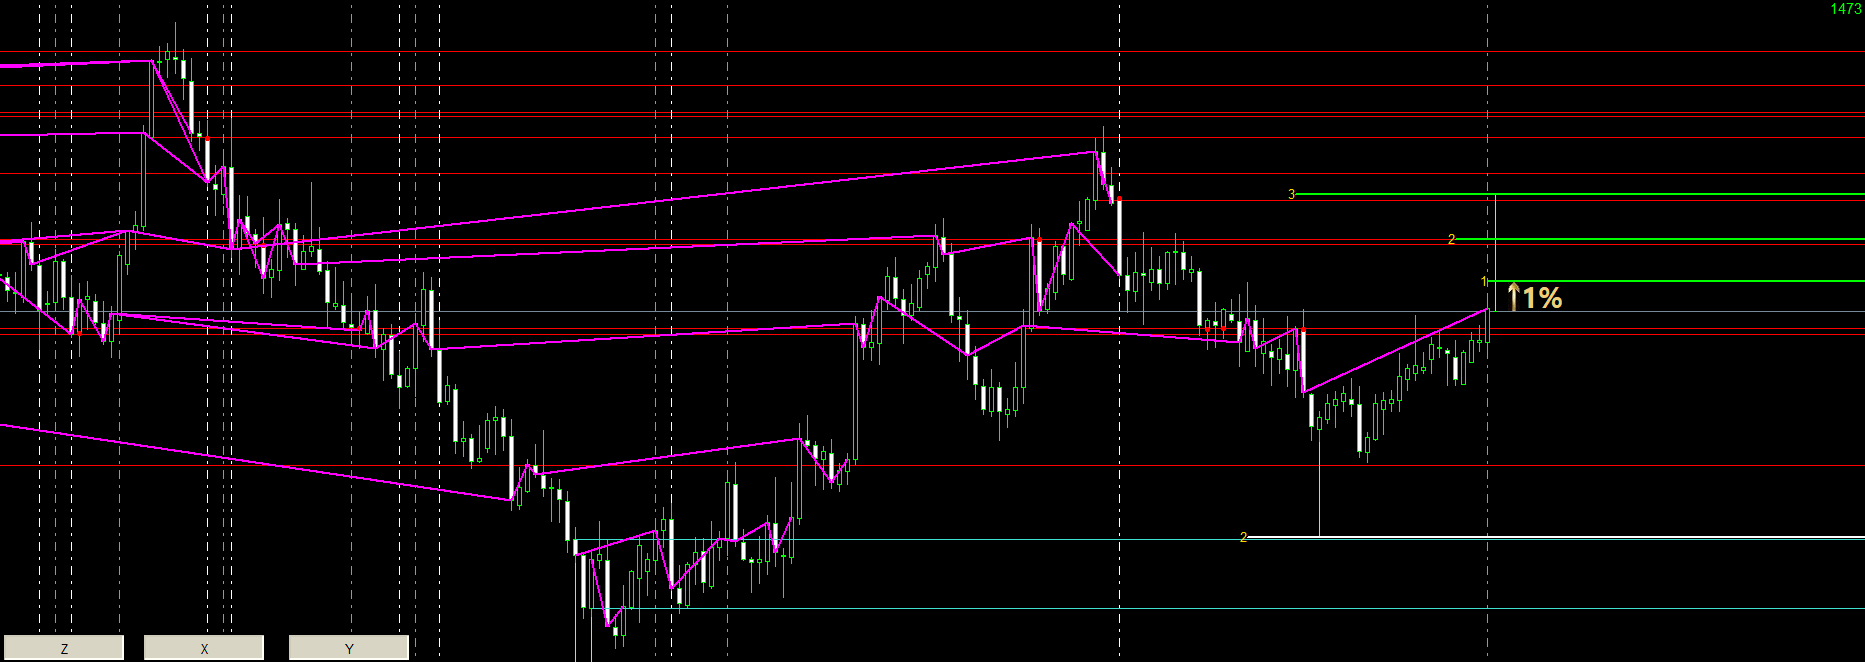
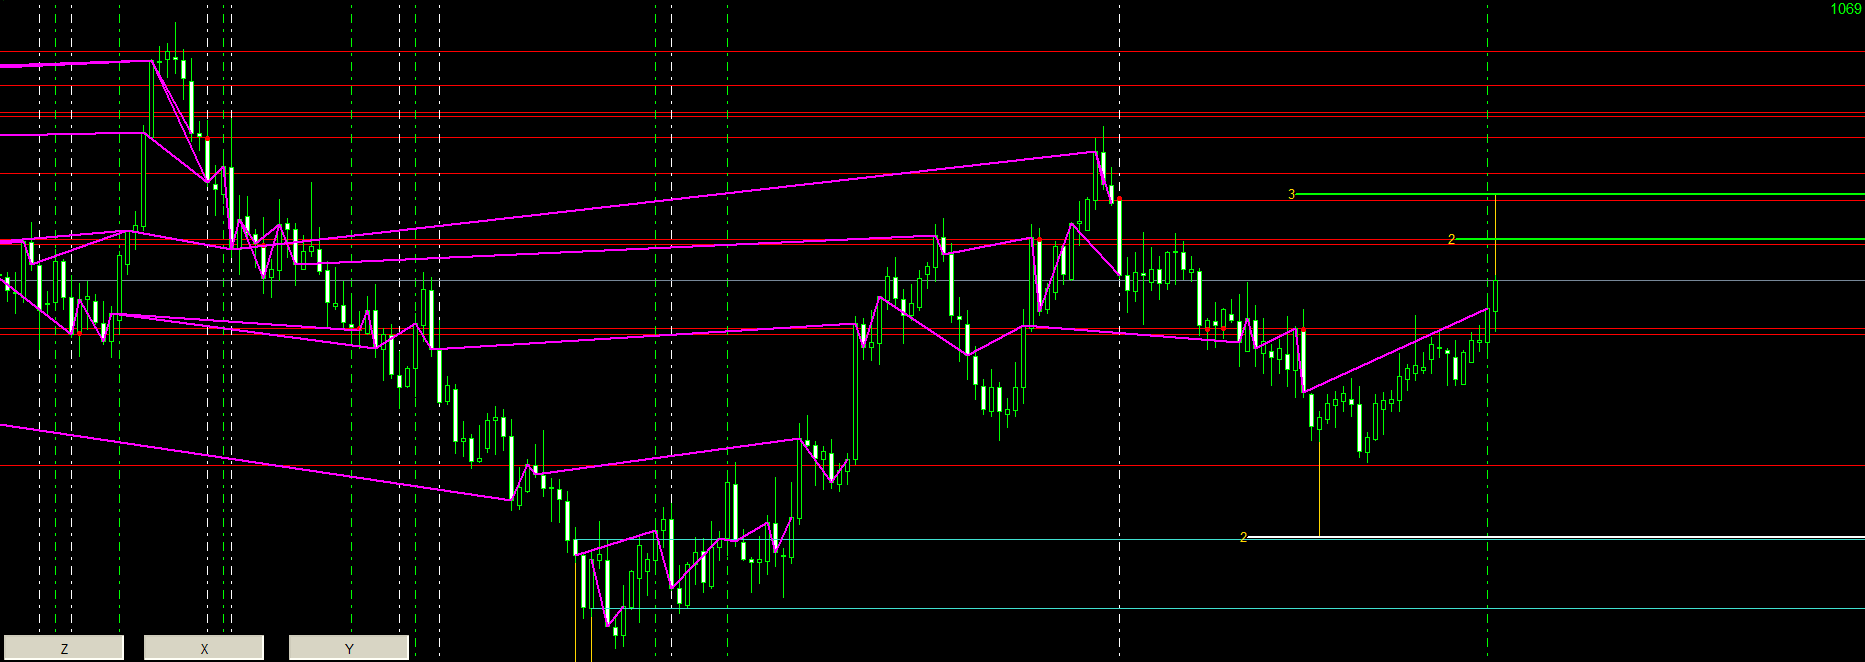
BUY-SIGNAL
Wenn die vorletzte Kerze die VERTIKALE BUY-LINIE aufweist,
TP1 BUY-SIGNAL bzw. die HORIZONTALE NICHT PERMANENTE BUY-TRENDLINIE 1 (TP1) mit der ZAHL verwenden, die von der VERTIKALEN BUY-LINIE markiert ist.
Das Investitionsvolumen entsprechend der Bewegungsgröße berechnen, damit der Geldwert der Bewegung 1 % des Kapitalwertes entspricht.
Beispiel in den Abbildungen.
Wenn das TP1 BUY-SIGNAL verschwindet, bevor es vom Kurs berührt wird, bitte eine der folgenen Optionen auswählen:
- die Richtung der Investition ändern und TP2 als neues Ziel verwenden
- die Serie unterbrechen und auf ein neues TP1 SIGNAL warten
- die Investition beenden
- den Verlust des TP1 BUY-SIGNALS mit den nachfolgenden TPs dieser Kerze (TP2,TP3..) auszugleichen
- den Verlust des TP1 BUY-SIGNALS mit dem nachfolgenden TP1 SIGNAL auszugleichen
- den Verlust zu akzeptieren
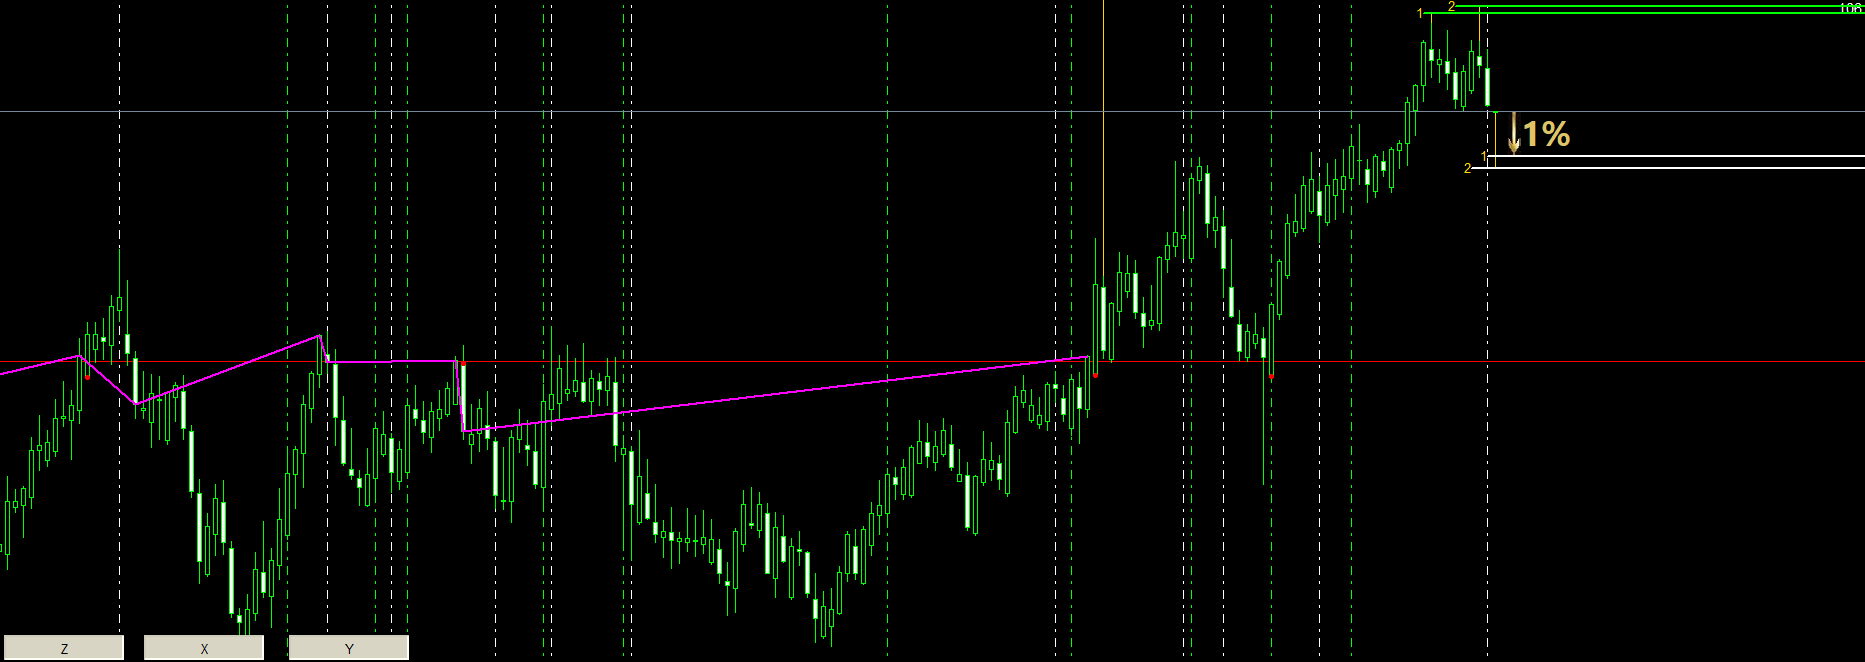
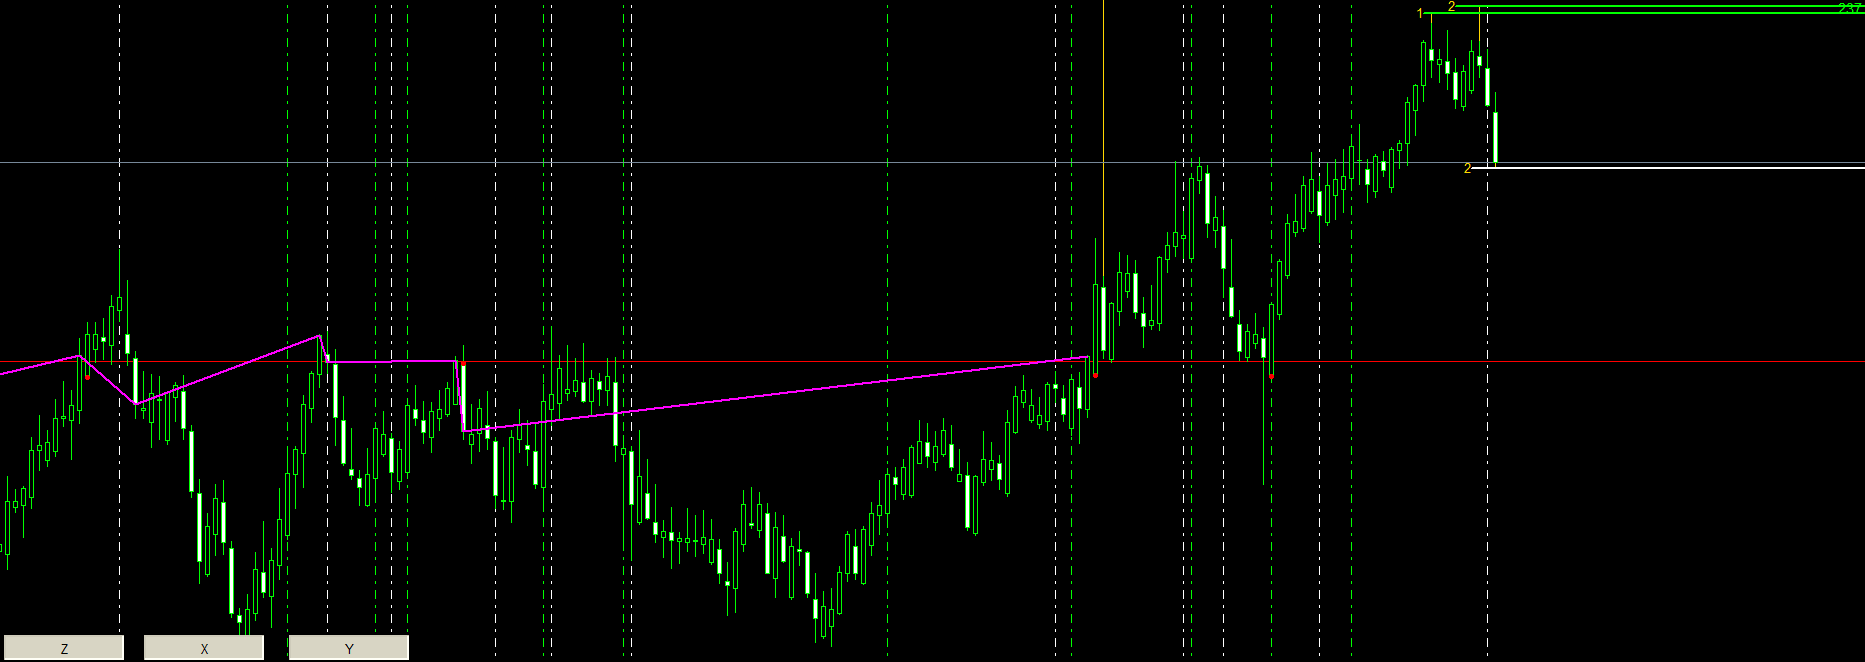
SELL-SIGNAL
Wenn die vorletzte Kerze die VERTIKALE SELL-LINIE aufweist,
TP1 SELL-SIGNAL bzw. die HORIZONTALE NICHT PERMANENTE SELL-TRENDLINIE 1 (TP1) mit der ZAHL verwenden, die von der VERTIKALEN SELL-LINIE markiert ist.
Das Investitionsvolumen entsprechend der Bewegungsgröße berechnen, damit der Geldwert der Bewegung 1 % des Kapitalwertes entspricht.
Beispiel in den Abbildungen.
Wenn das TP1 SELL-SIGNAL verschwindet, bevor es vom Kurs berührt wird, bitte eine der folgenen Optionen auswählen:
- die Richtung der Investition ändern und TP2 als neues Ziel verwenden
- die Serie unterbrechen und auf ein neues TP1 SIGNAL warten
- die Investition beenden
- den Verlust des TP1 SELL-SIGNALS mit den nachfolgenden TPs dieser Kerze (TP2,TP3..) auszugleichen
- den Verlust des TP1 SELL-SIGNALS mit dem nachfolgenden TP1 SIGNAL auszugleichen
- den Verlust zu akzeptieren
_______________________________________________________________________________________________________________________________________________
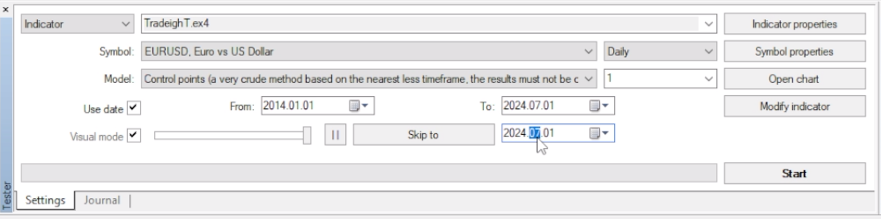
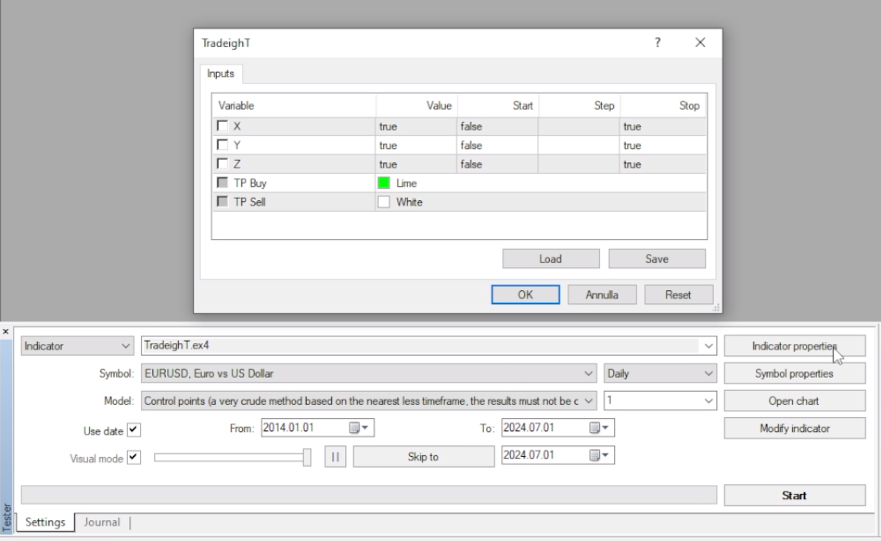
EINSTELLUNGEN
Es besteht die Möglichkeit, Objekte zu aktivieren und deaktivieren: vor dem Backtest über INDIKATOR-EIGENSCHAFTEN, nach und während des Backtests über die TASTEN im Chart:
-
X = HORIZONTALE PERMANENTE TRENLINIEN
-
Y = VERTIKALE TRENLINIEN
-
Z = ZIGZAG-INDIKATOR
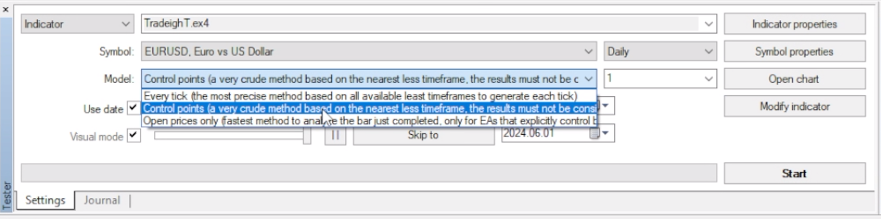
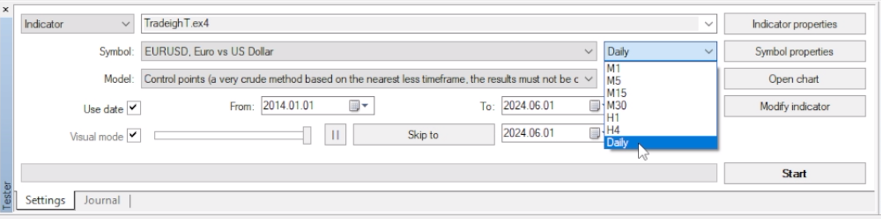
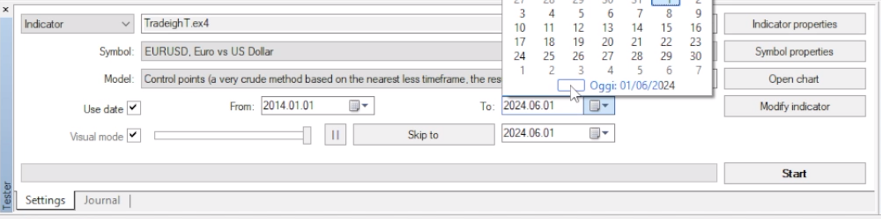
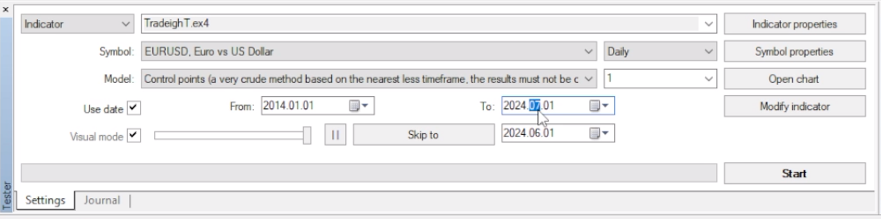
-(1)- Um eine vollständige Analyse durchzuführen, als Startdatum des Backtests ein Datum verwenden, das 10 Jahre vor dem aktuellen Datum liegt.
-(2)- Zum aktuellen Datum einen Monat hinzufügen und es als Enddatum des Backtests verwenden.
-(3)- Um den Backtest zu beschleunigen, die Taste SPRINGEN ZU drücken und das Datum eingeben, das dem Enddatum des Backtests entspricht.
Für weitere Details siehe Abbildungen.
________________________________________________________________________________________________________________________________________________
🛎️ https://t.me/tradeightrading
Um sich mit anderen Nutzern über Meinungen und Analysen auszutauschen, bitte den Zugriff auf die private Telegram-Gruppe anfordern.
Der Benutzer hat keinen Kommentar hinterlassen