TradeighT
- インディケータ
- Lorenzo Monari
- バージョン: 31.48
- アップデート済み: 9 5月 2024
- アクティベーション: 5
⭐ このツールは、価格変動に基づいた数学的計算により、市場で利用されている実際の動きを導き出します。
⭐ TradeighTは、常に存在する数学的関係に基づいて実行されます。
⭐ ほとんどの投資家が同じものを見て、同じ情報を研究しています、だからこそ、大多数の投資家が損をすることになります。
⭐ このツールは、多数派の意見ではなく、市場における4つ真の基盤に基づいています。
⭐ このツールは、視覚的なツールであり、理解しやすく、使うのが簡単で、シンボルを分析するバックテスト機能付きです。
MT4専用です。
このインジケーターは、高反応の価格水準を用いて
☆ 現在のテイクプロフィットの価格を提供します
☆ テクニカル分析に使用される価格水準を提供します
☆ ジグザグインジケーターを提供します
☆ 現在のトレンドを提供します
☆ 成功率の高いターゲットを提供します
________________________________________________________________________________________________________________________________________________
トレンドライン (選択可)
横軸ノンパーマネントトレンドラインの買い
- 1から5までの番号が振られています
- インジケータープロパティから色の編集が可能です
- 価格は、買い注文でテイクプロフィットとして使用されます
横軸ノンパーマネントトレンドラインの売り
- 1から5までの番号が振られています
- インジケータープロパティから色の編集が可能です
- 価格は、売り注文でテイクプロフィットとして使用されます
横軸パーマネントトレンドライン
- 支持線(サポートライン)または抵抗線(レジスタンスライン)として使用されます
縦軸トレンドライン
- 横軸ノンパーマネントトレンドライン開始にあたっての時間的基準として使用されます
機能の概要
各番号は、ローソク足にリンクしています。
各番号には、それぞれの横軸ノンパーマネントトレンドラインがあります。
各横軸ノンパーマネントトレンドライン"には、それぞれの縦軸トレンドラインがあります。
価格が横軸ノンパーマネントトレンドラインに触れると、横軸ノンパーマネントトレンドラインは消えます。
横軸ノンパーマネントトレンドラインが消えると、その横軸ノンパーマネントトレンドラインに紐づいた番号と縦軸トレンドラインも消えます。
価格が横軸ノンパーマネントトレンドラインに触れると、横軸ノンパーマネントトレンドラインは消えて、次の番号を持つ新しい横軸ノンパーマネントトレンドラインが反対方向に現れます。
________________________________________________________________________________________________________________________________________________
縦軸線
縦軸線の買い
- 横軸ノンパーマネントトレンドラインの買いの色
- 買いトレンドを表します
縦軸線の売り
- 横軸ノンパーマネントトレンドラインの売りの色
- 売りトレンドを表します
________________________________________________________________________________________________________________________________________________
操作性
このツールは、将来の価格変動を正確に予測するのに必要なすべての情報を提供します。
過去の情報を研究、分析することができます。
このツールは、完全な分析に必要なあらゆる詳細情報を提供するだけでなく、このツールは高い成功率でシグナルも提供します。
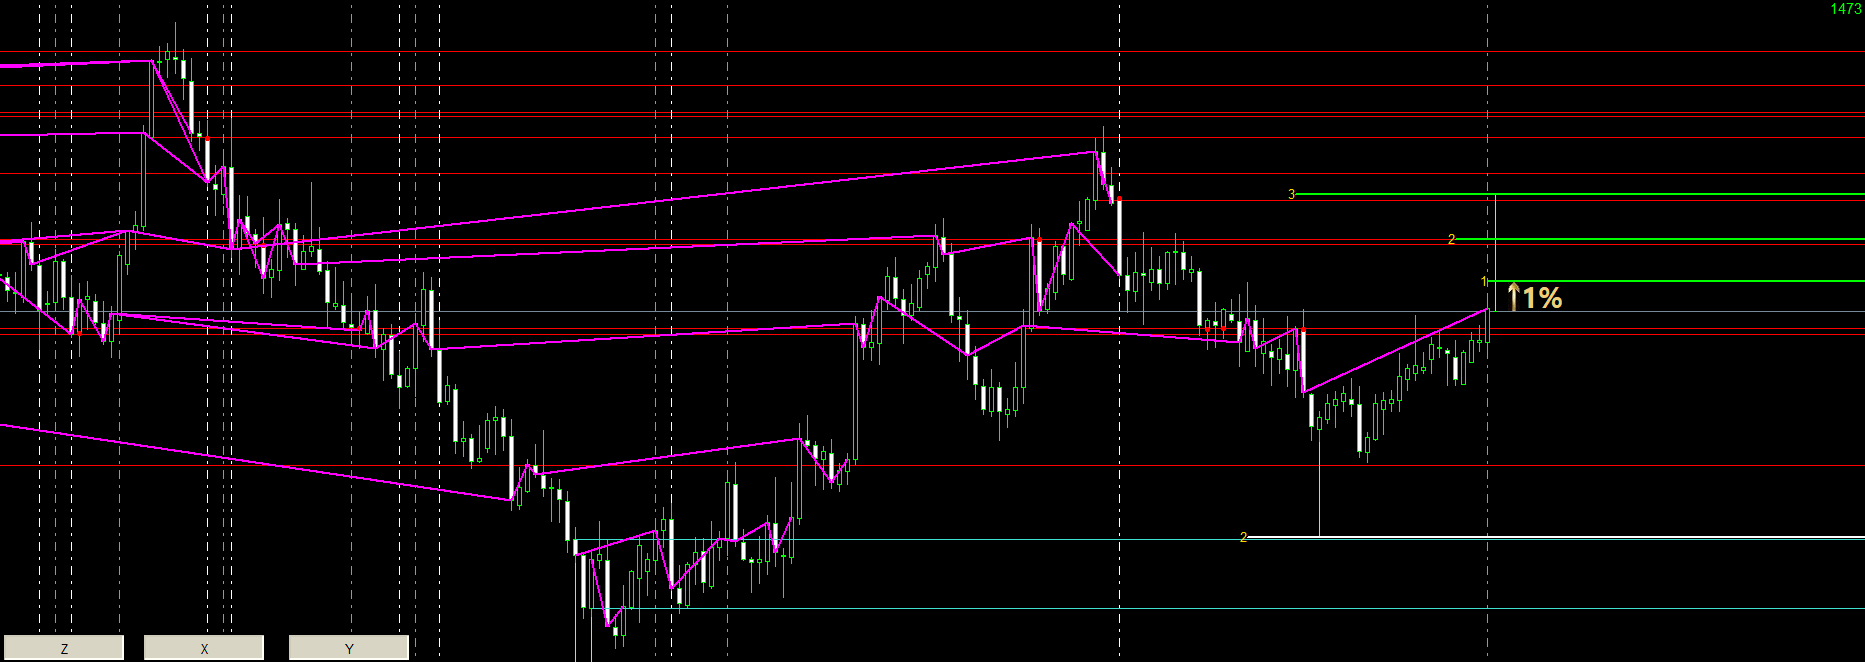
シグナル買い
現在のローソク足の前のローソク足に縦軸線の買いがある場合
TP1シグナル買いをターゲットとして使用します、これは横軸ノンパーマネントトレンドライン買い1(TP1)であり、縦軸線の買いによって番号が明らかにされています。
移動範囲に基づく投資量の算出、動きの金融価値は、資金の1%。
イラストの例
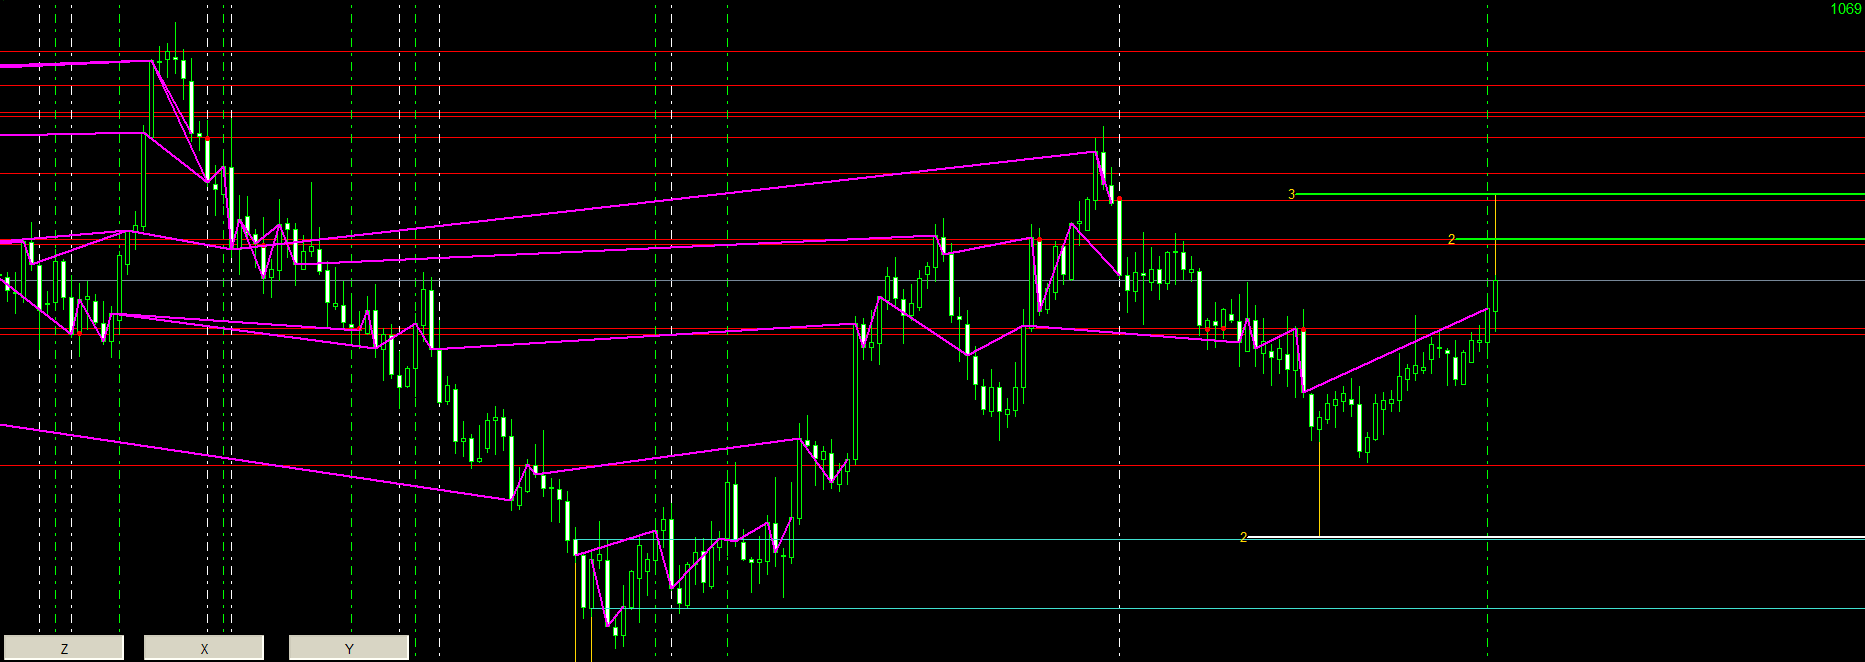
もしTP1シグナル買いが消えた場合、以下の選択肢があります
- 投資の方向を変え、TP2を新たなターゲットとして使用する
- 一連の投資を中断し、新たなTP1シグナルを待つ
- 投資を閉じる
資金管理は重要な役割を果たします投資家には、以下の選択肢があります
- TP1シグナル買いの損失を、同じローソク足の後続TP(TP2,TP3)で取り返します
- TP1シグナル買いの損失を、その後のTP1シグナルで取り返します
- 損失を受け入れる
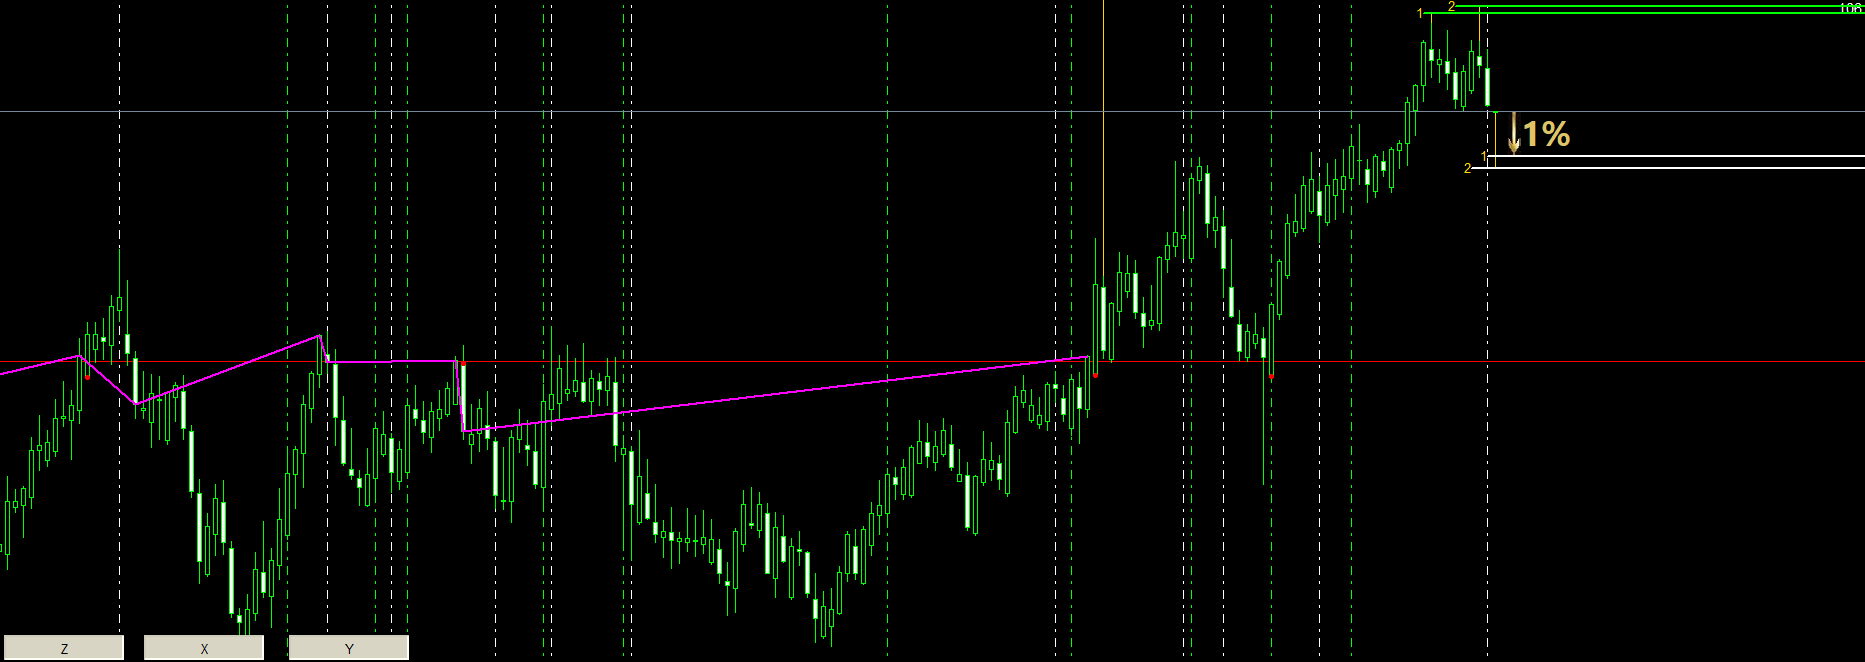
シグナル売り
現在のローソク足の前のローソク足に縦軸線の売りがある場合
TP1シグナル売りをターゲットとして使用します、これは横軸ノンパーマネントトレンドライン売り1(TP1)であり、縦軸線の売りによって番号が明らかにされています。
移動範囲に基づく投資量の算出、動きの金融価値は、資金の1%。
イラストの例
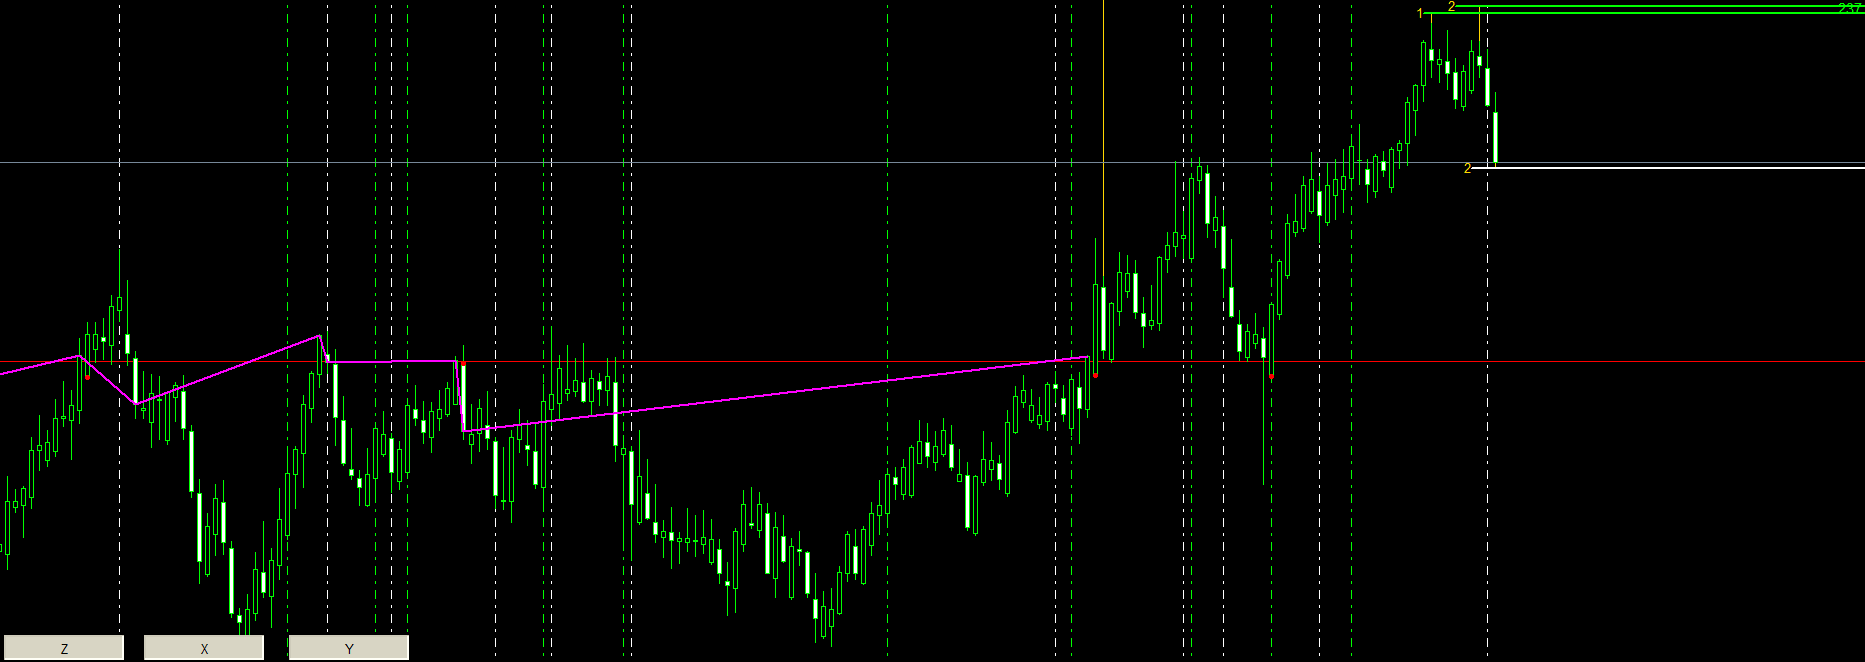
もしTP1シグナル売りが消えた場合、以下の選択肢があります
- 投資の方向を変え、TP2を新たなターゲットとして使用する
- 一連の投資を中断し、新しいTP1シグナルを待つ
- 投資を閉じる
資金管理は重要な役割を果たします投資家には、以下の選択肢があります
- TP1シグナル売りの損失を、同じローソク足の後続TP(TP2,TP3)で取り返します
- TP1シグナル売りの損失を、その後のTP1シグナルで取り返します
- 損失を受け入れる
________________________________________________________________________________________________________________________________________________
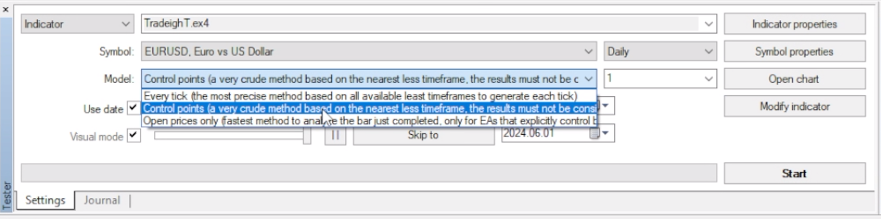
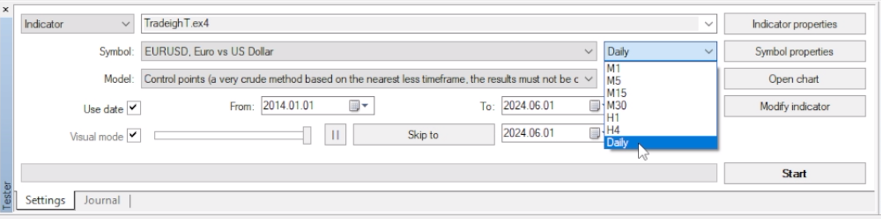
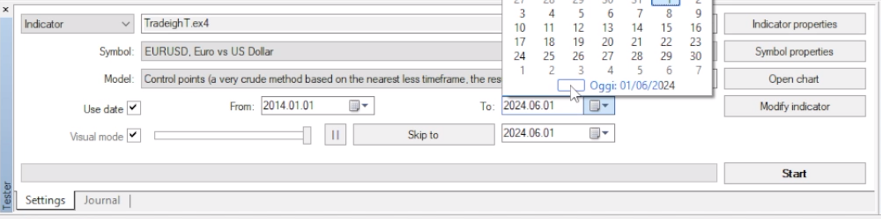
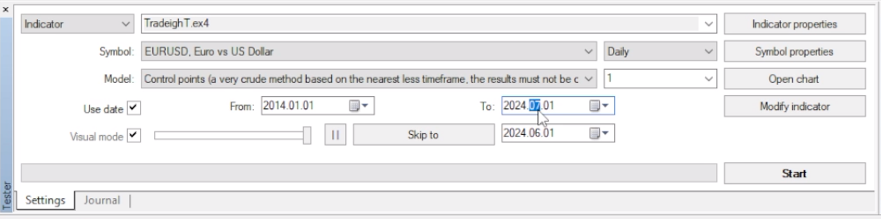
設定
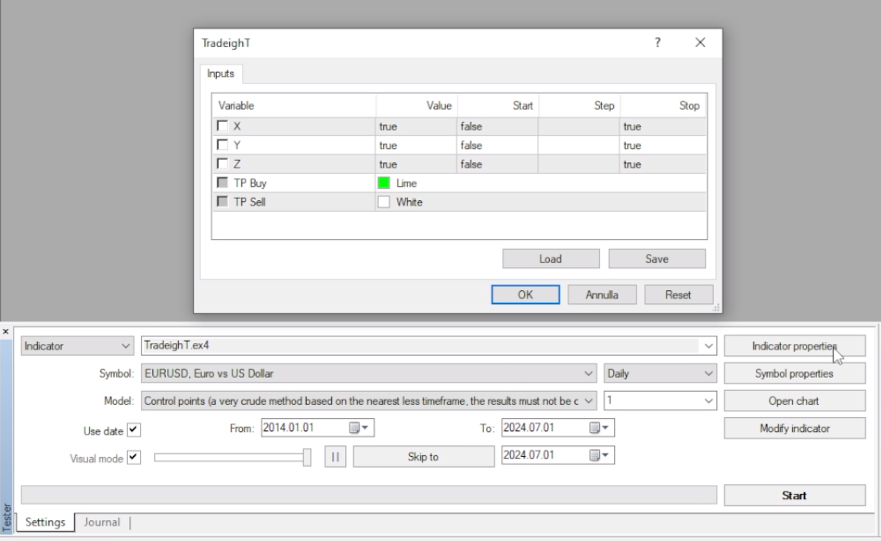
インジケータープロパティのバックテスト前、および以下のボタンによるバックテスト中、バックテスト後に、OBJECTSをオン、オフする事ができます。
- X = 横軸パーマネントトレンドライン
- Y = 縦軸線
- Z = ジグザグ
各バックテストで同じフォーマットを使用する場合は、新しいシンボルを開き、色、特性を変更し、フォーマットをtester.tplとして保存する必要があります。
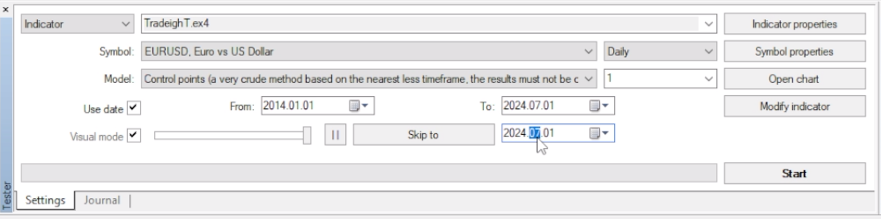
-(1)- 完全な分析を行うためには、10年前の日付をバックテスト開始日として設定します
-(2)- 現在の日付から一か月後の日付をバックテスト終了日として設定します
-(3)- バックテストを速く実行するためには、スキップのボタンを押して先ほどのバックテスト終了日と同じ日付を入力します
詳細についてはイラストを参照してください
________________________________________________________________________________________________________________________________________________
ユーザーは評価に対して何もコメントを残しませんでした