TradeighT
- Göstergeler
- Lorenzo Monari
- Sürüm: 31.48
- Güncellendi: 9 Mayıs 2024
- Etkinleştirmeler: 5
⭐ Program fiyat değişikliklerine dayalı gerçek matematiksel hesaplamalarla piyasanın kullandığı gerçek hareketi tanımlar.
⭐ TradeighT işlemi günümüze kadar varlığını sürdürmüş olan bu matematiksel ilişki üzerine dayalıdır.
⭐ Yatırımcıların genelinin aynı şeylere bakıp aynı bilgileri incelemesi yatırımcıların çoğunluğunun para kaybetmesine neden olur.
⭐ Bu ürün, çoğunluğun fikirlerine değil, pazarın işlemesini sağlayan 4 gerçek temele dayanan bir üründür.
⭐ Bu araç anlaşılması kolay ve kullanımı basit, backtesting yapılabilir tüm çaprazlar için kullanılabilen görsel bir araçtır.
MT4’e özel.
☆ mevcut kâr-alış fiyatlarını sağlar
☆ teknik analiz ile kullanım için seviyeler sağlar
☆ zigzag sunar
☆ mevcut trendi gösterir
☆ yüzdesel olarak yüksek başarılı hedefler sağlar
________________________________________________________________________________________________________________________________________________
TRENDLINE (isteğe bağlı olarak seçilebilir)
YATAY GEÇİCİ TRENDLINE BUY
- 1'den 5'e kadar numaralandırılmıştır
- Renkleri GÖSTERGE ÖZELLİKLERİ'nden düzenlenebilir
- BUY emrinde kâr-alımı olarak kullanılacak fiyatlandırmadır
YATAY GEÇİCİ TRENDLINE SELL
- 1'den 5'e kadar numaralandırılmıştır
- Renkleri GÖSTERGE ÖZELLİKLERİ'nden düzenlenebilir
- SELL emrinde kâr-alımı olarak kullanılacak fiyatlandırmadır
YATAY KALICI TRENDLINE
- direnç seviyesi ya da destek olarak kullanılabilir
DİKEY TRENDLINE
- YATAY GEÇİCİ TRENDLINE nın başlangıcı için zaman referansı olarak kullanılmalıdır
________________________________________________________________________________________________________________________________________________
GENEL ÖLÇÜLER
Her RAKAM bir muma bağlıdır.
Her RAKAM kendisine has bir YATAY GEÇİCİ TRENDLINE’na sahiptir.
Her YATAY GEÇİCİ TRENDLINE kendisine has bir DİKEY TRENDLINE’na sahiptir.
YATAY GEÇİCİ TRENDLINE fiyat tarafından dokunulduğunda, çizgi kaybolur.
YATAY GEÇİCİ TRENDLINE kaybolduğu zaman, o YATAY GEÇİCİ TRENDLINE’na bağlı RAKAM ve DİKEY TRENDLINE da kaybolur.
Eğer YATAY GEÇİCİ TRENDLINE fiyat tarafından dokunulmadan önce kaybolursa, yeni bir YATAY GEÇİCİ TRENDLINE sonraki RAKAM ile birlikte zıt yönde ortaya çıkar.
________________________________________________________________________________________________________________________________________________
DİKEY ÇİZGİLER
DİKEY BUY ÇİZGİSİ
- YATAY GEÇİCİ TRENDLINE BUY'ın rengindedir
- TREND BUY'ı belirtir
DİKEY SELL ÇİZGİSİ
- YATAY GEÇİCİ TRENDLINE SELL'in rengindedir
- TREND SELL'i belirtir
________________________________________________________________________________________________________________________________________________
İŞLEYİŞ
Bu araç gelecek fiyat hareketlerini son derece kesin belirlemek için gerekli tüm bilgileri sağlar;
Araştırma ve istatistik için geçmişi analiz etme imkanı sunar.
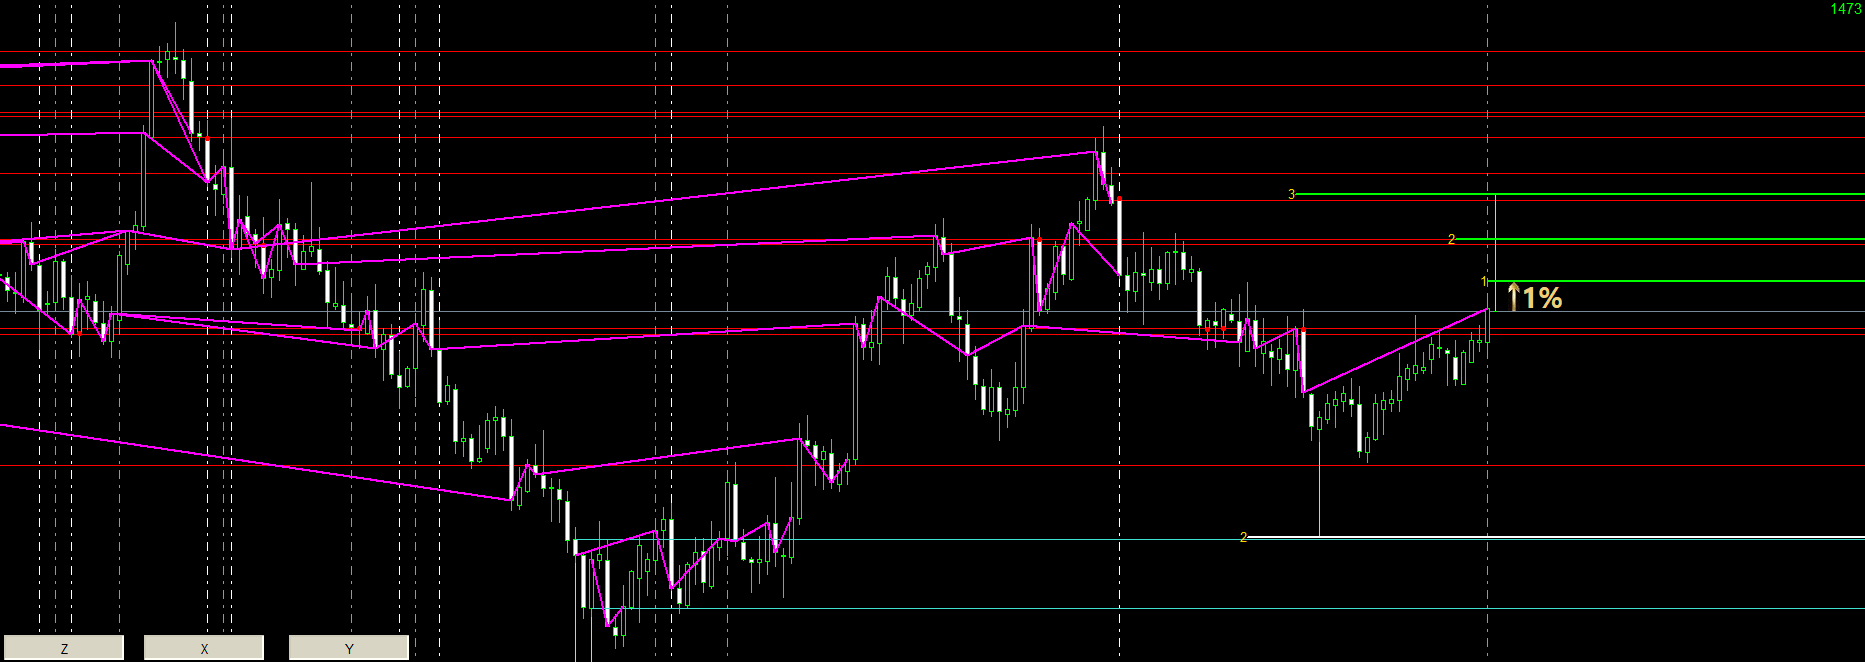
BUY SİNYALİ
Eğer mevcut mumdan önceki mum DİKEY BUY ÇİZGİSI'a sahipse,
TP1 BUY SİNYALİNİ'ni (yani YATAY GEÇİCİ TRENDLINE BUY 1 (TP1), DİKEY BUY ÇİZGİSİ tarafından vurgulanan RAKAM) hedef olarak kullanın.
Sermayenin %1'i oranındaki bir hareketin parasal değeri için yatırım hacmini hareketin büyüklüğüne göre hesaplayın.
Örnek görseldedir.
Eğer TP1 BUY SİNYALİ fiyat tarafından dokunulmadan önce kaybolursa, aşağıdakilerlerden biri seçilebilir:
- TP2’yi yeni bir hedef olarak kullanarak yatırım yönünü değiştirmek
- Seriyi sonlandırmak ve yeni bir TP1 SİNYALİ'ni beklemek
- Yatırımı kapatmak
Para yönetimi, yatırımcının aşağıdaki seçenekler arasından seçme hakkı olduğu zaman önemli bir rol oynar:
- TP1 BUY SİNYALİ’nin kaybını o mum grafiğinden sonraki TP’ler (TP2,TP3..) ile yeniden kazanmak
- TP1 BUY SİNYALİ’nin kaybını sonraki TP1 SİNYALİ ile yeniden kazanmak
- Zararı tahsil etmek
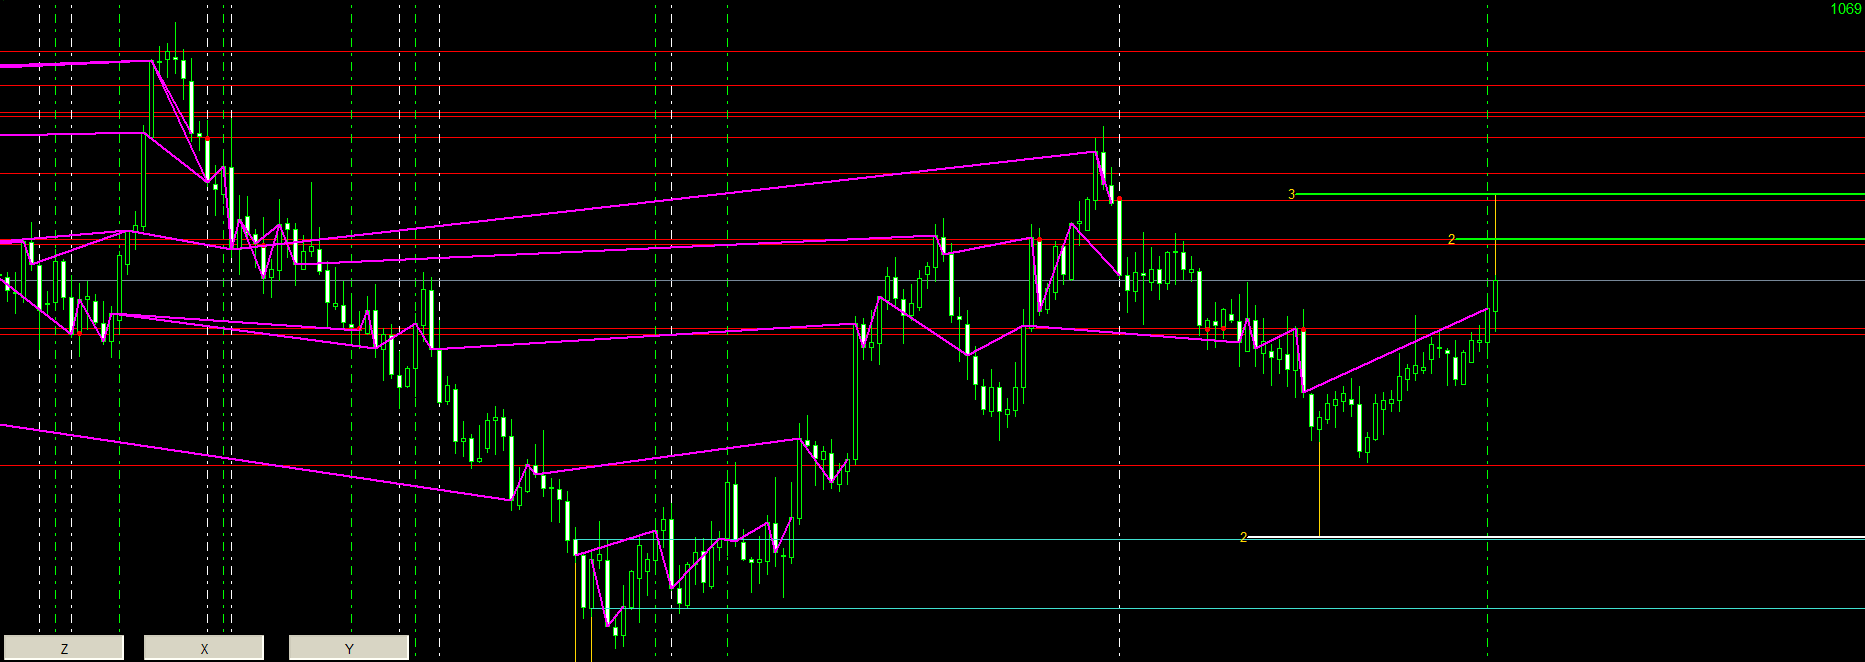
SELL SİNYALİ
Eğer mevcut mumdan önceki mum DİKEY SELL ÇİZGİSİ'ne sahipse,
TP1 SELL SİNYALİNİ'ni (yani YATAY GEÇİCİ TRENDLINE SELL 1 (TP1), DİKEY SELL ÇİZGİSİ tarafından vurgulanan RAKAM) hedef olarak kullanın.
Sermayenin %1'i oranındaki bir hareketin parasal değeri için yatırım hacmini hareketin büyüklüğüne göre hesaplayın.
Örnek görseldedir.
Eğer TP1 SELL SİNYALİ fiyat tarafından dokunulmadan önce kaybolursa, aşağıdakilerlerden biri seçilebilir:- TP2’yi yeni bir hedef olarak kullanarak yatırım yönünü değiştirmek
- Seriyi sonlandırmak ve yeni bir TP1 SİNYALİ'ni beklemek
- Yatırımı kapatmak
Para yönetimi, yatırımcının aşağıdaki seçenekler arasından seçme hakkı olduğu zaman önemli bir rol oynar:
- TP1 SELL SİNYALİ’nin kaybını o mum grafiğinden sonraki TP’ler (TP2,TP3..) ile yeniden kazanmak
- TP1 SELL SİNYALİ’nin kaybını sonraki TP1 SİNYALİ ile yeniden kazanmak
- Zararı tahsil etmek
________________________________________________________________________________________________________________________________________________
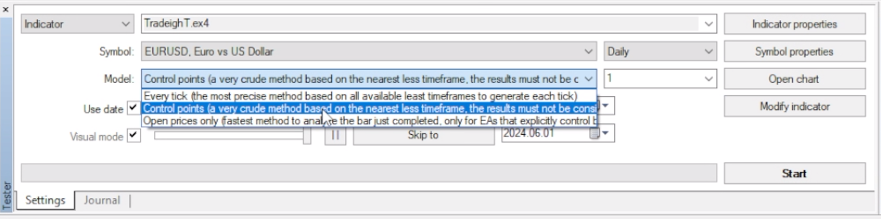
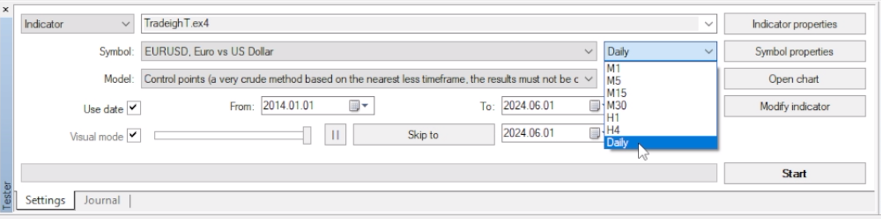
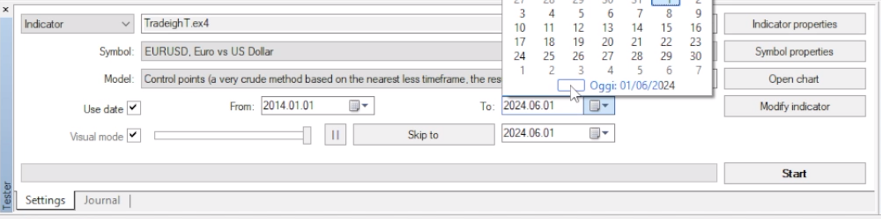
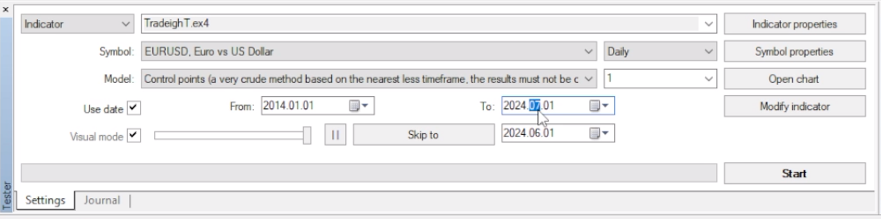
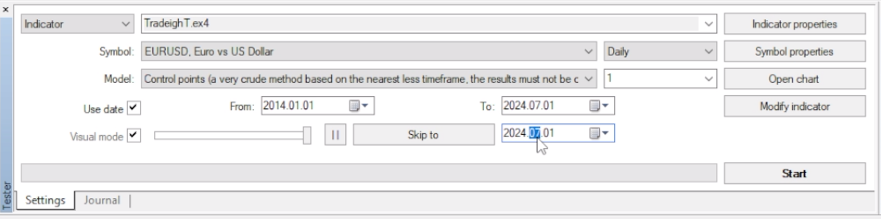
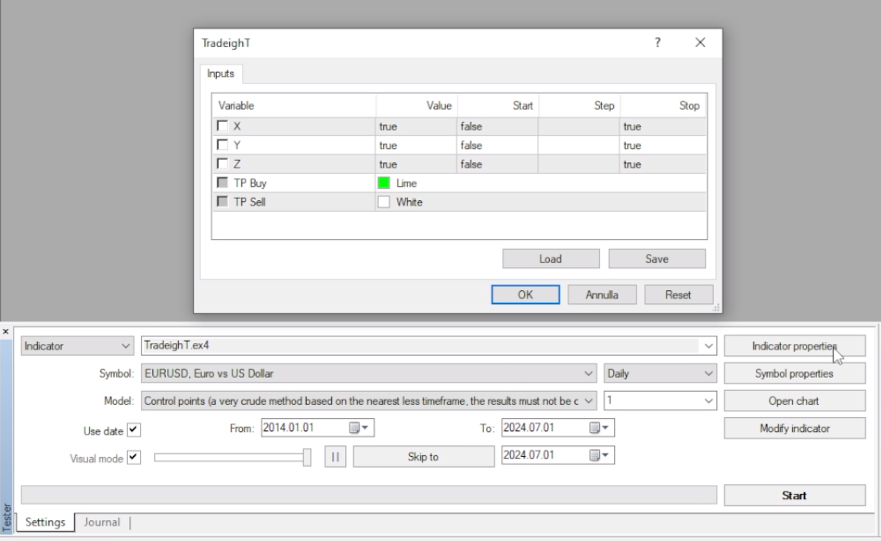
AYARLAR
- X = YATAY KALICI TRENDLINE'lar
- Y = DİKEY ÇİZGİLER
- Z = ZIGZAG
Her backtesting’de aynı ŞABLON’a sahip olmak için yeni bir sembol oluşturun, renkleri ve özellikleri değiştirin ve ŞABLON'u tester.tpl olarak kaydedin.
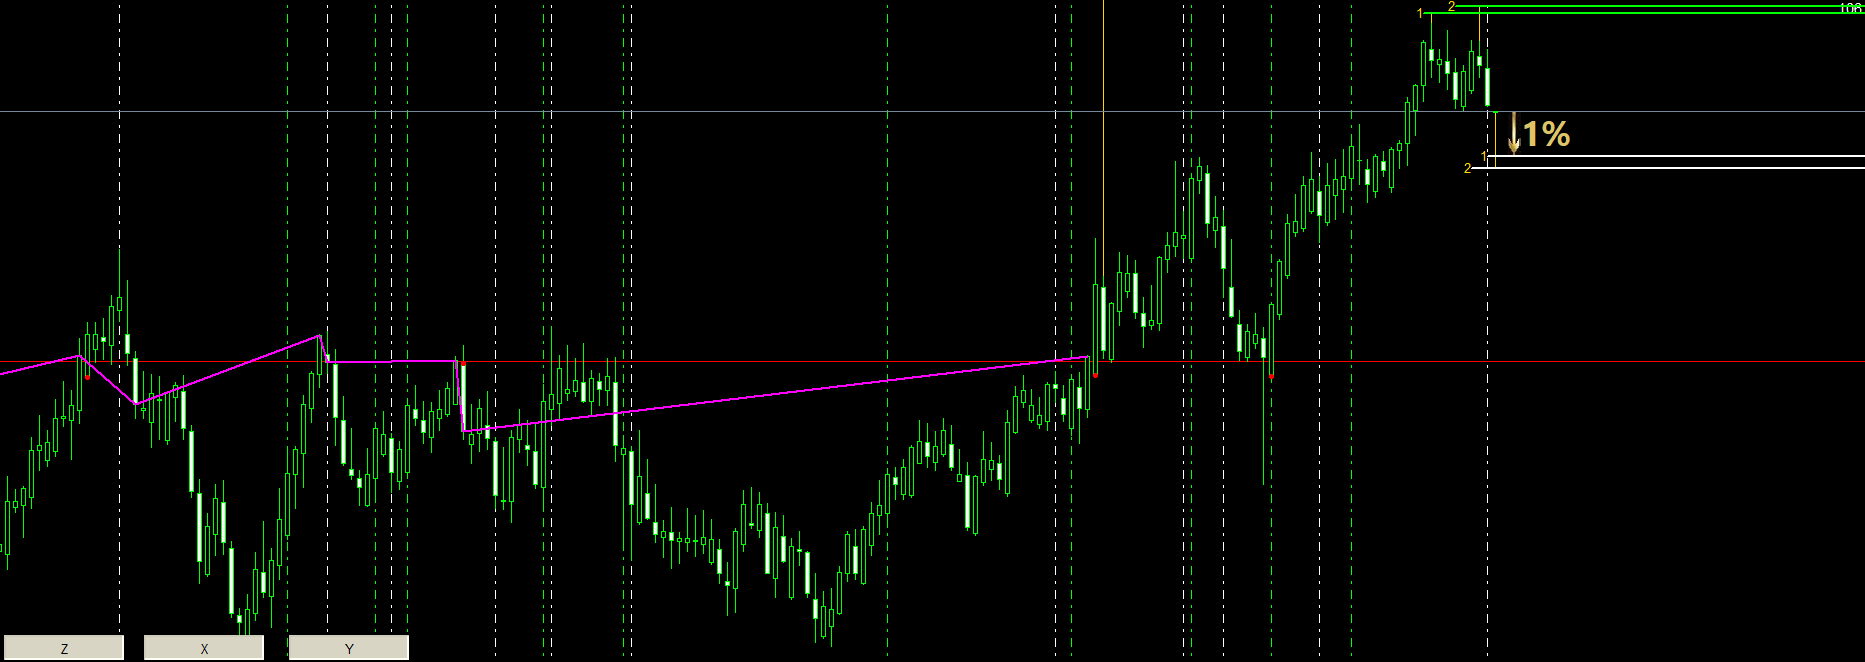
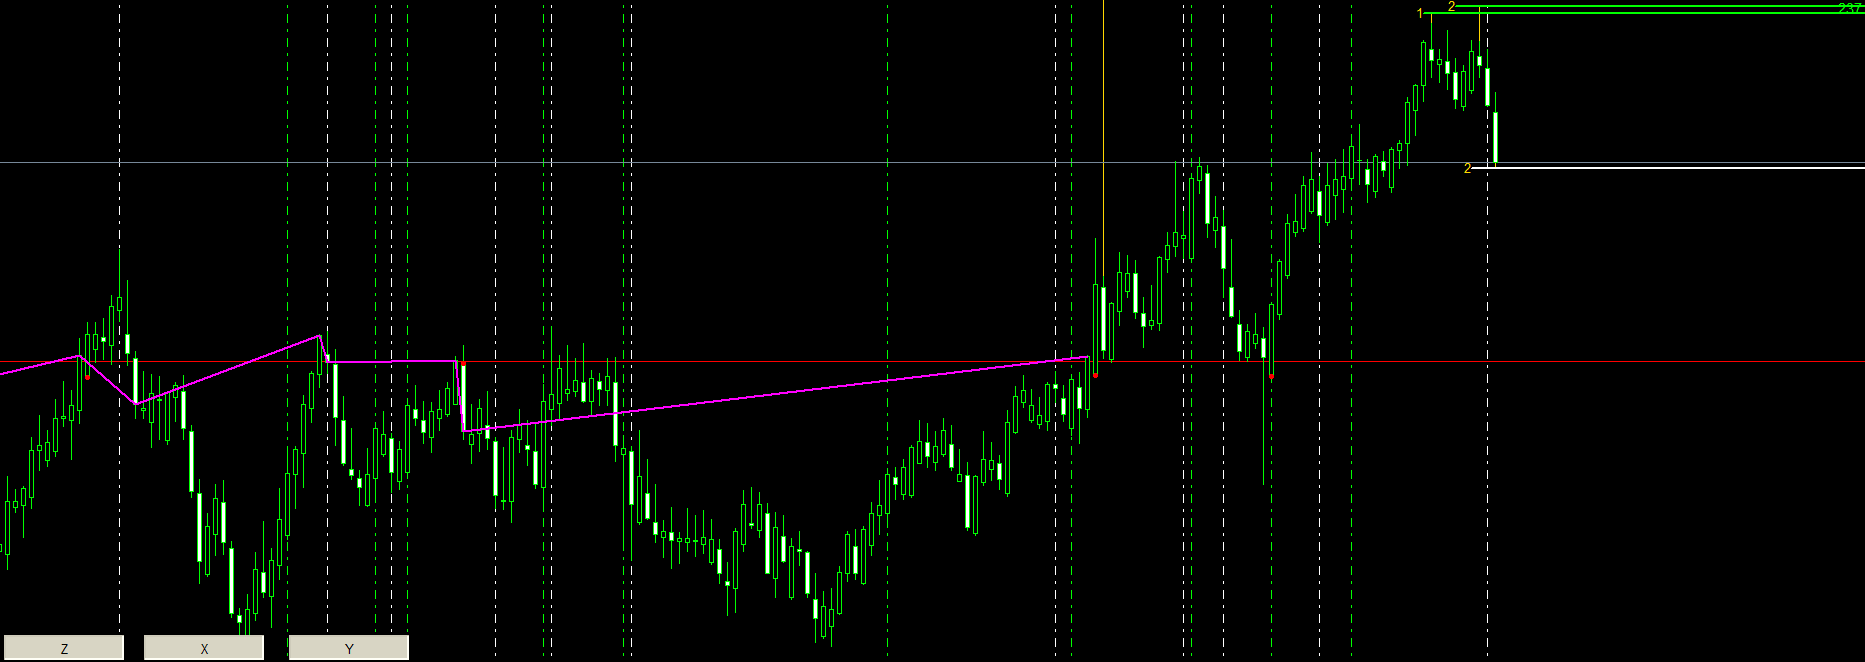
-(1)- Tam bir analiz için güncel tarihten 10 sene öncesini backtesting başlangıç tarihi olarak kullanın.
-(2)- Güncel tarihe bir ay daha ekleyin ve o tarihi backtest’in bitiş tarihi olarak kullanın.
-(3)- Backtest’i hızlandırmak için, ŞURAYA ATLA tuşuna basın ve backtest’in bitiş tarihine denk gelen tarihi girin.
Daha fazla detay için görsellere bakınız.
________________________________________________________________________________________________________________________________________________
🛎️ https://t.me/tradeightrading
Diğer üyelerle fikir ve analiz alışverişi yapmak için Telegram grubuna istek gönderin.
Kullanıcı incelemeye herhangi bir yorum bırakmadı