Смотри обучающее видео по маркету на YouTube
Как купить торгового робота или индикатор
Запусти робота на
виртуальном хостинге
виртуальном хостинге
Протестируй индикатор/робота перед покупкой
Хочешь зарабатывать в Маркете?
Как подать продукт, чтобы его покупали
Технические индикаторы для MetaTrader 4 - 21
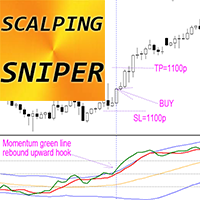
Forex Indicator SCALPING SNIPER for MT4 , No Repaint Trading System Scalping Sniper - is advanced system (indicator) showing accurate price momentum! Upgrade your trading methods with the professional Scalping Sniper Indicator for MT4. This system provide very accurate but rare sniping signals, with win rate up to 90% System suppose to use many pairs to search for signals to compensate low number of signals per one pair. Scalping Sniper consist of: Top & Bottom Volatility lines (Blue colo

отличный инструмент для любого трейдера как для форекс так и для бинарных опционов подойдет любому трейдеру ничего настраивать не нужно все отточено времинем и опытом инструмен совместил в себе 5 индикаторов и 3 собственных стратегии отлично работает на во время флета та и в тренде Он указывает на разворот тренда в самом его начяли хорошо работает по тренде
Рекомендации по торговле Сигнал формулируется на текущей свечи Входить в сделку следует на следующей
Возможен пересчет (редко)

Graphic Shapes -используя историю,проецирует в текущий момент четыре вида графических фигур, позволяющих определить основные диапазоны движения цены в будущем,а так же даёт понимание основных разворотов рынка ,при этом давая точки входа по приоритету!В панели расположены три вида величины фигур выраженные таймфреймами. Позволяют проводить полный анализ рынка,не используя дополнительные инструменты! Индикатор является мощным инструментом прогноза движения цены на рынке форекс!
RSI Alert Pro - это гибко настраиваемый индикатор RSI с богатыми функциями алертов и слежения за уровнями RSI.
Входные параметры Параметр Допустимые значения Описание
Использовать модуль синтеза речи Alerts Pro (Use Alerts Pro Voice Synthesis module) true/false Предоставляет голосовые алерты для трейдеров, у которых есть модуль Alerts Pro (требуется дополнительная покупка) Включить Push-уведомления (Enable Push Notifications) true/false Если указано 'true', система будет отсылать push-ув
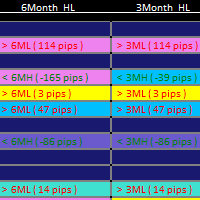
1. Updated usage instructions in blog below: Smart Market Structure Trading System and Automatic Scanner - Trading Systems - 13 October 2023 - Traders' Blogs (mql5.com) https://www.mql5.com/en/blogs/post/754495 2. YouTube video link for introduction: https://youtu.be/tMU04wo0bc8 3. The Smart Market Structure Opportunity Scanner is a great tool to find trading entries and exits based on Smart Money Concepts. It has a build-in custom choice of Forex pair lists to choose from for the scan, and

缠中说禅在MT4的应用,该指标自动识别分型,划笔,划线段,显示笔中枢,线段中枢,也可以根据需求在参数中设置显示自己所需要的。 1.笔采用条件较为宽松的新笔。 2.当前分型与前面分型不能构成笔时,若与前面笔同向且创新高或新底时会延伸笔,若与前面笔异向且符合替换条件则去除倒数第一笔,直接倒数第二笔。 3.线段的终结第一类情况:缺口封闭,再次创新高或新底新低,则判为终结,同时破坏那一笔的右侧考虑特征序列包含。 4.线段终结的第二类情况,缺口未封闭,考虑后一段特征序列分型出现新的顶底分型,同时做了包含处理。 5.中枢显示笔中枢和段中枢可在参数选择 6.第一类买卖点两种方式可选,参数1为MACD动能柱面积,参数2为斜率

Direct translation of blackcat's L3 Banker Fund Flow Trend Oscillator. Get push notifications on your phone app when a signal bar has formed. Historical signals are shown with a red checkmark right on the main chart. Indicators uses two data calculations to check for a positive cross below 25% level. Long signals only! For any further questions feel free to contact me directly. Including requests for product improvements.

The indicator helps the trader in identifying potential liquidity levels. The algorithm used in this indicator checks the behavior of the asset taking into account the price levels, momentum and volume analysis.
Features:- Parameters for signal optimization and alerts.
Usage:- The levels formed by the indicator can be helpful to traders in identifying potential entries, breakouts or reversals. it can assist traders of technical trading background or even pure price action trading. Examples o
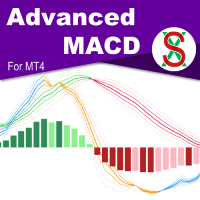
MACD ( M oving A verage C onvergence/ D ivergence) is a widely used indicator in technical analysis. What makes the MACD such a valuable tool for technical analysis is that it effectively combines two indicators into one. It can help to identify trends and measure momentum simultaneously. SX Advanced MACD for MT5 is available here . SX Advanced MACD indicator takes this concept further by plotting two distinct MACD indicators on a single chart, facilitating clear visual correlation between each

A indicator to show saturation in buying or selling With fast and complex mathematical calculations Easily find saturation points for buying or selling Can be used in all symbols and time frames with many signals Can be combined with different indicators and different time frames With simple settings and simple working methods
Features: Can be used on all symbols Can be used in all time frames Can be used in all markets (Forex, stock, etc.) Large number of signals Same performance on all t
Check My Product
Contact me to discover all my services
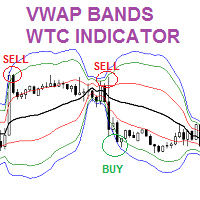
The VWAP Volume weighted Average Price Bands indicator is similar to the Moving Averages and Bollinger bands. In this indicator, more weight is given to the volume. The indicator provides great insight on support and resistance levels in the chart. Moreover, the indicator shows the fair value of a trading instrument. Thus, enabling forex traders to identify great trading opportunities to BUY LOW and SELL HIGH. Forex traders can combine
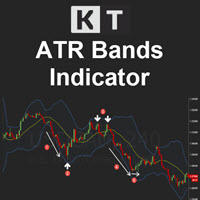
KT ATR Bands draws the volatility envelops and bands using a combination of Average True Range and Moving average. They are typically used to identify the potential reversal points and the periods of high and low volatility.
Features
Multi-Timeframe Ability: For example, you can have the atr bands from the daily timeframe on the H1 timeframe. Smart Alerts: You can turn on/off alerts for each band separately. Also, you can choose a minimum time interval between each alert to stop unnecessary,
Trend Scanner - это трендовый индикатор, помогающий определить текущее и прогнозируемое направление рынка с помощью продвинутого алгоритма. Благодаря гибким настройкам оповещения, индикатор своевременно предупредит вас о развороте тренда. Индикатор интуитивно понятен и прост в использовании, и станет отличным фильтром в ваших трендовых торговых стратегиях. Линии данного индикатора, так же являются отличным динамическим уровнем для стоп-лосса, и применяется как один из видов трейлинг-стопа в Торг
Линейный индикатор силы валют с возможностью фильтрации путем сглаживания значений. Показывает текущую силу выбранных валют (максимально 8), а также исторические значения. Расчёт зависит от выбранного таймфрейма графика, на который установлен индикатор. Индикатор отображает данные в виде линий для всех валют или в виде гистограммы для текущей валютной пары. Пересечение индексов силы валюты для текущей валютной пары дополнительно отображается в виде стрелок на графике. Текущее направление тренда

KT Higher High Lower Low marks the following swing points with their respective S/R levels: Higher High: The swing high made by the price that is higher than the previous high. Lower High: The swing high made by the price that is lower than the previous high. Lower Low: The swing low made by the price that is lower than the previous low. Higher Low: The swing low made by the price that is higher than the previous low.
Features The intensity of swing high and swing low can be adjusted by cha

Contact me after payment to send you the User-Manual PDF File.
Double Top/Bottom Pattern
Double top and bottom patterns are chart patterns that occur when the underlying investment moves in a similar pattern to the letter "W" (double bottom) or "M" (double top). Double top and bottom analysis are used in technical analysis to explain movements in a security or other investment, and can be used as part of a trading strategy to exploit recurring patterns. Searching for this pattern among the c

Description: The indicator predicts, with a specific probability, if the actual candlestick range will expand or contract compared to the range of a previous candle. Furthermore, the indicator shows the possible high or low of the actual candle, based on trend direction. (Recommended for Daily, Weekly, or Monthly timeframes).
KEY LINKS: Indicator Manual – How to Install – Frequent Questions - All Products How to use the indicator: Determines, with a certain probability, if there will

The product Divergence Mom Stoch Adx Bears Bulls is designed to find the differences between indicators and price. It allows you to open orders or set trends using these differences. The indicator has 4 different divergence features.
Divergence types Class A Divergence Class B Divergence Class C Divergence Hidden Divergence
Product Features and Rec ommendations There are 5 indicators on the indicator Indicators = Momentum Stochastic Adx Bears Bulls 4 different divergence types are used
FREE

ATR Scanner Pro is a multi symbol multi timeframe volatility scanner that monitors and analyzes Average True Range indicator value in up to 28 symbols and 9 timeframes in 3 modes : ATR value: As a volatility dashboard it shows the ATR indicator value in all pairs and timeframes and signals when the ATR value reaches a maximum or minimum in a given duration. Short term ATR/Long term ATR ratio: It shows ratio of 2 ATRs with different periods. It's useful in detecting short term volatility and e
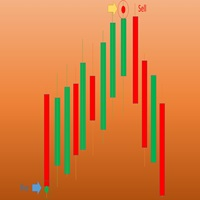
Wave Entry Alerts Oil is a custom indicator developed by Azad Gorgis for MetaTrader 4. This indicator is designed to provide alerts based on ZigZag patterns, specifically tailored for trading on the Oil (XIT/USD) symbol.
Key Features: - Chart Window Indicator: The indicator is designed to be displayed on the main chart window. - Arrow Signals: The indicator generates arrow signals on the chart, indicating potential reversal points based on ZigZag patterns. - Customizable Parameters: Traders c
FREE

Особенности Поддержка создания месячных, недельных, дневных, четырехчасовых, часовых и тридцатиминутных профилей. Дневной профиль имеет настраиваемое время запуска. Слияние и разделение рыночных профилей. Точка привязки профиля может быть экспортирована в формат CSV для последующего анализа.
Параметры индикатора Indicator Update Interval - период расчета индикатора, от 250 милисекунд до 2,5 секунд Indicator Setting ID - Идентификатор для текущих настроек индикатора. Profile Number - Количество

Индикатор Camarilla Pivots Historical строит на графике исторические данные по уровням пивотов Камарилья. Уровни пивотов Камарилья были разработаны в 1989 году Ником Скоттом. Эти уровни используются в качестве основных уровней поддержки и сопротивления при внутридневной торговле. Уровни вычисляются по следующей формуле: R4 = C + RANGE * 1.1/2 R3 = C + RANGE * 1.1/4 R2 = C + RANGE * 1.1/6 R1 = C + RANGE * 1.1/12 PP = (HIGH + LOW + CLOSE) / 3 S1 = C - RANGE * 1.1/12 S2 = C - RANGE * 1.1/6 S3 = C -
FREE

** All Symbols x All Time frames scan just by pressing scanner button ** *** Contact me after the purchase to send you instructions and add you in "Order Block group" for sharing or seeing experiences with other users. Introduction: The central banks and financial institutions mainly drive the market, Order block is considered a market behavior that indicates accumulation of orders from banks and institutions, then the market tends to make a sharp move(Imbalance) on either side once the order bl
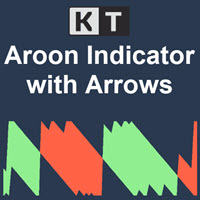
KT Aroon oscillator is the modified version of the original Aroon oscillator initially developed by Tushar Chande in 1995. It measures the time interval between the ongoing highs and lows and uses this deduction to calculate the market trend's direction and strength. It works on the notion that the price will form new highs consecutively during an uptrend, and during a downtrend, new lows will be formed. Buy Signal: When Aroon Up line cross above the Aroon Down line.
Sell Signal: When Aroon Do

Lisek Stochastic oscillator indicator with Alarm, Push Notifications and e-mail Notifications. The Stochastic indicator is a momentum indicator that shows you how strong or weak the current trend is. It helps you identify overbought and oversold market conditions within a trend. The Stochastic indicator is lagging indicator, which means it don't predict where price is going, it is only providing data on where price has been !!!
How to trade with Stochastic indicator: Trend following: As lon
FREE
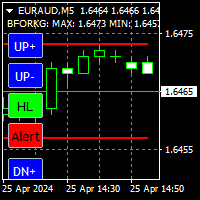
Very useful indicator, you won't be able to be without it. Essential for scalping. It shows rebound levels, top and bottom, forming a fork that surrounds the price. Each level has two blue controls associated to change it, has one green control for rebound mode: High/Low or Open/Close, and has a red breakage alert control. The values of each level, and the distance between levels in pips, are shown at the top left. Features: -T wo independent modes of operation: High/Low, Open/Close. -When on
FREE

A powerful trend analysis tool for traders of all levels Super Trend Analyzer is a technical analysis tool that uses the Relative Strength Index (RSI) and Moving Average (MA) indicators to identify trends in the market. It is a versatile tool that can be used by traders of all levels of experience.
How does it work An uptrend begins when the main trend line and the auxiliary trend line cross from below and the lower minor oscillator is on the rise. A downtrend begins when the main trend line a
FREE
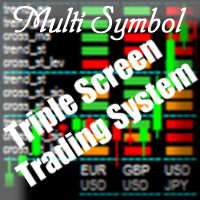
Назначение Индикатор создан для ручной мультивалютной торговли по системе Три Экрана Элдера. Индикатор работает с любыми символами, находящимися в окне Обзор Рынка МТ4, - валютами, металлами, индексами и т.д. Количество инструментов ограничено лишь разрядностью параметров МТ4. Но при желании можно создать несколько окон с разным набором инструментов и параметров.
Принцип работы Индикатор использует модифицированную систему Три Экрана, по которой на третьем экране определяется направление тренд
Когда вы работаете с несколькими активами и имеете несколько открытых позиций по активам, немного сложно визуализировать, когда прибыль или прибыль дает каждая активная проблема, поэтому с учетом этого мы разрабатываем этот индикатор, где он облегчает визуализацию операций с активами. , где вы сможете открыть несколько разных ресурсов и сможете визуализировать индивидуальный результат каждого актива и ускорить принятие решений в своем бизнесе.
FREE

This trend scanner indicator is using two main indicators to identify trends. Frist the EMAs to provide a view on Bullish / Bearish momentum. When the shorter EMA (calculated off more recent price action) crosses, or is above, the slower moving EMA (calculated off a longer period of price action), it suggests that the market is in an uptrend. Second the Stochastic RSI, When RSI is < 20 it is considered oversold, and when > 80 it is overbought. These conditions suggests that momentum is very str
FREE

EZ Risk Reward Ratio — это простой в использовании индикатор MT4, который позволяет пользователю автоматически изменять соотношение риска и вознаграждения для открытой сделки, просто перетаскивая линии тейк-профита или стоп-лосса в желаемые позиции на любом графике. Соотношение риска и вознаграждения отображается в любом углу, и его можно изменить, просто перетащив линии TP и SL. Сначала поместите индикатор EZ Risk Reward Ratio на график MT4, где должна быть размещена сделка. Во-вторых, откройте
FREE

Индикатор Quality trend выражает отношение силы тренда или скорости его роста (падения) к степени его зашумленности или определенной норме амплитуд хаотичных колебаний растущей (падающей) цены. Расположение линии индикатора выше нуля показывает возрастающий тренд, ниже нуля - падающий тренд, колебание линии индикатора вблизи нуля показывает флет. Если линия индикатора начинает быстро колебаться около нуля и приближаться к нему, то это свидетельствует о скором начале трендового движ

Netsrac SR Dashboard
Примечание. Этот индикатор нельзя использовать в тестере стратегий. Демо версия тут с маркета не работает. Пожалуйста, используйте бесплатную версию индикатора для тестирования: https://www.mql5.com/de/market/product/34863
смысл С приборной панелью SR вы получаете мощный инструмент для управления наиболее важной информацией в торговле. Соберите настройку в соответствии со своей стратегией и получите информацию, как только эта настройка вступит в силу. Назначьте разные т

Future prediction is something any trader would love to know, through this simple prediction algorithm can give a picture of the future. This algorithm is based on past data and the average prices of the data to simulate future candles. This is an indicator that will be redrawn. This indicator is completely free, can be used as a trend reference but absolutely do not use for trading.
FREE

Th indicator is a technical analysis tool that helps identify significant changes in price trends and filter out minor price fluctuations. It is used to highlight price swings and provide a clearer picture of market movements. The Pivots are found by checking if a certain candle is the highest/lowest in a given number of candles that come before and after it. This indicator has only one input, its period. The Higher the period, the more strict the indicator is about what constitutes a Pivot. Th
FREE
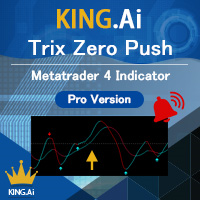
The brand new trading indicator using TRIX strategy is exclusive presented by KING.Ai. Exclusive Functions including Mobile Push Notification . This indicator with Three-mode alerts is developed by KING.Ai ONLY. It is probably impossible that you could find a TRIX indicator like this one. It is very difficult for you to trade with the Trix strategy as there is limited time for traders to monitor every currency. However, the Trix strategy is very profitable especially using in DAY CHAT. It

QuantumAlert Stoch Navigator is a free indicator available for MT4/MT5 platforms, its work is to provide "alerts" when the market is inside "overbought and oversold" regions in the form of "buy or sell" signals. This indicator comes with many customization options mentioned in the parameter section below, user can customise these parameters as needful. Join our MQL5 group , where we share important news and updates. You are also welcome to join our private channel as well, contact me for the p
FREE
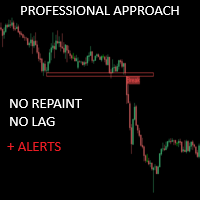
Critical Zones был создан специально для ручных трейдеров, которые ищут более точные входы в рынок. Этот индикатор использует передовые алгоритмы для обнаружения зон интереса, вычисляя наиболее значимые поддержки и сопротивления на графике, а также их прорывы и ретесты. Индикатор может быть настроен на отправку предупреждений и уведомлений при обнаружении потенциально выгодных возможностей для покупки/продажи, что позволяет трейдерам оставаться в курсе торговых возможностей, даже когда они не н

Индикатор показывает уровни золотого сечения Фибоначчии, и линию баланса цены Имеет три различными варианта чувствительности Позволяет визуально ориентироваться в каком состоянии находится рынок и где возможны развороты тренда Работает на всех таймфреймах, на любых валютных парах, металлах и криптовалюте Можно использовать при работе с бинарными опционами Отличительные особенности Основан на золотом значении Фибоначчи; Определяет балансную линию равновесия цены Имеет три различных настройки чувс
FREE
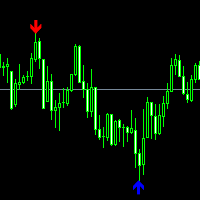
AMS Scalper Отличный индикатор для точки входа в рынок, сигналы индикатора используем только по тренду.
Настройки: Range - 50 ( размер диапазона для поиска сигнала.) Maximum candles Back - 3 (через сколько свечей ставить сигнал) P.S для появление сигнала на нулевой свече - ставим 0.
В качестве индикатора тренда, рекомендуем использовать - Trend Arrow Super
Остались вопросы? нужна помощь?, я всегда рад помочь, пишите мне в личные сообщения или В телеграмм

Метр точности Введение:
Accuracy Meter - это мощный инструмент для определения% выигрышных стратегий, чтобы показать вам все точки входа и выхода из сделок, такие как этот мета-тестер стратегий, вы можете иметь простой тестер стратегий в качестве индикатора на графике, прикрепить его к разным парам и таймфреймам и выяснить процент точности вашей стратегии, измените стоп-лосс и риск на коэффициент вознаграждения и посмотрите, как он может повлиять на вашу идею торговли Accuracy Meter - это ваш
FREE

Pz Oscillator – чувствительный индикатор, который предоставляет много полезной информации и автоматически обнаруживает дивергенции . Данный инструмент может использоваться в качестве подтверждения при совершении сделки, а также для определения направления тренда и его силы. Индикатор был разработан в качестве дополнения к ряду других наших торговых инструментов.
Направление тренда Осциллятор рисует два скользящих средних, показывая направление тренда. Если быстрая скользящая средняя выше медле
FREE

Market Cycles это уникальный авторский индикатор, который использует нейросеть для определения текущей рыночной фазы. Для обучения нейронная сеть используют циклические (разворотные) паттерны. Валютные рынки имеют тенденцию циклически двигаться от медвежьих периодов к бычьим и обратно. В этом продукте мы объединили паттерны с четырех таймфреймов (M5, M15, M30, H1), это позволило значительно увеличить точность сигналов! Market Cycles нужно использовать на валютной паре EURUSD, таймфреме M30 !
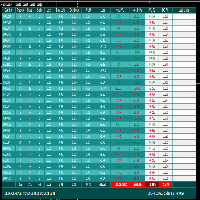
FCK Trade Report This indicator was developed by Fx Candle King. BEFORE CHOOSE CUSTOM PERIOD, GO TO TERMINAL WINDOW (ctrl+T), right click on ACCOUNT HISTORY and CHOOSE ALL HISTORY. This report searches the filtered data in your ACCOUNT CURRENT & HISTORY TRADE, Select your timespan for the report open and closed trades etc... Chose the report type - List only OPEN orders / List only CLOSED orders / List both OPEN and CLOSED orders
FREE
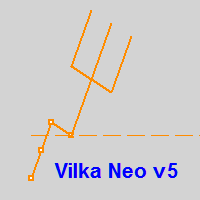
Вилка Нео v5, разрабатывалась для торговой системы "Оракул", но постепенно дополнялась, например - углами Ганна и другими опциями...
Можно создавать графические объекты с заданным цветом, стилем и толщиной, такие как: прямоугольники с заливкой и без, отрезки трендлиний и нестандартный инструмент - "вилка Нео" в виде трезубца, так же есть возможность интерактивно настраивать цветовую палитру прямо с графика, настраивать видимость объектов для разных ТФ, толщину и стили... Панель переключается кл
FREE

Индикатор использует линии Полос Боллинджера для обнаружения тренда. Очень полезный инструмент для ручной торговли. Кроме того, можно использовать индикатор с ATR в качестве фильтра, а также включить всплывающее уведомление при развороте тренда. Показатели индикатора очень понятны и просты в использовании. Лучше всего индикатор работает на таймфрейме H1.
Параметры советника: BarsCount - количество баров для расчета линии. BBperiod - период полос Боллинджера. BBdeviations - отклонения полос Бол
FREE

With this indicator, you can easily make price regions in all time zones. In addition, with the automatic supply demand finder, you can ensure that the new regions are found automatically. You can increase your transaction quality by reaching more accurate operations with this auxiliary Tool and indicator.
I share your trial version of EURUSD for free with you. If you want to buy the working version in all parities, you can contact me. +New version Gap Bar Add ( Press G keyboard ) Default co
FREE

Индикаторы для трендовых!
Торговая система, построенная на трех скользящих средних. Торгуйте по тренду и позвольте прибыли расти. Necessary for traders: tools and indicators Waves automatically calculate indicators, channel trend trading Perfect trend-wave automatic calculation channel calculation , MT4 Perfect trend-wave automatic calculation channel calculation , MT5 Local Trading copying Easy And Fast Copy , MT4 Easy And Fast Copy , MT5 Local Trading copying For DEMO Easy And Fast Copy , M
FREE

BinaryFortune - индикатор, разработан и адаптирован специально для торговли краткосрочными бинарными опционами. Алгоритм индикатора, прежде чем выдать сигнал анализирует множество факторов. Устанавливается индикатор обычным способом. Сам индикатор состоит из информационного окна, где отображается имя торгового инструмента, уровни поддержки и сопротивления, непосредственно сам сигнал ( BUY , SELL или WAIT ). Появление торгового сигнала сопровождается также звуковым сигналом и окном Alert. Преиму
FREE

Индикатор LexusBO рекомендуется для торговли бинарными опционами . ( Для создания своего сигнального индикатора без знания кода и опыта программирования воспользуйтесь моим уникальным инструментом Arrow Construct .) Сигналы формируются при пересечении настраиваемых уровней индикаторами RSI, ADX, CCI. На графике индикатор отображает сигналы стрелками "вверх/вниз" , значения которых находятся в буферных массивах (буфер с индексом 0 - стрелка "вверх", с индексом 1 - стрелка "вниз"). Поэтому инд
FREE

Check my p a id tools they work perfect please r ate Adjustable PIN BAR indicator is usefull tool alowing to search for pin bars you wish to find on the price chart, it has 2 parameters to filter out what type of pin bars you wish to search for: 1) MinTailProc 75% (default) which means to show pin bars that has minimum size of the Nose (Tail) as 75% of full candle size. If Upper Nose (Tail) size of the candle is minimum 75% of the candle size fully than candle is painted in RED. If Lower Nose
FREE

McS Super Trend -This is one of the most popular classic trend indicators. It has a simple setting, allows you to work not only with the trend, but also displays the stop loss level, which is calculated by this indicator. Benefits:
Instruments: Currency pairs , stocks, commodities, indices, cryptocurrencies. Timeframe: М15 and higher. Trading time: Around the clock. Shows the direction of the current trend. Calculates the stop loss. It can be used when working with trading. Three types of no
FREE

Эта система поможет найти высоковероятностные сделки в направлении сильных трендов. Возможность заработать прибыль появляется с помощью поиска завершения движения в одну сторону.
Важная информация Для максимального использования потенциала сканера прочитайте полное описание (на английском языке): www.mql5.com/en/blogs/post/718109 Использование индикатора описано в записи в логе (на английском): Professional Trading With Strong Momentum Бесплатная версия индикатора работает только на парах EURU
FREE

Задумывались ли вы когда-нибудь, почему столько трейдеров остаются один на один со слабыми позициями не на той стороне рынка? Одна из причин этому - волатильность. Валютная пара неожиданно начинает движение на новостях или выходе экономических данных. Предвкушая быструю и легкую прибыль, на рынок сразу устремляются трейдеры. И вдруг цена разворачивается. Происходит это на всех таймфреймах и на всех символах. Закрытие свечи или бара с широким спредом сменяется резким разворотом цены, оставляя тре

У каждого индикатора есть свои достоинства и недостатки. Трендовые показывают хорошие сигналы во время тренда, но запаздывают во время флэта. Флэтовые прекрасно себя чувствуют во флэте, но при наступлении тренда сразу же умирают. Все это не было бы проблемой, если было бы просто предсказать, когда тренд сменится флэтом, а флэт сменится трендом, но на практике это крайне серьезная задача. Что если разработать такой алгоритм, который сможет в индикаторе устранить недостатки и усилить его достоинс

Currency RSI Scalper - это профессиональный индикатор на базе известного индикатора Relative Strength Index (RSI). Хотя индикатор RSI отлично работает в определенные периоды рынка, он не может генерировать прибыльные сигналы, когда состояние рынка меняется, и, следовательно, выдает неправильные сигналы, которые могут привести к большим потерям. Вы когда-нибудь задумывались об адаптивном индикаторе RSI , который адаптируется в соответствии с рыночными условиями? Представленный индикатор реализуе

This dynamic indicator will identify when Fast Moving Averages (EMA, SMA, or LW) cross Slow Moving Average lines on any timeframe and with any symbol.
When the moving averages cross and price close above or below the crossing, the User will receive an alert via pop-up, push, or email.
Choose any two Moving Averages to cross to receive an alert and the Indicator will also paint the Moving Average Lines and Arrows.
You can choose Exponential Moving Averages (EMA). Simple Moving Averages (SMA
MT5 Version Available Here: https://www.mql5.com/en/market/product/50255
Telegram Channel & Group : https://t.me/bluedigitsfx
V.I.P Group Access: Send Payment Proof to our Inbox
Recommended Broker: https://eb4.app/BDFXOsprey
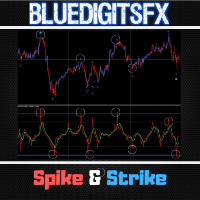
* Breakthrough Solution For Reversal Trading And Filtering With All Important Features Built Inside One Tool! BlueDigitsFx Spike And Strike Reversal is a mixed oscillator that mixes the readings of a number of indicators, which makes it potential to preci

Hello trader,
I'm a fan of Price Action and i coded my indicator named Price Action Candle. May be future it is a paid version that can be get alert by mobile phone or telegram. This indicator can show you three type candles as: PinBar, Inside Bar and Fakey. You can setup more option for other candle: Engulfing
Feel free to contact me in a private message or via telegram @spotXXX
Thanks and happy trading!
FREE

We Trade Live Trend Candle Stick can help identify potential trend in the market when trading, spot market trends and predict future prices. We Trade Live Trend Candle Stick has a smoother look, as it is essentially taking an average of the movement. candles will stay RED during a downtrend and Green during an uptrend . We believe It's useful for making candlestick charts more readable and trends easier to analyse. As a breakout trader you are looking for trades that are ‘breaking out’ of
FREE

Индикатор R Inside Bar для Metatrader 4 предоставляет простые в использовании уровни ценового прорыва на основе внутренних баров.
Он работает на чистом ценовом действии и не перерисовывается, а всплывает в главном окне графика MT4 в виде двух цветных горизонтальных линий выше и ниже фактического внутреннего бара.
Зеленая горизонтальная линия действует как сопротивление, а красная — как поддержка.
Идея длинной и короткой торговли Открывайте ордер на покупку, если свеча закрывается выше зел
FREE
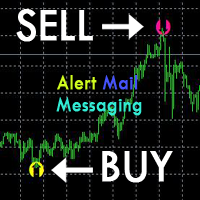
[ZhiBiZZD_MT4] Индикатор подходит для всех циклов и подходит для всех рыночных разновидностей.
[ZhiBiZZD_MT4] Стрелка вниз является сигналом (Sell).
[ZhiBiZZD_MT4] Стрелка вверх является сигналом (Buy).
[ZhiBiZZD_MT4] можно установить в параметрах (Предупреждение, Отправить почту, Отправить уведомление), установить на (true) для отправки мгновенных сигналов в окно тревоги, электронную почту, обмен мгновенными сообщениями.
Описание настройки параметров:
[alert_NO_OFF]: это аварийный вык

Introduction To Time Box Indicator Time Box Indicator is a must have indicator for any trader. It will display daily, weekly and Monthly box according to your preferences. Yet, you can extend any important price levels in your chart automatically. You can use them as the significant support and resistance levels. It is very simple but effective tool for your trading.
Graphic Setting Use White Chart Line Style for Current Open price
Daily Setting Update Timeframe for daily box Number of days
FREE

This indicator plots another symbol on the current chart. A different timeframe can be used for the symbol, with an option to display in multiple timeframe mode (1 overlay candle per several chart candles). Basic indicators are provided. To adjust scaling of prices from different symbols, the overlay prices are scaled to the visible chart price space.
Features symbol and timeframe input MTF display option to vertically invert chart, eg overlay USDJPY, invert to show JPYUSD
data window values
FREE

This indicator is designed to find the difference in RSI price and indicator. This indicator shows the price and indicator difference on the screen. The user is alerted with the alert sending feature. Our Popular Products Super Oscillator HC Cross Signal Super Cross Trend Strong Trend Super Signal
Parameters divergenceDepth - Depth of 2nd ref. point search RSI_Period - Second calculation period indAppliedPrice - Applied price of indicator indMAMethod - MA calculation method findExtInt
FREE
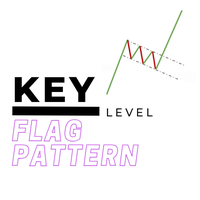
The Key level flag pattern is one of it's kind when it comes to flag patterns on the Metatrader platform. It is perfect for entering pullbacks in a trend, retests on certain structure or price action, or when you are just looking for a confirmation entry on a zone or odrerblock. It's works on all markets, whether it's forex, crypto currency, stocks or futures. In it's algorithm it incorporates an: 1. Impulsive move (leg/pole) = this is the high momentum move which creates the leg/pole of the pat
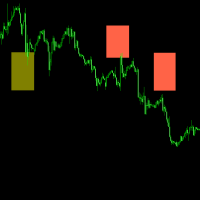
The indicator is very effective in currency exchange, for example EURUSD GBPUSD AUDUSD NZDUSD USDCHF USDCAD and it is very easy to identify the position of top and bottom. Suggest using it on the MT4 platform of SwissQuote Bank.
SwissQuote Link: https://trade.swissquote.ch/signup/public/form/full/fx/com/individual?lang=cn&partnerid=daf9af43-2f95-443e-86c5-89ce1ab2bd63#full/fx/com/individual/step1
Exness Link: https://one.exness.link/a/t2v0o2v0
With a little understanding of trading and the
FREE

Symmetrical Triangle Pattern Indicator - Mastering Trend Recognition in MetaTrader Unlock the power of trend recognition with the "Symmetrical Triangle Pattern" indicator for MetaTrader. This innovative tool simplifies the identification of symmetrical triangle patterns, providing traders with clear signals for potential trend continuation or reversal. Elevate your trading strategies with this MQL offering. Key Features : Accurate Pattern Recognition : The Symmetrical Triangle Pattern Indicator
FREE

This indicator is the translated version of Kıvanç ÖZBİLGİÇ's PMAX Indicator, developed on the Matriks Data Terminal, into the MQL4 language. It is a trend-following indicator and quite successful. Its usage will be free and unlimited for a lifetime. You can click on my profile to access the MQL5 version of this indicator. You can also get your programming requests for MQL4 and MQL5 languages done at İpek Bilgisayar with an invoiced service. You can reach İpek Bilgisayar at www.ipekbilgisayar.or
FREE

The Sextet is an MT4 indicator that displays 6 levels of Moving Averages, where the second is the moving average of the first, the third of the second, and so on. It gives a signal when all the moving average levels align in order. Get a Free Sextet EA, and read discussions about using The Sextet Indicator on Forex Factory:
The Sextet EA @ Forex Factory Check out the The Sextet Scalper Pro for a more elaborate scalping strategy also with Free EA . Key Features: Is a Moving Average of a Movi
FREE
А знаете ли вы, почему MetaTrader Market - лучшее место для продажи торговых стратегий и технических индикаторов? Разработчику у нас не нужно тратить время и силы на рекламу, защиту программ и расчеты с покупателями. Всё это уже сделано.
Вы упускаете торговые возможности:
- Бесплатные приложения для трейдинга
- 8 000+ сигналов для копирования
- Экономические новости для анализа финансовых рынков
Регистрация
Вход
Если у вас нет учетной записи, зарегистрируйтесь
Для авторизации и пользования сайтом MQL5.com необходимо разрешить использование файлов Сookie.
Пожалуйста, включите в вашем браузере данную настройку, иначе вы не сможете авторизоваться.