Смотри обучающее видео по маркету на YouTube
Как купить торгового робота или индикатор
Запусти робота на
виртуальном хостинге
виртуальном хостинге
Протестируй индикатор/робота перед покупкой
Хочешь зарабатывать в Маркете?
Как подать продукт, чтобы его покупали
Технические индикаторы для MetaTrader 4 - 19

This indicator presents an alternative approach to identify Market Structure. The logic used is derived from learning material created by DaveTeaches (on X)
When quantifying Market Structure, it is common to use fractal highs and lows to identify "significant" swing pivots. When price closes through these pivots, we may identify a Market Structure Shift (MSS) for reversals or a Break of Structure (BOS) for continuations. The main difference with this "protected" logic is in how we determine

Или (BD%), который представляет собой индекс волатильности, который измеряет волатильность в процентах, а не в пунктах. Идея BD% состоит в том, чтобы создать индекс, зависящий от классического стандартного отклонения (CSD), который колеблется от 0 до 100 процентов.
Вы можете использовать BD% для сравнения волатильности одной и той же ценной бумаги в разные периоды времени или в разных временных рамках. Кроме того, вы можете использовать BD% для сравнения волатильности между разными ценными бу

Уровни разворота — это хорошо зарекомендовавший себя технический уровень, признанный на каждом рынке. Этот индикатор будет отображать текущие квартальные, месячные, недельные, дневные и четырехчасовые развороты на графике для любого символа. Вы также можете отобразить уровни поддержки и сопротивления для каждого периода и выбрать, какие из уровней 1–4 отображать. Выберите тип Pivot из: Стандарт Камарилья Демарк Вуди Фибоначчи Обратите внимание, что пивоты ДеМарка имеют один уровень поддержки

GTAS S-Trend — это индикатор импульса, помогающий определить тренд на основе комбинации MACD, RSI и скользящих средних. Автором индикатора является Бернард Пратс Деско, частный трейдер, в прошлом управляющий хедж-фонда, основатель компании E-Winvest.
Описание Значения индикатор колеблются между -65 и +65, нейтральная зона находится между -25 и +25, уровень равновесия находится на отметке 0. Значения индикатора S-Trend между -25 и +25 означают зоны скопления с бычьим смещением в диапазоне от 0
FREE

Мощная система для торговли бинарными опционами и внутридневной торговли. Индикатор не перерисовывается и не изменяет свои показания. Binary Reverse предназначен для определения мест, в которых цена совершит разворот. Индикатор фиксирует как развороты, так и откаты тренда, что позволяет повысить эффективность его использования. При использовании индикатора значительно расширяются возможности анализа, на графике отлично видны не только места коррекции и разворотов, но и отслеживается общая динами
Эта программа сделает анализ нескольких таймфреймов более удобным.
Это поможет синхронизировать все графики на разных графиках синхронизации таймфреймов, чтобы отображать один и тот же символ, тот же определенный период времени и синхронизация объектов чертежа Показать на всех диаграммах одновременно
Поддержка синхронизации объектов: вертикальная/горизонтальная линия, линия тренда, прямоугольник, стрелка, коррекция Фибоначчи
Дополнительная функция: оповещение о линии тренда
Как им польз
FREE

Trend Filter Pro
Индикатор фильтрации тренда. Очень хороший фильтр для вашей торговой системы, рекомендую использовать совместно с - System Trend Pro или с Professional Trade Arrow
Индикатор не перерисовывается и не изменяет свои данные.
Настройки: Меняйте параметр Period для лучшей фильтрации ( по умолчанию стоит - 90)
Остались вопросы? нужна помощь?, я всегда рад помочь, пишите мне в личные сообщения
FREE

Currency Strength Meter - это самый простой способ определить сильные и слабые валюты. Этот индикатор показывает относительную силу 8 основных валют + Золото: AUD, CAD, CHF, EUR, GBP, JPY, NZD, USD, XAU. Символ золота может быть изменен на символ другого инструмента, например такого как XAG, XAU и т.д.
По умолчанию значение силы нормализовано в диапазоне от 0 до 100 для алгоритма RSI: Значение выше 60 означает сильную валюту; Значение ниже 40 означает слабую валюту;
Для работы данного индик

Наша инновационная панель Basic Candlestick Patterns Dashboard специально разработана для автоматического определения прибыльных свечных моделей на графике. Эта панель использует передовые алгоритмы для сканирования ценовых графиков в режиме реального времени и выявления широкого спектра свечных моделей, от классических до сложных. Кроме того, он имеет простой в использовании интерфейс, который позволяет визуализировать обнаруженные паттерны на различных таймфреймах, что облегчает принятие обос

The Donchian channel is an indicator that takes a series of user-defined periods and calculates the upper and lower bands. Draw two lines on the graph according to the Donchian channel formula. This straightforward formula is based on:
The top line is the highest price for the last periods n The bottom line is the lowest price for the last periods n
Trend systems follow periods when support and resistance levels are broken. in this case when the price breaks the upper line or the lower line
FREE
Этот индикатор одновременно прокручивает несколько графиков, когда вы прокручиваете график, к которому прикреплен индикатор. Это полезно для тестирования стратегий с несколькими таймфреймами, стратегий с несколькими парами, одновременного мониторинга нескольких графиков и оглядывания назад, чтобы увидеть, как несколько рынков работали исторически в одно и то же время. Индикатор легкий и может использоваться для одновременного перемещения до 99 графиков.

TTM Squeeze Indicator TTM Squeeze is an indicator to time entries based on volatility.
TMM Squeeze might well be one of the best and most overlooked indicator. It was created by famous trader John Carter and is also used by many traders like Nathan Bear.
Why is the TTM Squeeze indicator important? Because in trading correct timing entries might be more important than picking the right direction. This is a concept that is not very well understood in the trading community. Most trader think
Представляем Awesome Oscillator Alert , мощный технический индикатор, который предоставляет трейдерам ценную информацию о динамике рынка и торговых возможностях. Благодаря своим обширным функциям и удобному интерфейсу этот индикатор является важным инструментом для трейдеров, стремящихся получить преимущество на рынке.
Одной из выдающихся особенностей Awesome Oscillator Alert является его совместимость со всеми валютными парами и таймфреймами. Независимо от того, торгуете ли вы основными

All traders should know the trend before making their decision when placing the buy or sell orders. The first step always starts with supply and demand , rising and falling channels , trend lines, engulfing candles etc. All the above contribute to what is called “Price Action” and that is the best and most reliable way in trading and catching the trend and making profits, without stress. The Investment Castle Trend Line Indicator will automatically draw the trend lines on the MT4 for you. An
FREE

This indicator plots in the candles the divergence found in the selected indicator and can also send a notification by email and / or to the cell phone.
Works on all TIMEFRAMES. Meet Our Products
He identifies the divergences in the indicators:
Relative Strength Index (RSI); Moving Average Convergence and Divergence (MACD); Volume Balance (OBV) and;. iStochastic Stochastic Oscillator (STOCHASTIC).
It is possible to choose the amplitude for checking the divergence and the indicator has
FREE

Bollinger Bands Breakout Alert is a simple indicator that can notify you when the price breaks out of the Bollinger Bands. You just need to set the parameters of the Bollinger Bands and how you want to be notified.
Parameters: Indicator Name - is used for reference to know where the notifications are from Bands Period - is the period to use to calculate the Bollinger Bands Bands Shift - is the shift to use to calculate the Bollinger Bands Bands Deviation - is the deviation to use to calculate
FREE

This trend scanner indicator is using two main indicators to identify trends. Frist the EMAs to provide a view on Bullish / Bearish momentum. When the shorter EMA (calculated off more recent price action) crosses, or is above, the slower moving EMA (calculated off a longer period of price action), it suggests that the market is in an uptrend. Second the Stochastic RSI, When RSI is < 20 it is considered oversold, and when > 80 it is overbought. These conditions suggests that momentum is very str
FREE
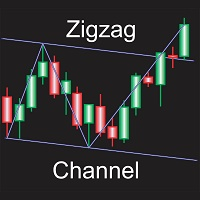
Automatically draws channel base on zigzag, with option to draw zigzag based on candle wicks or close prices. All zigzag parameters can be adjusted in settings, option to display or hide zigzag also available, every other adjustable settings are self explanatory by their name, or at least so I believe. Only download this indicator if you need a program to automatically plot channels for you based on zigzag of any specific settings.
FREE

Постоянная необходимость проверки того, достиг ли RSI определенного уровня, может быть утомительным и отнимающим силы, особенно если нужно одновременно отслеживать разные классы активов. Индикатор Alert RSI поможет в этой задаче, гарантируя, что вы получите максимум при минимальных усилиях. Когда значения RSI достигают определенного уровня, оповещения будут подаваться на графике, в мобильном приложении MetaTrader 4 или по электронной почте (вы можете получать текстовые сообщения на мобильное уст
FREE

Этот индикатор обнаруживает разворот цены зигзагообразно, используя только анализ ценового действия и канал Дончиана. Он был специально разработан для краткосрочной торговли, без перекраски или перекраски вообще. Это фантастический инструмент для проницательных трейдеров, стремящихся увеличить сроки своих операций. [ Руководство по установке | Руководство по обновлению | Устранение неполадок | FAQ | Все продукты ]
Удивительно легко торговать Это обеспечивает ценность на каждом таймфрейме Ре

The Investment Castle Chances indicator will show signals on the chart for entering a buy or sell trade. There are 2 types of signals for each direction as follows: Buy / Sell (Orange colored candlesticks) Strong Buy (Green colored candlesticks) / Strong Sell (Red colored candlesticks) You may place a buy trade once you see the Buy arrow or vise versa, or you might prefer to wait for a further confirmation “Strong Buy” / “Strong Sell”. This indicator works best with the high time frames H1, H
FREE
Индикатор Macd 2 линии с торговыми стрелками.
Включает :
Сигнал MACD и линия MACD 2-цветная гистограмма 0 уровень возможные торговые стрелки Как читать :
Индикатор покажет вам стрелку после того, как произошло пересечение, и быстрая линия пройдет выше или ниже нулевой линии! Используйте надлежащее управление рисками и не торгуйте на новостях о высокой волатильности!
ПОСМОТРЕТЬ ДРУГИЕ ПРОДУКТЫ: https://www.mql5.com/en/users/gabedk/seller
FREE
Pipfinite creates unique, high quality and affordable trading tools. Our tools may or may not work for you, so we strongly suggest to try the Demo Version for MT4 first. Please test the indicator prior to purchasing to determine if it works for you. We want your good reviews, so hurry up and test it for free...we hope you will find it useful.
Attention This trading tool is specifically designed to help grid, martingale, averaging, recovery and hedging strategies. If you are not familiar with t

HEDGING MASTER line indicator It compares the power/strength lines of two user input symbols and create a SMOOTHED line that indicates the degree of deviation of the 2 symbols Strategy#1- FOLLOW THE INDICATOR THICK LINE when CROSSING O LEVEL DOWN --- TRADE ON INDICATOR THICK LINE (TREND FRIENDLY) !! Strategy#2- TRADE INDICATOR PEAKS (Follow indicator Reversal PEAKS Levels)!! you input - the index of calculation ( 10/20/30....) - the indicator Drawing start point (indicator hi

Это ценовой канал, который показывает на графике пять важных ценовых уровней. Эти уровни: 1. Самый высокий максимум (HH) предыдущих x баров.
2. Самый высокий минимум (HL) предыдущих x баров.
3. Центральная линия.
4. Самый низкий максимум (LH) предыдущих x баров.
5. Самый низкий минимум (LL) предыдущих x баров. Как каналы Бермауи захватывают зону перекупленности
Думайте о расстоянии между уровнями HH и HL как о зоне перекупленности.
Когда ценовые свечи или бары пересекают HL вверх, это ука
Pipfinite creates unique, high quality and affordable trading tools. Our tools may or may not work for you, so we strongly suggest to try the Demo Version for MT4 first. Please test the indicator prior to purchasing to determine if it works for you. We want your good reviews, so hurry up and test it for free...we hope you will find it useful.
Combo Swing Control with Energy Beam Strategy: Confirm swing pullback signals Watch Video: (Click Here)
Features Detects overall bias and waits for ove

Оживите свои торговые графики с помощью нашего инновационного конструктора тем для Metatrader!
Наш Конструктор тем позволяет создать торговую среду, которая соответствует вашему личному стилю и предпочтениям. Благодаря простому в использовании интерфейсу и полной интеграции в Metatrader, вы теперь можете полностью контролировать внешний вид и восприятие ваших графиков / Бесплатная версия MT5 .
Особенности Полная настройка: Легко изменяйте цвет свечей и фон графика, чтобы отразить ваш уник
FREE

Function Indicate Buy Sell Signals Indicate Strength of Buy Sell Signals This system is for both type of traders (Short & Long Term) Instead of Other Calculations, Parabolic Sar & Awesome are also used In Any time frame this can be use. What is in for Trader? Trading Switch: Short Term & Long Term Finally, we all knows that Forex Trading needs completely concentrate & proper cash management, So I never promising that my program will never give you loss but I tried well to provide good and respo
FREE

Волатильность под контролем. Индикатор показывает оптимальную глубину для установки целей внутри дня и на среднем тренде. Также он строит опорные зоны для предполагаемой глубины коррекции. В качестве сопровождения отображаются ключевые уровни структуры по нескольким таймфреймам. Для расчёта используются классические индикаторы волатильности ATR & ADX на фиксированных таймфреймах. В расчётах учитывается спред, и если рынок слабо волатилен вы увидите предупреждение о риске. Можно менять цвет всех
FREE

Volume Profile – уникальный инструмент для анализа, предоставляющий трейдерам сложное представление о динамике рынка — отображая непрерывные колебания цен со временем. Это живое графическое представление систематизирует данные аукционов, раскрывая коллективные поведенческие паттерны, присущие движениям на рынке. В центре внимания находится Зона Значимости (Value Area), охватывающая ценовой диапазон, в котором происходит 68% торговой активности в течение дня. Эта зона, эквивалентная стандартному

O indicador TRIX, conforme o utilizado pelo grafista Didi Aguiar.
Este indicador é composto pela Triple Exponencial Average (TRIX), que neste setup é utilizada com o período 9, e um sinal de média simples do próprio indicador que é utilizado com o período 4.
Parâmetros: Período: 9 Sinal: 4
Os demais indicadores do sistema operacional de Didi Aguiar são:
Bollinger: período 8, desvio 2 ADX: período 8 DidiIndex com médias simples, períodos: 3, 8 e 20 Estocástico: 8, 3 3
FREE

Indicator measures strength of each currency in your list.
Main idea: It simply iterates through all combinations of pairs and adds difference between open and close in percent. Parameters: List of currencies - what currencies will be calculated (maximum is 8) Calculation type - from which data will be strength calculated Calculation data input - used as input related to calculation type Symbol suffix - used in case of suffix on symbols, e.g: when your symbols look like EURUSDm, EURUSDmicro et
FREE

MT5 версия | Индикатор Valable ZigZag | FAQ Волновая теория Эллиотта – это интерпретация процессов на финансовых рынках, которая опирается на визуальную модель волн на графиках цены. Согласно этой теории, мы точно можем знать какая тенденция преобладает сейчас на рынке, восходящая или нисходящая. Индикатор Valable ZigZag отображает волновую структуру рынка , а также говорит о направлении основного тренда в данный момент на текущем таймфрейме. Индикатор Trend Monitor VZ для в

Indicador "Trade Zones: Supply and Demand Opportunities" para MetaTrader: Eleva tu Trading con Precisión Estratégica El indicador "Trade Zones: Supply and Demand Opportunities" es una herramienta revolucionaria diseñada para potenciar la toma de decisiones de los traders al identificar claramente las zonas de oportunidad basadas en los principios fundamentales de oferta y demanda. Este indicador, compatible con MetaTrader, proporciona una visión intuitiva de las áreas críticas del mercado donde
FREE

Indicador "Supply and Demand Channels" para MetaTrader: Potencia tu Trading con Claridad y Precisión El indicador "Supply and Demand Channels" para MetaTrader es una herramienta avanzada diseñada para brindar a los traders una visión nítida y precisa de las zonas clave de oferta y demanda en el mercado. Basado en el principio fundamental de la ley de oferta y demanda, este indicador ofrece una interpretación gráfica única de las fuerzas que impulsan los movimientos de precios. Características De
FREE

Этот индикатор позволяет определять собственные паттерны, а не только широко распространенные и всеми используемые свечные модели как, например, свечи Doji. Как только вы покажете индикатору, какой паттерн вы ищете, он сразу же пройдется по всем предыдущим и будущим барам вашего графика, покажет выбранные модели и соберет статистику. Эта статистика включает в себя процент бычьих и медвежьих свечей, которые подходят по выбранную модель. Таким образом, пользователь будет иметь статистическое преим
FREE

McS Super Trend -This is one of the most popular classic trend indicators. It has a simple setting, allows you to work not only with the trend, but also displays the stop loss level, which is calculated by this indicator. Benefits:
Instruments: Currency pairs , stocks, commodities, indices, cryptocurrencies. Timeframe: М15 and higher. Trading time: Around the clock. Shows the direction of the current trend. Calculates the stop loss. It can be used when working with trading. Three types of no
FREE

How the Indicator Works:
This is a Multi-timeframe MA multimeter indicator which studies if price is above or below a particular EMA range and shows Red/Green/Yellow signals. Red: Price Below EMA range Green: Price above range Yellow: Price within range
Indicator Properties:
EMA Settings: - Default Period is 200. You can change all MA Settings like Period, MA Method (SMA, EMA, etc) or MA Applied Price (Close, Open, etc).
- EMA Range list is a comma separated value list for different timefr
FREE
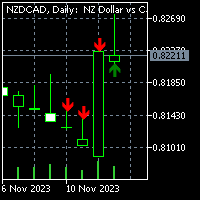
For MT5 version please click here . Introduction Most traders use candle patterns as a confirmation tool before entering a trade. As you know there are lots of candle patterns out there. However I realized most of them can be generalized in simple rules. So I developed my own candle pattern(Although I cannot say for sure this is mine). pattern description The pattern consists of three consecutive candles. This is true for most of the patterns out there (considering there is a confirmation nec
FREE

MACD (short for Moving Average Convergence/Divergence) is one of the most famous and oldest indicators ever created and is widely used among beginners . However, there is a newer version of the MACD that is named Impulse MACD which have less false signals than the standard MACD. Classic MACD helps us to identify potential trends by displaying crossovers between two lines. If MACD line crosses above the Signal line it shows us that the market is potentially up trending and that it would be a go

FREE FOR A LIMITED TIME ONLY!!! The Ultimate Indicator For Trading Trend This indicator clearly shows you the strength of the market in one direction or the other, which means that you can trade knowing you are either with or against the market. When used in conjunction with the +3R principles you are sure to have some serious results. The +3R Principles Routine - This is when you trade and how often Rules - This is the rule you follow Risk:Reward - This is the percentage amount of your accoun
FREE

Индикатор относится к средствам вероятностного анализа. Прогнозирование выполняется методом Монте Карло совместно с математической моделью нейрона. Но, моделирование образцов для метода производится не искусственно, а поставляется из оригинальной "натуры", то есть из истории. Количество образцов и детальность их моделирования достигается использованием младшего (относительного текущего) таймфрейма.
Алгоритм работы индикатора :
В общих чертах алгоритм сводится к тому, что индикатор обучает

Basic Fibonacci Calculation Indicator
shows Trend, Stoploss, Profit 1,2,3, will show you your daily Highs and your Daily Lows , it will also show you where it expects the price to move to. best time frame is H1 or higher .
For a better system that also includes my Non-repaint Indicator please check out my paid Fibo Indicator https://www.mql5.com/en/market/product/82323
FREE
Анализатор волатильности — это индикатор импульса, который извлекает выгоду из тенденции к сильному прорыву цены после консолидации в узком торговом диапазоне. Индикатор также использует осциллятор импульса, чтобы показать ожидаемое направление движения, когда происходит сжатие. Эта гистограмма колеблется вокруг нулевой линии, увеличение импульса выше нулевой линии указывает на возможность покупки длинной позиции, а падение импульса ниже нулевой линии может указывать на возможность продажи.
Когда вы работаете с несколькими активами и имеете несколько открытых позиций по активам, немного сложно визуализировать, когда прибыль или прибыль дает каждая активная проблема, поэтому с учетом этого мы разрабатываем этот индикатор, где он облегчает визуализацию операций с активами. , где вы сможете открыть несколько разных ресурсов и сможете визуализировать индивидуальный результат каждого актива и ускорить принятие решений в своем бизнесе.
FREE
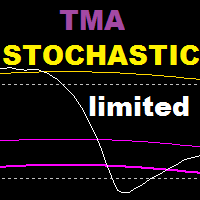
TMA Stochastic is an indicator based on stochastic oscillator and tma bands indicator , this indicator is based on a reversal strategy . Recommended time frame : 15 and above Recommended settings : lower values for scalping , higher values for swing trading WORKS ONLY ON EURUSD , GET THE FULL VERSION : https://www.mql5.com/en/market/product/108378 ======================================================================= Parameters : tma history : how many bars back to show tma bands on stochas
FREE

BeST_Gann Swing Oscillator is an MT4 indicator that is based on the corresponding work of Robert Krausz who introduced it in the book “ A.W.D Gann Treasure Discovered ” .
The Gann Swing Oscillator is a range-bounding technical indicator that oscillates between +1 and -1 and thus it describes the market swings.
Generally when the market is in an upswing, the Gann Swing Oscillator describes it as 2 higher highs with the value of +1 while after an upswing, the downswing is expected.
Also the do
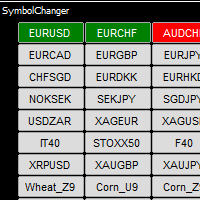
Symbol Chart Changer is an indicator/utility that offers you the option to switch between symbols and timeframes. You can choose any symbol and timeframe on the same chart with just a few clicks. In addition, this indicator also shows the profit of the symbol through the color of the buttons. For MT5: Symbol Chart Changer for MT5 Features
All symbols selected in MarketWatch, that allow you to monitor your favorite instruments on the same chart. Works smoothly on any symbol/instrument, accou
FREE

Индикатор показывает последние нетронутые уровни поддержки и сопротивления в виде горизонтальных линий. Индикатор может показывать уровни поддержки/сопротивления с более высоких таймфреймов. С помощью данного индикатора вы легко можете увидеть уровни поддержки/сопротивления с таймфреймов H4, D1 и W1 на графике H1, что может быть большим преимуществом при поиске возможностей входа на H1. Это полная версия индикатора: Support Resistance Multi Time Frame FREE
Параметры referenceTF: таймфрейм для

Big summer sale. Save up to 40% on my products. Supply & Demand dashboard - save 10$! The Netsrac Supply&Demand Dashboard shows you at a glance where relevant zones are located on your favorite assets. Open your chart directly from the dashboard and trade zones that really matter. Features
Finds the next relevant supply and demand zone and displays the distance to this zone (in pips) Finds and displays the zones in three different timeframes Calculates a trend indicator for the current and past

Scalper Zoom - новая торговая система которая создана для того, чтобы упростить процесс торговли на рынке форекс как новичкам, так и профессионалам. Индикатор Scalper Zoom использует адаптационный метод работы и анализирует рынок с помощью нескольких торговых алгоритмов, выбирая при этом максимально эффективный для данной валютной пары и данного таймфрейма. Работать с данный индикатором очень просто. При появлении красной вертикальной линии, открываем ордер на продажу. Закрываем его при появлени

Друзья, представляем Вашему вниманию наш новый индикатор Forex Gump Laser. Так как у нас в команде нет дизайнеров, а в основном мы математики, финансисты, программисты и трейдеры, то особых изменений в дизайне индикатора мы не делали. С виду он напоминает привычный Вам Forex Gump. С другой стороны Forex Gump стал уже не просто названием индикатора, это бренд. И мы пытаемся во всех его разновидностях сохранить фирменный стиль. Вся суть индикатора в его алгоритмах работы и формулах, которые отвеча
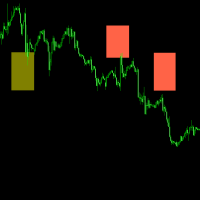
The indicator is very effective in currency exchange, for example EURUSD GBPUSD AUDUSD NZDUSD USDCHF USDCAD and it is very easy to identify the position of top and bottom. Suggest using it on the MT4 platform of SwissQuote Bank.
SwissQuote Link: https://trade.swissquote.ch/signup/public/form/full/fx/com/individual?lang=cn&partnerid=daf9af43-2f95-443e-86c5-89ce1ab2bd63#full/fx/com/individual/step1
Exness Link: https://one.exness.link/a/t2v0o2v0
With a little understanding of trading and the
FREE

Leo Trend - это сигнальный индикатор, который показывает на графике в виде стрелок и линий моменты входа в рынок, а так же направление тренда и флета. Leo Trend будет полезен как новичкам создающим торговую стратегию, так и профессионалам для интеграции в уже готовые торговые системы. Leo Trend работает без перерисовок и без существенных опозданий. Как работает индикатор мы продемонстрировали на видео. Кроме того, Вы можете протестировать данный индикатор в тестере стратегий абсолютно бесплатно.

The ADX Indicator is known to be used to determine the trend direction. Not only that, but it also has deviation (+DI and -DI) that determine the direction of the trend as well. The role of the indicator is to spot the trend and its direction and generate signals accordingly.
Indicator Settings: - ADX period : default is 14 periods (it works best with the timeframe H1). - Signal Width : the size of signals arrows. - Signal Distance : the distance of the signal arrow from the candle. - Signal c
FREE

The "Dagangduit Spread Indicator" is a versatile tool designed to provide traders with essential information about the current spread in the chart window. This indicator offers customizable features, including font parameters, display location on the chart, spread normalization, and alerts to enhance your trading experience. Key Features: Real-time Spread Display : The indicator displays the current spread in real-time on your trading chart, allowing you to stay informed about the cost of execut
FREE
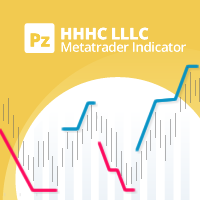
Пользовательская реализация известного трендового принципа "более высокий максимум - более высокая цена закрытия и более низкий минимум - более низкая цена закрытия" (higher high, higher close, lower low, lower close: HHHC - HHHL). Индикатор использует движение цены для определения направления тренда, его смены и зон отката. Настраиваемый период прорыва Настраиваемые цвета и размеры Не перерисовывается, не меняет значений Доступны все типы алертов. Отображает три ценовые зоны: Зоны на покупку от
FREE

Overview
The Volume SuperTrend AI is an advanced technical indicator used to predict trends in price movements by utilizing a combination of traditional SuperTrend calculation and AI techniques, particularly the k-nearest neighbors (KNN) algorithm.
The Volume SuperTrend AI is designed to provide traders with insights into potential market trends, using both volume-weighted moving averages (VWMA) and the k-nearest neighbors (KNN) algorithm. By combining these approaches, the indicat

Индикатор сканирует до 30 торговых инструментов и до 8 таймфреймов на наличие высоковероятностных моделей паттерна Двойная вершина/дно с ложными прорывами . Концепция индикатора Ultimate Double Top/Bottom и профессиональный способ его применения подробно описаны в блоге (на английском языке): Professional Trading With Double Tops/Bottoms And Divergences! Эта бесплатная версия работает только на EURUSD и GBPUSD. Полная версия индикатора доступна по ссылке: Ultimate Double Top Bottom Reversal Scan
FREE

14 Indicators and auxiliary tools for convenient trading This utility contains 14 additional tools that can be useful for certain actions of the trader, thereby simplifying and speeding up the trading process. My #1 Utility : includes 65+ functions | Contact me if you have any questions Due to the different monitor resolutions, some users may encounter the fact that the labels will be displayed with an overlay or be too small. If you encounter such a problem, you can adjust the font size

This indicator show candle time remaining. The remaining time of the candle is calculated every 200 milliseconds. 1. You can set x (horizontal), y (vertical) of text. 2. You can set font, color, size of text. 3. You can remove the text without having to remove the indicator from the chart. The remaining time of the candle depends on the timeframe of the chart with the indicator.
FREE

"Drivers Road Bands" indicator that is designed to be used in the 1H, 4H and 1D timeframes in the most ideal way. If we compare timeframes to roads and streets; main streets and highways with high traffic volume are similar to high-time timeframes in technical analysis. If you can interpret the curvilinear and linear lines drawn by this indicator on the graphic screen with your geometric perspective and develop your own buy and sell strategies; you may have the key to being a successful trader.
FREE

Defining Range ( DR ) and Implied Defining Range ( IDR ) indicator
Show DR and IDR ranges on the chart for Regular , Overnight and After Sessions
for more information how DR and IDR work and the high probability watch : https://www.youtube.com/@themas7er or https://twitter.com/IamMas7er
Remember to set set your chart TimeZone when you attach indicator to the chart under indicator settings / inputs
Volume Imbalance : https://www.mql5.com/en/market/product/91165?source=Site+Pr
FREE

updated hidden market support and resistance. this indicator is made for new current market that has new support and resistance that some traders struggle to see. The indicator works on all timeframes from the 1-minute timeframe to the monthly One Trading tip to use When price is at resistance and the indicator appears wait for a bearish candle to close then enter a sell trade. Same applies for a buy trade when price reaches support level, and the indicator appears wait for the bullish candle
FREE

This indicator will show week and monthhigh low, very useful to understand the market sentiment. To trade within the range/ break out. Low- can act as support- can used for pull back or break out High- can act as resistance- can used for pull back or break out Breakout strategy refers to the day trading technique that provides traders with multiple opportunities to go either long or short . The main idea is to identify the trend in its most juicy state followed by a trending move.
FREE
Я являюсь поклонником индикаторов скользящих средних. Если вы тоже поклонник скользящих средних, то обнаружите, что XPMA (XP MOVING AVERAGE) собирает самые распространенные скользящие средние в одном индикаторе. Простая скользящая средняя, экспоненциальная скользящая средняя, сглаженная скользящая средняя, линейно-взвешенная скользящая средняя, двойная экспоненциальная скользящая средняя, тройная экспоненциальная скользящая средняя, Т3 скользящая средняя и другие. К тому же он окрашивает/преду

Целью этой новой версии стандартного MT4 индикатора, входящего в поставку платформы, является отображение в подокне нескольких таймфреймах одного и того же индикатора. См. пример, приведенный на рисунке ниже. Однако индикатор отражается не как простой индикатор MTF. Это реальное отображение индикатора на его таймфрейме. Доступные настройки в индикаторе FFx: Выбор таймфрейма для отображения (от M1 до MN) Установка ширины (количество баров) для каждого окна таймфрейма Всплывающее оповещение/звуков
FREE

As per name Strength, This Indicator is a affordable trading tool because with the help of Popular Developers & Support of M Q L Platform I have programmed this strategy. I tried to input different types and different periods of Calculation regarding Support Resistance, Trends, Trend lines, Currency Strength, Oversold and Overbought Indications for good results. Furthermore, I have also care about Adjustable Settings So Trader can easily get in touch with market in another way also. What
FREE

The XR Gartley Pattern MT4 is an indicator which displays and alerts Gartley pattern detected on the candlestick chart. It also displays potential trade with calculated Take Profit and Stop Loss, Timeframe H1. After purchasing XR Gartley Pattern, you can immediately download this indicator from the MT4-MT5 Market and start using it because all features are set to default, is not necessary to change any parameter. In addition, we have created a private group for customers who have purchased one
FREE
Индикатор линий сил валют (Currency Strength Lines, CSL) - это весьма полезный инструмент как для начинающих, так и для опытных трейдеров. Он способен рассчитывать силы одиночных валют и отображать их на графике, чтобы вы могли видеть тренд и замечать торговые возможности.
Как она работает? Индикатор CSL проводит расчеты на 28 парах, показывая общую силу по всем одиночным валютам на рынке в любой заданный момент. Вы можете использовать эти данные для определения валют, которые сильны, усиливаю
FREE
MetaTrader Маркет - единственный магазин, где можно скачать демоверсию торгового робота и подвергнуть его проверке и даже оптимизации на исторических данных.
Прочитайте описание и отзывы других покупателей на заинтересовавший вас продукт, скачайте его прямо в терминал и узнайте, как протестировать торгового робота перед покупкой. Только у нас вы можете получить представление о программе, не заплатив за неё.
Вы упускаете торговые возможности:
- Бесплатные приложения для трейдинга
- 8 000+ сигналов для копирования
- Экономические новости для анализа финансовых рынков
Регистрация
Вход
Если у вас нет учетной записи, зарегистрируйтесь
Для авторизации и пользования сайтом MQL5.com необходимо разрешить использование файлов Сookie.
Пожалуйста, включите в вашем браузере данную настройку, иначе вы не сможете авторизоваться.