Смотри обучающее видео по маркету на YouTube
Как купить торгового робота или индикатор
Запусти робота на
виртуальном хостинге
виртуальном хостинге
Протестируй индикатор/робота перед покупкой
Хочешь зарабатывать в Маркете?
Как подать продукт, чтобы его покупали
Технические индикаторы для MetaTrader 4 - 16

This indicator is stand alone version from MP Pivot Levels (All in one) containing Demark's Pivots.
Calculations: PP = X / 4 R1 = X / 2 - LOWprev S1 = X / 2 - HIGHprev Uses: When the pair currency price may change the direction of movement. Possible constraints of support and resistance that creates plateaus for the currency pair prices. Tendency identification by comparing the present prices according to current day's pivot point and also the prior day's pivot points. ___________
FREE

Индикатор PipTick OHLC показывает текущие и исторические значения минимума, максимума, открытия, закрытия и средне цены на выбранном периоде. Он может отображать текущие значения или значения за предыдущую сессию. Диапазоном для расчета индикатора может быть дневная, недельная, месячная или любая выбранная пользователем сессия.
Уровни Максимум текущей или предыдущей сессии. Минимум текущей или предыдущей сессии. Открытие текущей или предыдущей сессии. Закрытие текущей или предыдущей сессии. Ср
FREE

SPREADEX e' un indicatore per MT4 e MT5 che indica la distanza dell'ASSET dal GP. il GP e' il prezzo del vero valore dell'ASSET sottostante ottenuto per stima. Il GP e' come una calamita, attira il prezzo dell'ASSET con alta probabilita' ed all'interno della stessa giornata di trading. Quindi SPREADEX indica quali sono gli asset piu distanti dal GP al momento in tempo reale. Fornendo un punto di vista al TRADER su quali asset concentrarsi e cercare eventuali segnali di inversione dei prezzi per
FREE

Индикатор Volatility Ratio был разработан Джеком Сваггером для определения торговых диапазонов и поиска возможных пробоев. Коэффициент волатильности определен как истинный диапазон (True Range) текущего дня поделенный на истинный диапазон (True Range) за определенное количество дней (т.е. N периодов). Для расчета коэффициента волатильности используется следующая формула: Коэффициент волатильности (VR) = True Range за текущий день/True Range за N дней Истинный диапазон True Range рассчитывается п
FREE

This indicator will show week and monthhigh low, very useful to understand the market sentiment. To trade within the range/ break out. Low- can act as support- can used for pull back or break out High- can act as resistance- can used for pull back or break out Breakout strategy refers to the day trading technique that provides traders with multiple opportunities to go either long or short . The main idea is to identify the trend in its most juicy state followed by a trending move.
FREE
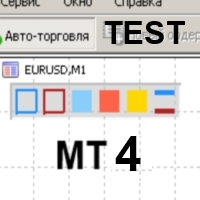
Color Levels - удобный инструмент для тех, кто использует технический анализ с использованием таких инструментов, как Трендовая линия и Прямоугольник. Имеется возможность настройки двух пустых прямоугольников, трех закрашенных и двух трендовых линий. Настройки индикатора крайне просты и делятся на пронумерованные блоки: С цифрами 1 и 2 вначале - настройки пустых прямоугольников (рамок); С цифрами 3, 4 и 5 - настройки закрашенных прямоугольников; С цифрами 6 и 7 - настройки трендовых линий. Объе
FREE

Just another plain Super Trend indicator.
On this one i have added another buffer (on index 2) which can be used on EA; the values is -1 to identify a bearish trend while for bullish trend the value is 1.
Here a code snippet:
int trend = ( int ) iCustom ( NULL , Timeframe, "SuperTrend" , Period , Multiplier, 2 , 1 ); It work on every timeframe.
If you need help to integrate it on your EA, don't hesitate to contact me.
FREE

本指标 基于 Zigzag 基础上... 增加了: 1.增加了箭头指示,使图表更鲜明 2.增加了价格显示,使大家更清楚的看清价格. 3.增加了报警等设置,可以支持邮件发送 原指标特性: 1.基本的波段指标构型. 2.最近的2个ZIGZAG点不具有稳定性,随着行情而改变,(就是网友所说的未来函数) 3.原指标适合分析历史拐点,波段特性,对于价格波动有一定的指导性.
Zigzag的使用方法一 丈量一段行情的起点和终点 (1)用ZigZag标注的折点作为起点和终点之后,行情的走势方向就被确立了(空头趋势); (2)根据道氏理论的逻辑,行情会按照波峰浪谷的锯齿形运行,行情确立之后会走回撤行情,回撤的过程中ZigZag会再次形成折点,就是回撤点; (3)在回撤点选择机会进场,等待行情再次启动,止损可以放到回撤的高点。 一套交易系统基本的框架就建立起来了。 Zigzag的使用方法二 作为画趋势线的连接点 趋势线是很常见的技术指标,在技术分析中被广泛地使用。 但一直以来趋势线在实战中都存在一个BUG,那就是难以保证划线的一致性。 在图表上有很多的高低点,到底该连接哪一个呢?不同的书上画趋势线的方
FREE

Informative & optimized Zigzag, Accumulated volume, Price change A rewrite of the traditional zigzag tool with new additions. Features:- Optimized code Displays accumulated volume between peaks Displays price change between peaks Usage:- Identify trend swings Identify high volume swings Compare price changes between swings Drawing Fibonacci tool on strong price change or high volume swings
FREE

You can find full version here: Harmonic Pattern Scanner MT4 Harmonic Pattern Scanner MT5 Introduction Harmonic Patterns are best used to predict turning point. Harmonic Patterns give you high win rate and high opportunities for trade in during one day. This indicator detects the best and successful patterns base on Harmonic Trading books by Mr. Scott M.. Main Features Detect the best and most successful patterns : Gartley, Bat, Crab, Butterfly, Cypher, Shark, Alt_Bat, Deep_Crab Easy-
FREE

(Перевод Google) Стандартное представление свечи Heikin Ashi имеет значение открытия, эквивалентное экспоненциальному показателю. Скользящее среднее (EMA) от Общей цены , из которых альфа значение EMA является фиксированным с периодом 0,5 (эквивалентно периоду EMA 3,0). В этой динамической версии период может быть изменен на любое значение, которое вы хотите использовать, что также позволяет приблизительный анализ нескольких таймфреймов или используйте минимальное или максимальное значение в кач
FREE
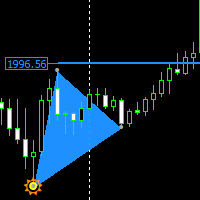
Non-repaint price action pattern based indicator works on all timeframe the indicator is based on a 123 Triangle pattern that happens everyday on the market the indicator will point out the pattern for you and you can turn on Fib level to see your take profit. Blue triangle is a buy signal Red triangle is a sell signal horizonal blue and red lines is an indication to place your trail stop loss one price has reached that area only entry when the triangle has fully formed

Price Channels are also known as Donchian Channels being named after Richard Donchian. They use the highest and lowest price of a set number of periods to create an upper and lower channel or envelope around the price. The upper channel shows the high of the number of periods chosen. The lower channel shows the low of the number of periods chosen. For example, the screenshot shows the Price Channels using 320 periods. The upper channel in the screenshot shows the highest high of the previous 3
FREE
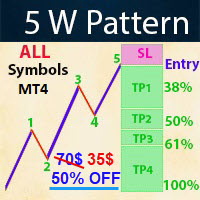
- Real price is 70$ - 50% Discount ( It is 35$ now )
Contact me for instruction, any questions! Introduction The Elliott Wave in technical analysis describes price movements in the financial market that are related to changes in trader sentiment and psychology. The 5 W Pattern (Known as 3 Drives) is an Elliott Wave pattern that is formed by 5 consecutive symmetrical moves up or down. In its bullish form, the market is making 5 drives to a bottom before an uptrend forms. In a bearish 5-d

RoundNumbers indicator is a simple and powerful psychological price levels. Trader usually use these levels as a Support and Resistance (SnR). Indicator Input: Levels - Numbers of levels drawn on chart. Default 30 levels. BoxSize - Box size drawn on each levels, indicate buffers around levels. Default value 1pips (10point) above and below each levels. ZoneSize - Distance between each levels, default value 10pips (100point). Style & Colours - User inputs customization.
For MT5 version, please r
FREE
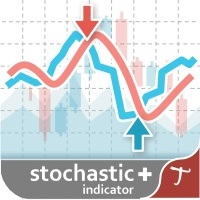
Tipu Stochastic - это модифицированная версия оригинального стохастического осциллятора, опубликованного компанией MetaQuotes здесь .
Особенности Три типа сигнала (развороты, пересечение основного сигнала, пересечение перекупленности/перепроданности). Настраиваемые оповещение о сигналах на покупку/продажу, push-уведомления, оповещения по email и всплывающее сообщение на экране. Отмечает уровни перекупленности и перепроданности. Добавьте Tipu Panel (находится здесь ) и разблокируйте дополнитель

Tired of using the same technical indicators? The "Tekno RSI" is an innovative tool designed to make the interpretation of the Relative Strength Index (RSI) more intuitive and accessible to traders of all levels. It displays the RSI as a 3-color histogram, providing a clear and intuitive visual representation of market conditions.
1)Key Features 3-Color Histogram: RSI is a versatile indicator providing insights into market direction and potential reversal points. However, when analyzing the ch
FREE

O indicador criado por Didi Aguiar, o mestre das Agulhadas!
O padrão do indicador é o cruzamento de três médias móveis simples. Média rápida, período 3. Média normalizada, período 8. Média lenta, período 20.
Quando as três médias se cruzam próximas o suficiente, acontece a agulhada! Pela posição das médias é possível identificar: Agulhada de compra, agulhada de venda, ponto falso e beijo da mulher aranha.
Quer saber mais? Procure pelo site dos robôs oficiais da Dojistar: tradesystembots.co
FREE

Это усредненный указатель класса, основанный на пользовательском алгоритме алгоритма, в соответствии с диапазоном цветов, помеченных вверх и вниз, может быть открыт или закрыт, чтобы подсказать, что в настоящее время следует повесить покупку или продажу.
описание списка параметров:
Extern int Price = 0; / / indicator начальный расчет средней цены
Extern int Length = 20; / / indicator вычисляет средний период, эквивалентный среднему периоду MA.
Extern int Displace = 0;
FREE
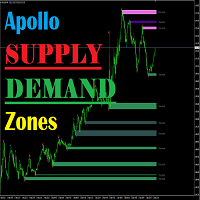
Apollo Supply Demand Zones - это индикатор, который рассчитывает уровни поддержки и сопротивления. Индикатор будет полезен абсолютно всем трейдерам, вне зависимости от того какую стратегию они используют. Данный индикатор может стать одним из основных элементов вашей торговой системы. Индикатор рассчитывает уровни как на текущем тайм фрейме, так и может работать в режиме MTF, отображая уровни с более высокого тайм фрейма. Данный индикатор может использоваться абсолютно на любом тайм фрейме и с л
Индикатор Macd 2 линии с торговыми стрелками.
Включает :
Сигнал MACD и линия MACD 2-цветная гистограмма 0 уровень возможные торговые стрелки Как читать :
Индикатор покажет вам стрелку после того, как произошло пересечение, и быстрая линия пройдет выше или ниже нулевой линии! Используйте надлежащее управление рисками и не торгуйте на новостях о высокой волатильности!
ПОСМОТРЕТЬ ДРУГИЕ ПРОДУКТЫ: https://www.mql5.com/en/users/gabedk/seller
FREE

Volume Champion — индикатор, который анализирует объем рынка и отображает данные в виде гистограммы. Вам не нужно углубляться в теорию анализа рынка. Вы можете просто следить за показаниями индикатора. Столбцы индикатора показывают потенциальное направление движения цены на основе анализа структуры объема рынка. Индикатор может использоваться на любом тайм фрейме. Наибольшая точность достигается на старших тайм фреймах. СИГНАЛЫ НЕ ПЕРЕРИСОВЫВАЮТСЯ! Технически индикатор можно использовать и с др

"Turbo Helper for scalping" - полностью готовая торговая система. Показывает трейдеру стрелкой на графике когда нужно открывать ордер и в каком направлении. Так же показывает трейдеру квадратным символом, когда сделку нужно закрыть. После этого индикатор выводит на график предположительное количество пунктов по сделке. Это значение может немного отличаться, так как индикатор не учитывает реальный размер спреда и свопа Вашего брокера. Но размер спреда, для более точного подсчета можно указывать в

The Donchian channel is an indicator that takes a series of user-defined periods and calculates the upper and lower bands. Draw two lines on the graph according to the Donchian channel formula. This straightforward formula is based on:
The top line is the highest price for the last periods n The bottom line is the lowest price for the last periods n
Trend systems follow periods when support and resistance levels are broken. in this case when the price breaks the upper line or the lower line
FREE
Oscillators and Volatility: Oscillators like RSI and Stochastic are particularly useful in assessing the market sentiment and potential turning points in volatility. However, it's essential to use them in conjunction with other indicators and analyses for a comprehensive view. Divergences between price movements and oscillator readings can be powerful signals. For example, if a volatility index is making new highs, but the oscillator fails to confirm these highs, it may indicate weakening momen
FREE

The Pivot Indicator is a vital tool for technical analysis used by traders in the financial markets. Designed to assist in identifying potential reversal points or trend changes, this indicator provides valuable insights into key levels in the market. Key features of the Pivot Indicator include: Automatic Calculations: The Pivot Indicator automatically calculates Pivot Point, Support, and Resistance levels based on the previous period's high, low, and close prices. This eliminates the complexity
FREE

Индикатор для скальпинга 2 в 1. Покупая этот индикатор, Вы получаете в подарок автоматического робота! Автоматическая система поиска точек разворота цены. Индикатор точками на графике валютной пары показывает вероятноные точки разворота движения цены. Красная точка указывает на разворота движения внизу, а синяя точка указывает на разворот движения цены вверх. Индикатор отлично подходит для торговли внутри дня по стратегии скальпинга. Идеально сочетается с канальными индикаторами. Когда канальны

VWAP and Moving Average A combination of Supertrend and Moving Average to create a converging trade setup Input parameters: signal mode: set it to true if you want to plug it into STAT (Signal Tester and Trader) arrow shift: distance between fast EMA line to arrow on chart turn on moving average signal for converging setup VWAP period MA period MA averaging method MA pricing method upper level limit ( VWAP ) lower level limit ( VWAP ) You can find the best setting for 4 hour EURUSD on this v
FREE

Мультивалютный и мультитаймфреймовый индикатор ZigZag. Отображает текущее направление рынка, высоту последнего движения, количество баров в этом движении и пробитие предыдущей точки ЗигЗага.
В параметрах вы можете указать любые желаемые валюты и таймфреймы. Также панель может отправлять уведомления при изменении направления ЗигЗага или когда произошел пробой предыдущей точки. По клику на ячейке с периодом будет открыт данный символ и период.
Параметры Depth — минимум свечей, на котором инди
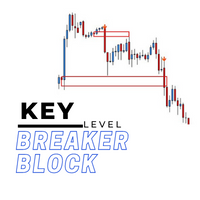
The key level breaker block indicator automatically draws breaker blocks for you on the chart. Breaker blocks are, in short, failed order blocks, but create strong support and resistance zones when price comes back to re-test them.
Advantages
The key level breaker block DOES NOT RE-PAINT, giving you confidence when a signal appears and also helps when looking back. The key level breaker block includes an on/off button on the chart to easily keep the charts clean after analysis by just o

O Touch VWAP é um indicador que permite calcular uma Média Ponderada por Volume (VWAP) apenas apertando a tecla 'w' no seu teclado e após clicando no candle do qual deseja realizar o calculo, clicando abaixo do candle é calculada a VWAP baseado na minima dos preços com o volume, clicando sobre o corpo do candle é calculado uma VWAP sobre o preço medio com o volume e clicando acima do candle é calculado uma VWAP baseado na máxima dos preços com o volume, voce tambem tem a opção de remover a VWAP
FREE

RECOMMEHDATION Trade with this indicator for 2-3 weeks and you will feel significant progress in your trading. This indicator is developed based on the use of HMA, Laguerre, CCI . Indicator will help you: accurately enter the market; reduce the number of errors when opeinng orders; visually see market movement; predict price movement(in absent of significant news); do not rush to close profitable trades prematurely and increase profit; do not rush to enter the market and wait for "easy prey".
FREE

Round Numbers Levels indicator for MT4 Round Numbers indicator is a simple but useful indicator to draw 00 and 50 price levels in your chart.
These levels act as supports and resistances, and therefore should be taken into account when trading.
These levels can be used as profit targets or entry points.
Inputs of the indicator are:
TGridColor00: color to be used for xx00 levels GridStyle00: line style to be used for xx00 levels GridWidth00: line width to be used for xx00 levels GridCol
FREE
Highly configurable Macd indicator.
Features: Highly customizable alert functions (at levels, crosses, direction changes via email, push, sound, popup) Multi timeframe ability Color customization (at levels, crosses, direction changes) Linear interpolation and histogram mode options Works on strategy tester in multi timeframe mode (at weekend without ticks also) Adjustable Levels Parameters:
Stochastic RSI Timeframe: You can set the lower/higher timeframes for Stochastic RSI. Stochastic RSI
FREE

WHAT IS NEXT MOVE? SIMPLE ANSWER IS, THIS PROGRAM IS BASED ON PRICE ACTION THEREFORE FINDING NEXT MOVE IS EASY TO IDENTIFY THIS PROGRAM IS USING STANDARD CALCULATIONS FOR SUPPORT RESISTANCE IN SHAPE OF 2 WAYS TREND LINES SELECT HORIZONTAL LINES TREND LINES WILL GUIDE TRADERS TO TRADE IN RANGE WITH PIVOT LEVEL ALSO HORIZONTAL LINES GUIDE YOU ABOUT SUPPORT RESISTANCE OF DIFFERENT TIMEFRAMES FOR EXAMPLE: IF TRADER INTERESTED TO TRADE IN 15 MINUTES TIME FRAME, THEN HE CAN SELECT 15 MINUTES IN PR
FREE

False Breakout Stochastic to be used with our Elliott Wave Indicator as part of the overall strategy on trading the 5th wave.
As we cannot upload multiple files, we have listed this separately. False Breakout Stochastic is best used as a confirmation tool rather than the sole signal indicator The Elliott Wave Indicator Suite is designed around a simple but effective Swing Trading Strategy. The Indicator Suite is great for Stocks, Futures and Forex trading on multiple timeframes You can find the
FREE
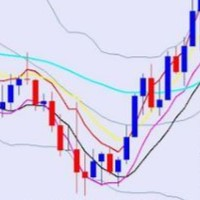
BBMA Terdiri dari indikator BB dan 5 Moving Averages, BBMA Oma Ally (OA) merupakan sistem trading buatan seorang trader asal Malaysia bernama Oma Ally. Setelah melalui penelitian dan pengujian selama bertahun-tahun, beliau membantu banyak trader sejak 2010 dengan sistem ciptaannya ini.
Di kalangan trader Indonesia sendiri, BBMA OA sudah mulai populer sejak beberapa tahun lalu. Saking populernya, sistem trading ini sampai mempunyai komunitas khusus gabungan trader dari beberapa negara.
Men
FREE
XE Forex Strengh Indicator MT4 displays visual information about direction and strength of a signal for current pair and chosen timeframes (M5, M15, M30 and H1). Calculations are based on multiple factors and results are shown as a colored panel with scale bar, numerical values and arrows. There are also displayed values of current price and spread on the pair. There can be activated an alert (as a mail or pop-up window with sound) for each available timeframes which send a message when the dir
FREE

Symmetrical Triangle Pattern Indicator - Mastering Trend Recognition in MetaTrader Unlock the power of trend recognition with the "Symmetrical Triangle Pattern" indicator for MetaTrader. This innovative tool simplifies the identification of symmetrical triangle patterns, providing traders with clear signals for potential trend continuation or reversal. Elevate your trading strategies with this MQL offering. Key Features : Accurate Pattern Recognition : The Symmetrical Triangle Pattern Indicator
FREE
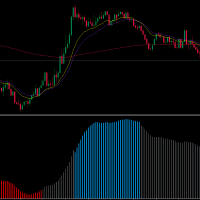
Welcome traders, MA SLOPE SCALPER is a really powerfoul tool to boost up your scalping! Have you been struggling with your scalping Strategies? Have you tried price action? Well, it does not work. Have you tried Rsi - Reversal Strategies? Well it'is not a clever idea. MA SLPOPE SCALPER IS A TREND FOLLOWER SYSTEM MA SLOPE SCALPER is based upon 3 different Exponential Moving averages that have bees studied and selected in order to maximize the precision of the signals! Ma SLOPE SCALPER has an
FREE

А. Что такое A2SR? * Это опережающий технический индикатор (без перерисовки, без запаздывания) .
-- Учебники :
-- на https://www.mql5.com/ru/blogs/post/734748/page4#comment_16532516
-- и https://www.mql5.com/ru/users/yohana/blog A2SR имеет особую технику определения уровней Поддержки (спроса) и Сопротивления (предложения). В отличие от обычного способа, который мы видели в сети, A2SR имеет оригинальную концепцию определения фактических уровней SR. Оригинальная техника не была взята из Инт

Индикатор для бинарных опцыонов стрелочный прост в использовании и не требует настройки работает на всех валютных парах акцыях крипто валюте сигнал на покупку синяя стрелка вверх сигнал на продажу красная стрелка в низ советы не стоит торговать во время новостей и за 15-30 минут перед их выходом так как рынок слишком волотилен и очень много шума входить в сделки стоит на одну или две свечи от текущего периода ( рекомендуется на 1 свечу ) таймфрейм до м 15 рекомендуемый мани менеджмент фиксир

Idea: RSI ( Relative Strength Index) and CCI ( Commodity Channel Index ) are powerfull to solved the market. This indicator has Smoothed Algorithmic signal of RSI and CCI. So that, it separates the market into buy and sell zones, these areas are marked with arrows, red for downtrend, green for uptrend. This algorithm has the effect of predicting the next trend based on the historical trend, so users need to be cautious when the trend has gone many candles. Please visit screenshots

This Indicator uses Center of Gravity (COG) Indicator to find you the best trades.
It is a reversal based Swing Indicator which contains an Arrows Indicator. That you can buy here from Metatrader Market. And a scanner Indicator. Free Download here: https://abiroid.com/product/abiroid-sway-cog
Scanner needs arrows indicator to run. Copy scanner ex4 in same folder as your Arrows Indicator: MQL4/Indicators/Market/ All extra indicators and templates also available in above link. Base Strategy:

Volume Horizon - это индикатор горизонтальных объёмов, предоставляющий возможность наблюдать за плотностью объёмов участников рынка в различных ценовых и временных интервалах. Гистограммы объёмов могут быть построены на основе восходящих или нисходящих волн рынка, а также по отдельным барам. Этот инструмент позволяет более точно определять моменты для открытия или закрытия позиций, опираясь на уровни максимальных объёмов или средневзвешенные цены по объёму.
Что делает Volume Horizon уникальны

PipTick Heiken Ashi - это наша версия индикатора Heiken Ashi. В отличие от конкурирующих продуктов, этот индикатор предлагает широкие возможности для расчета свечей Heiken Ashi. Он может отображаться в классическом или сглаженном виде. Данный индикатор рассчитывает Heiken Ashi со скользящей средней четырьмя способами: SMA - простая скользящая средняя SMMA - сглаженная скользящая средняя EMA - экспоненциальная скользящая средняя LWMA - линейно-взвешенная скользящая средняя
Основные характеристи
FREE

Если вам нравится этот проект, оставьте 5-звездочный обзор. Следуйте на instagram: borelatech Как институционалы торгуют большими объемами, для них не должно пытаться
защищать свою позицию на определенных процентных уровнях. Эти уровни будут служить естественной поддержкой и устойчивостью, которую вы
можете использовать
либо войти в торговлю или быть в курсе возможных опасностей против вашей
позиции. Пример общего используемого процента составляет 0,25% и 0,50% на EURUSD для
неделя, вы мо
FREE
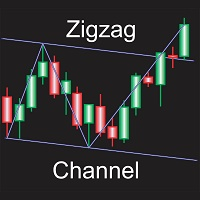
Automatically draws channel base on zigzag, with option to draw zigzag based on candle wicks or close prices. All zigzag parameters can be adjusted in settings, option to display or hide zigzag also available, every other adjustable settings are self explanatory by their name, or at least so I believe. Only download this indicator if you need a program to automatically plot channels for you based on zigzag of any specific settings.
FREE
This automated VOLUME SCALPING INDICATOR can be utilized to manage trades and identify potential areas of support and resistance for both buying and selling. It is designed to identify zones for Sell/Buy trades based on the volume analysis and can be effectively used in conjunction with other indicators, such as order block indicators, and more. Currently designed for MT4, it will later be adapted to function on MT5. We also offer the opportunity to customize the robot according to your trading
FREE

This all-in-one indicator displays real-time market structure (internal & swing BOS / CHoCH), order blocks, premium & discount zones, equal highs & lows, and much more...allowing traders to automatically mark up their charts with widely used price action methodologies. Following the release of our Fair Value Gap script, we received numerous requests from our community to release more features in the same category. //------------------------------------// Version 1.x has missing functions + PDAr

Anchored Volume Weighted Average Price (AVWAP, or Anchored VWAP). Tells you who is in control, the buyers or the sellers. Better than all other moving averages because it adds weight to the traded volume. This technique was made popular by Brian Shannon of Alphatrends. It is calculated by multiplying typical price by volume, and the dividing by total volume. It is very simple to use. 1. Press a number from 1 to 9 on the keyboard, then click the chart where you want to anchor the VWAP. 3. Hold C

В сочетании с диаграммой Delta Footprint Chart вы получите полное представление о профиле объема рынка:
https://www.mql5.com/en/market/product/94153 Индикатор «Книга ордеров» отображает гистограмму на ценовом графике, представляющую кластеры объема спроса и предложения.
Индикатор анализирует исторические ценовые данные и рассчитывает кластеры объемов спроса и предложения для каждого ценового уровня в пределах заданного количества баров. Кластеры объема предложения показаны синим цветом, а

The 5X target indicator is an indicator that plots the optimal entry zone and the target for the trading day. It also plots a level where the stoploss can be moved to breakeven for a risk free trade which is 2X. This indicator has time window inputs. The default settings are from 02:00 to 19:00 CET+1 time zone. This indicator is based used with a direction bias for the day. I post the direction bias for several pairs in the comments section. Added a new feature Time Zone to help trade the highes
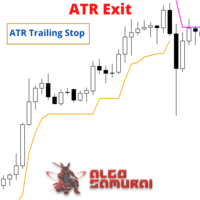
The ATR Exit indicator uses the candle close + ATR value to draw trailing stop lines (orange under buys, magenta over sells) that advance with the trend until the trend changes direction. It uses a multiple of the Average True Range (ATR), subtracting it’s value from the close on buy, adding its value to the close on sell. Moreover, the trailing stop lines are generated to support the order’s trend direction (long or short): In an upward trend, the long trailing stop line (orange line under bu
FREE

MACD Intraday Trend PRO - это индикатор, разработанный на основе адаптации оригинального MACD, созданного Джеральдом Аппелем в 1960-х годах.
За годы торговли было замечено, что, изменяя параметры MACD с пропорциями Фибоначчи, мы достигаем лучшего представления непрерывности движений тренда, что позволяет более эффективно обнаруживать начало и конец ценового тренда.
Благодаря своей эффективности в обнаружении ценовых тенденций, также можно очень четко идентифицировать расхождения вершин и ос

This simple indicator paints with a darker color on the volume bar when the quantity traded is above the average of select number of periods of the volume itself, highlighting the moments when there was a large volume of deals above the average. It is also possible to use a configuration of four colors where the color tone shows a candle volume strength. The indicator defaults to the simple average of 20 periods, but it is possible to change to other types of averages and periods. If you like
FREE
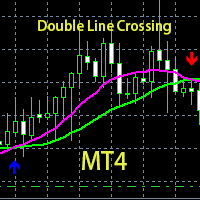
his is a custom indicator based on double-average crossing and arrow marking.
Make multiple lists when blue arrows appear up.
Make a blank list when the red arrow appears down.
When the pink line crosses the green line upwards, the pink line is above, the green line is below, the golden fork appears, and the blue arrow appears.
When the pink line crosses down through the green line, the pink line is below, the green line is above, a dead fork appears, and a red arrow appears.
This is a
FREE

This automated DOJI BAR FINDER INDICATOR can be utilized to manage trades and identify potential areas of support and resistance for both buying and selling. It is designed to identify zones for Sell/Buy trades and can be effectively used in conjunction with other indicators, such as order block indicators, and more. Currently designed for MT4, it will later be adapted to function on MT5. We also offer the opportunity to customize the robot according to your trading strategy. https://t.me/FXTSPr
FREE

Индикатор предназначен для обнаружения высоковероятностных моделей разворота: двойная вершина/дно с ложными прорывами . Это бесплатная версия индикатора: https://www.mql5.com/ru/market/product/26371 Бесплатная версия работает только на EURUSD и GBPUSD! Концепция индикатора Ultimate Double Top/Bottom и профессиональный способ его применения подробно описаны в блоге (на английском языке): Professional Trading With Double Tops/Bottoms And Divergences! Представленное видео показывает максимальную пр
FREE

ATSCStrategy is a versatile indicator designed for both binary options and forex markets. Empower your trading strategies with this dynamic tool, providing valuable insights for making informed decisions in the fast-paced world of binary options and forex trading.
-Forex Market
-Binary Option Market
-Binary use timeframe 1M - 5M
-Forex use timeframe M30 or high
FREE

Индикатор рисует шкалу времени на чарте. Вы можете указать смещение времени, настроить размер и шрифт для отображения на графике. Также вы можете выбрать желаемый формат отображения даты и времени. При зажатой средней кнопке мышки, и движении курсора, будет появляться ползунок на шкале. Параметры
Hours (time shift) — сдвиг времени (часы); Minutes (time shift) — сдвиг времени (минуты); Show time on mouse — показывать время под указателем; Precise time scale — рассчитывать время между барами
FREE

прорыв линии шеи / треугольника / флагштока (прорыв линии шеи = подтвержденный сигнал для вершины / оснований и головы и плеч). Индикатор также можно использовать в режиме одиночного графика. Подробнее об этой опции читайте в разделе продукта. блог . В сочетании с вашими собственными правилами и методами этот индикатор позволит вам создать (или улучшить) вашу собственную мощную систему. Функции
Может одновременно отслеживать все символы, отображаемые в окне "Обзор рынка". Примените ин

SX Price Action Patterns is a comprehensive indicator which shows various price action patterns on the chart for those who are interested in price action trading. These patterns are as follows: A Pin Bar is a candlestick price bar, which has a long wick on one side and a small body. It is a powerful signal of price reversal in a currency trading strategy. An Inside Bar is characterized by a bar or candle that is entirely ‘inside’ the range of the preceding one and represents the consolidation o
FREE

Индикатор ищет один из наиболее эффективных свечных паттернов разворота - Three Line Strike (прорыв трех линий). По словам автора бестселлера и свечного гуру Томаса Булковски, паттерн приносит прибыль в 65-84% случаев . Индикатор сканирует до 30 инструментов (форекс, индексы и товары) на 8 таймфреймах. Вы можете получать алерты в самом терминале или по электронной почте при обнаружении паттерна Three Line Strike. Внимание: Чем крупнее таймфрейм, тем надежнее сигналы. Сигнал срабатывает, если све

"VIX Fix - это мощный индикатор, способный обнаруживать ценовые впадины для любого актива " VIX (индекс волатильности) - это тикерный символ подразумеваемой волатильности S&P 500, вычисляемый Чикагской биржей опционов. VIX является популярной мерой рыночного риска, а также одной их наилучших способов измерения существующих ценовых впадин. К сожалению, он существует только для S&P 500... Индикатор VIX Fix был опубликован Ларри Вильямсом в 2007 году. Он синтезирует индекс волатильности VIX для люб

. Simple Trading System Update !!! Follow this link to see our Strategy !!! (With auto trade indicator)
Description This is an indicator Free Version and showing only history signals, Not real time. Binary Deal Trading Indicator is an indicator on MT4 for Binary Option Trading. It forecasts the overbought / oversold level, Reversal and Fractal point. This indicator will help you to decide a reversal price on any time frame (Recommend M1, M5 and M15). The expiry time is 5-15 minutes after re
FREE

RSI Candle Signal Indicator will change bars’ color when set overbought or oversold levels reach.
How to Use RSI Candle Signal Uptrend/Downtrends - RSI may be used to detect trending markets. For example, the RSI may stay above the mid line 50 in an uptrend. Top and Buttoms - RSI may help in identifying the tops around the overbought readings (usually above 70), and the bottoms around the oversold area (usually below 30). Divergence - divergence occurs when RSI directional movement is not c
FREE

Это индикатор торговых сессий который может отображать все уровни ( Open-High-Low-Close ) для четырех сессий. Сессии могут быть нарисованы линиями или с заливкой как свечи, линии могут быть продлены до следующей сессии. Вы можете легко скрывать/показывать каждую сессию нажатием на горячие клавиши. Также вы можете видеть ASR (средний диапазон сессий) (горячая клавиша по умолчанию «A»). Это похоже на расчет ADR, только он рассчитывается на основе последних X-сессий, что позволяет увидеть пот

Линейный график Volume Percentage Line Graph — это индикатор, предназначенный для предоставления информации об объеме данных. Он извлекает информацию об общем объеме для каждой свечи и представляет ее в процентах от общего объема. Индикатор отображает эти данные в виде линий графика в отдельном окне, что позволяет пользователям легко визуализировать битву между покупателями и продавцами. Одной из ключевых особенностей этого индикатора является его способность отображать объем в процентах в в
FREE

Стрелочный индикатор показывающий разворотные места, где вероятнее всего цена совершит разворот.
Возможности
Может использоваться на любых финансовых инструментах. Сигналы не перерисовываются Работает на любых тайм-фреймах. Имеется несколько видов оповещений для сигналов
Входные параметры
Channel period - Период канала который определяет развороты Smoothing - Сглаживает появление сигналов Calculation method - По какой цене расчет. Close или High/Low Number Bars - Число баров на граф
FREE
А знаете ли вы, почему MetaTrader Market - лучшее место для продажи торговых стратегий и технических индикаторов? Разработчику у нас не нужно тратить время и силы на рекламу, защиту программ и расчеты с покупателями. Всё это уже сделано.
Вы упускаете торговые возможности:
- Бесплатные приложения для трейдинга
- 8 000+ сигналов для копирования
- Экономические новости для анализа финансовых рынков
Регистрация
Вход
Если у вас нет учетной записи, зарегистрируйтесь
Для авторизации и пользования сайтом MQL5.com необходимо разрешить использование файлов Сookie.
Пожалуйста, включите в вашем браузере данную настройку, иначе вы не сможете авторизоваться.