Vertical line.
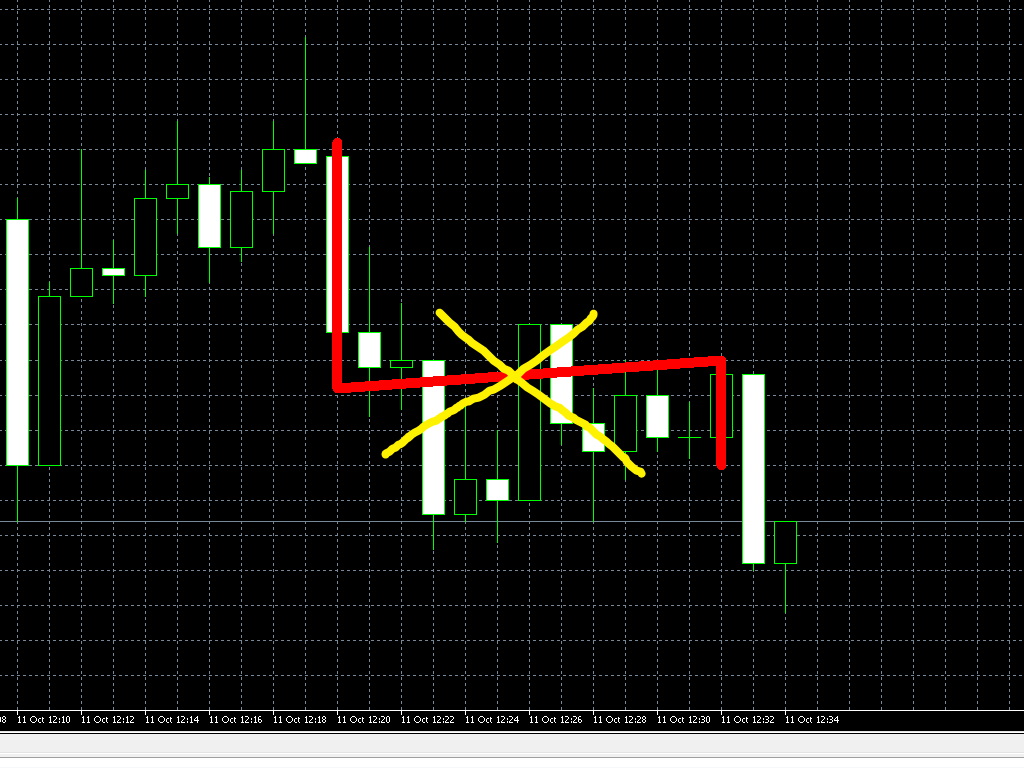
Hello! I have started to make an indicator that will draw a line between two pips in time and price, the way the line is drawn is approximately like this:
Everything is fine, but sometimes the time points can be in one candle, you get a vertical line. I take it that SupportBuffer[w] cannot be made vertical?
If we use a zigzag instead of a line, it works.
If you use a zigzag instead of a line, it works.
Thank you, I will try to take apart the ZigZag and understand the principle of drawing a line.
If you use a zigzag instead of a line, it will work.
The ZigZag itself turned out to be quite compliant, so it wasn't easy to disassemble. But I have prepared a simple example... Can you add a function, where on 3 bars from the last bar there will be a line between High and Low according to your advice zigzag? I would like to understand the principle, and then I will be able to develop it myself.
#property indicator_chart_window
#property indicator_buffers 1
#property indicator_plots   1
//--- plot Support
#property indicator_label1  "Line"
#property indicator_type1   DRAW_LINE
#property indicator_color1  clrAqua
#property indicator_style1  STYLE_SOLID
#property indicator_width1  3

//--- indicator buffers
double         LineTest[];
double         HighMapBuffer[];     // highs
double         LowMapBuffer[];      // lows
//+------------------------------------------------------------------+
//| Custom indicator initialization function                         |
//+------------------------------------------------------------------+
int OnInit()
  {
//--- indicator buffers mapping
   SetIndexBuffer(0,LineTest,INDICATOR_DATA);
   SetIndexBuffer(1,HighMapBuffer,INDICATOR_CALCULATIONS);
   SetIndexBuffer(2,LowMapBuffer,INDICATOR_CALCULATIONS);
   PlotIndexSetDouble(0,PLOT_EMPTY_VALUE,EMPTY_VALUE);
//---
   return(INIT_SUCCEEDED);
  }
//+------------------------------------------------------------------+
//| Custom indicator iteration function                              |
//+------------------------------------------------------------------+
int OnCalculate(const int rates_total,
                const int prev_calculated,
                const datetime &time[],
                const double &open[],
                const double &high[],
                const double &low[],
                const double &close[],
                const long &tick_volume[],
                const long &volume[],
                const int &spread[])
  {
//---
   int limit=prev_calculated;

   for(int i2=limit;i2<rates_total;i2++) // New bar recalculate
     {
      if(limit<rates_total-1)continue; // New bar recalculate
      for(int i=0;i<rates_total;i++)
        {
         //if(i<rates_total-3 && i>rates_total-15) // H Line 3-15 bar
         //   LineTest[i]=high[rates_total-2]; // Price
         //else LineTest[i]=EMPTY_VALUE;

         HighMapBuffer[i]=high[rates_total-3];
         LowMapBuffer[i]=low[rates_total-3];
         LineTest[i]=                    // ???


        }
     }
   return(rates_total);
  }
//+------------------------------------------------------------------+
The ZigZag itself turned out to be quite compliant, so it wasn't easy to disassemble. But I have prepared a simple example... Can you add a function, where on 3 bars from the last bar there will be a line between High and Low according to your advice zigzag? I would like to understand the principle and then I will be able to develop it myself.
https://www.mql5.com/ru/docs/customind/indicators_examples/draw_zigzag

- www.mql5.com
https://www.mql5.com/ru/docs/customind/indicators_examples/draw_zigzag
Thanks, there's already some description and it's a style, not an indicator :), I'll try to figure it out.
The vertical line worked, but I don't understand how to remove the connecting line between the vertical lines. Can someone correct my example so that the connecting line disappears?
#property indicator_chart_window
#property indicator_buffers 2
#property indicator_plots   1
//--- plot ZigZag
#property indicator_label1  "ZigZag"
#property indicator_type1   DRAW_ZIGZAG
#property indicator_color1  clrRed
#property indicator_style1  STYLE_SOLID
#property indicator_width1  10

//--- indicator buffers
double         ZigZagBuffer1[];
double         ZigZagBuffer2[];
//+------------------------------------------------------------------+
//| Custom indicator initialization function                         |
//+------------------------------------------------------------------+
int OnInit()
  {
   SetIndexBuffer(0,ZigZagBuffer1,INDICATOR_DATA);
   SetIndexBuffer(1,ZigZagBuffer2,INDICATOR_DATA);

   return(INIT_SUCCEEDED);
  }
//+------------------------------------------------------------------+
//| Custom indicator iteration function                              |
//+------------------------------------------------------------------+
int OnCalculate(const int rates_total,
                const int prev_calculated,
                const datetime &time[],
                const double &open[],
                const double &high[],
                const double &low[],
                const double &close[],
                const long &tick_volume[],
                const long &volume[],
                const int &spread[])
  {
   int limit=prev_calculated;
   if(prev_calculated==0)limit=rates_total-1;

   for(int i2=limit;i2<rates_total;i2++) // recalculate on new bar
     {

      for(int i=0;i<rates_total;i++)
        {
         if(i==rates_total-3 || i==rates_total-15) // should be VLine on 3th and 15th bar!
           {
            ZigZagBuffer1[i]=high[i];
           }
         else
           {
            ZigZagBuffer1[i]=EMPTY_VALUE;
           }

         if(i==rates_total-3 || i==rates_total-15) // should be VLine on 3th and 15th bar !
           {
            ZigZagBuffer2[i]=low[i];
           }
         else
           {
            ZigZagBuffer2[i]=EMPTY_VALUE;
           }

         if(ZigZagBuffer1[i]!=EMPTY_VALUE )Print(" ZigZagBuffer1[",i,"]: ",ZigZagBuffer1[i]);
         if(ZigZagBuffer2[i]!=EMPTY_VALUE )Print(" ZigZagBuffer2[",i,"]: ",ZigZagBuffer2[i]);

        }
     }
   return(rates_total);
  }
//+------------------------------------------------------------------+
The vertical line worked, but I don't understand how to remove the connecting line between the vertical lines. Can someone correct my example so that the connecting line disappears?
Well, I was wrong then. I didn't understand the purpose...
In this case it is necessary, and easier, to use the graphical drawing DRAW_HISTOGRAM2

- www.mql5.com
Well, I was wrong then. I didn't understand the purpose...
In this case it is necessary, and easier, to use the DRAW_HISTOGRAM2 graphical plotting
Thanks, I'll give it a try!
Another question, does DRAW_HISTOGRAM2 only draw vertically or can it also draw obliquely (between two bars)?Thanks, I'll give it a try!
Another question, DRAW_HISTOGRAM2 draws only vertically or can it also slope (between two bars)?You'll have to decide what you want...
If you need to mix it up, only sometimes remove the connections between the two vertical sections of the zigzag, then it's better to take a coloured zigzag and place the missing colour by convention.
It wouldn't hurt to read all documentation section about graphic plotting. It would give you some idea of what can be done...
- Free trading apps
- Over 8,000 signals for copying
- Economic news for exploring financial markets
You agree to website policy and terms of use
Everything is fine, but sometimes the time points can be in one candle, you get a vertical line. I understand that SupportBuffer[w] cannot be made vertical?