Conheça o Mercado MQL5 no YouTube, assista aos vídeos tutoriais
Como comprar um robô de negociação ou indicador?
Execute seu EA na
hospedagem virtual
hospedagem virtual
Teste indicadores/robôs de negociação antes de comprá-los
Quer ganhar dinheiro no Mercado?
Como apresentar um produto para o consumidor final?
Indicadores Técnicos para MetaTrader 4 - 22

RSI Scanner is a multi symbol multi timeframe RSI dashboard that monitors Relative Strength Index indicator for price entering and exiting overbought and oversold in up to 28 symbols and 9 timeframes.
Download Demo here (Scans only M1 and M5) Settings description here MT5 version here
RSI Scanner features: Signals RSI entering and exiting the overbought and oversold zones. Monitors 28 customizable instruments and 9 timeframes at the same time. You can choose between 3 alert modes: Sin
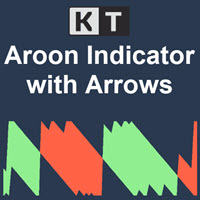
KT Aroon oscillator is the modified version of the original Aroon oscillator initially developed by Tushar Chande in 1995. It measures the time interval between the ongoing highs and lows and uses this deduction to calculate the market trend's direction and strength. It works on the notion that the price will form new highs consecutively during an uptrend, and during a downtrend, new lows will be formed. Buy Signal: When Aroon Up line cross above the Aroon Down line.
Sell Signal: When Aroon Do
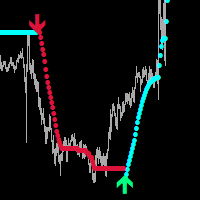
Global Parabolic MT4
Indicator for scalping on M1-M5.
A very good indicator for your trading system, it can be used as a standalone
trading system, I recommend using it together with - System Trend Pro
The indicator does not repaint and does not change its data.
Settings:
Change the FILTER parameter for accurate market entries.
Any questions? Need help?, I am always happy to help, write me in private messages or
In telegram
Please leave 5 Stars to me
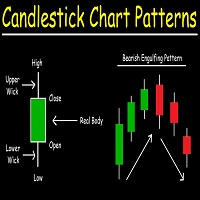
Candlestick Patterns Scanner is professional indicator that will assist and alert you to identify candlestick patterns on meta trader 4 charts whenever a pattern appears on the chart. In financial technical analysis , a candlestick pattern is a movement in prices shown graphically on a candlestick chart that some believe can predict a particular market movement. The recognition of the pattern is subjective and programs that are used for charting have to
FREE

This indicator plots Heiken Ashi candles in a subwindow instead of the main chart, making it possible to analyse HA candles whilst keeping the main chart clean.
- optional bid/close line is provided, stylable, updates on tick - HA candles are stylable via the inputs tab - optional price smoothing to the HA candles, with moving average period and method options - auto-scaling when scrolling back and forth
FREE
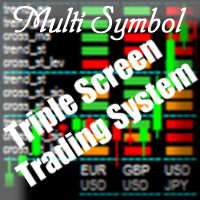
Purpose The indicator is intended for manual multi-currency trading based on the Triple Screen Strategy. It works with any symbols located in the Market Watch window of the MT4: currencies, metals, indexes, etc. The number of instruments can be limited by capacity of the МТ4's parameters. But if desired, you can create several windows with various set of instruments and parameters.
Operation Principle The indicator uses the modified Triple Screen Strategy for determining trend direction in the
The Stretch is a Toby Crabel price pattern which represents the minimum average price movement/deviation from the open price during a period of time, and is used to calculate two breakout levels for every single trading day. It is calculated by taking the 10 period SMA of the absolute difference between the open and either the high or low, whichever difference is smaller. This value is used to calculate breakout thresholds for the current trading session, which are displayed in the indicator as
FREE

Big summer sale. Save up to 40% on my products. SR dashboard - save 10$! With the SR Dashboard, you get a powerful tool to control some of the most important information in trading. Assemble a setup according to your strategy and get informed as soon as this setup is valid. Assign scores to defined conditions and let the Dashboard find them. Choose from Trend, Average Daily Range, RSI, Moving Averages, Pivot (Daily, Weekly, Monthly), Highs and Lows, Candlestick Patterns. Note: This indicator ca

*This is tradingview indicator converted to mql4*
The Chandelier Exit Indicator is a popular technical analysis tool developed by Chuck LeBeau. It is designed to help traders identify potential exit points for their trades based on market volatility and the concept of trailing stops. The Chandelier Exit Indicator consists of three main components: Average True Range (ATR): The indicator utilizes the Average True Range, which measures market volatility. The ATR calculates the average range bet
FREE
The brand new trading indicator using TRIX strategy is exclusive presented by KING.Ai. Exclusive Functions including Mobile Push Notification . This indicator with Three-mode alerts is developed by KING.Ai ONLY. It is probably impossible that you could find a TRIX indicator like this one. It is very difficult for you to trade with the Trix strategy as there is limited time for traders to monitor every currency. However, the Trix strategy is very profitable especially using in DAY CHAT. It

BeST_ Classic Pivot Points is an MT4 Indicator that is based on the widely known and definitely classic Pivot Point of a market prices activity. A pivot point is calculated as an average of significant prices (high,low,close) from the performance of a market in the prior trading period. If the market in the following period trades above the pivot point it is usually evaluated as a bullish sentiment, whereas trading below the pivot point is seen as bearish. A pivot point and the associated suppo
FREE

The indicator looks for market Highs and Lows. They are defined by fractals, i.e. the market creates the indicator algorithm and structure, unlike ZigZag having a rigid algorithm that affects the final result. This indicator provides a different view of the price series and detects patterns that are difficult to find on standard charts and timeframes. The indicator does not repaint but works with a small delay. The first fractal level is based on the price, the second fractal level is based on t
FREE
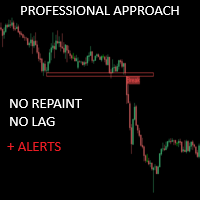
O indicador Critical Zones foi criado especialmente para os operadores manuais que procuram entradas mais exactas no mercado. Este indicador utiliza algoritmos avançados para detetar áreas de interesse, calculando o suporte e a resistência mais relevantes no gráfico, bem como os seus rompimentos e retestes. Este indicador pode ser configurado para enviar alertas e notificações quando são detectadas oportunidades de compra/venda potencialmente lucrativas, permitindo que os operadores se mantenha

Sync Cursor MT4 Tool will It make the Horizontal Line + Vertical Line in the Screen That it is always present on the screen and that it moves along with the candle (with the price). I am sure that something so simple will be a Treasure in the hands of many people. Some of my personal trades are posted voluntary and free of charge in this Public channel https://t.me/FXScalpingPro Contact: https://t.me/TuanNguyenTrader
FREE

Introducing the Pivot Point Selector Indicator: Your Ultimate Tool for Custom Pivot Levels Are you ready to take your trading to the next level? Say hello to the Pivot Point Selector Indicator, a game-changing tool that puts you in control of your pivot levels. This innovative indicator empowers you to choose three specific points that will determine the pivot level calculations, giving you unparalleled customization and precision in your trading strategy. Key Features and Benefits: Custom Pivo
FREE

Market Cycles is a unique proprietary indicator that uses a neural network to determine the current market phase.
For training, the neural network uses cyclic (reversal) patterns.
Currency markets tend to cycle from bearish to bullish periods and back again.
In this product, we combined patterns from four timeframes (M5, M15, M30, H1), which allowed us to significantly increase the accuracy of the signals!
Market Cycles should be used on the EURUSD currency pair, M30 timeframe!
Be
The product helps to find the highest peak and the lowest low. Help investors optimize profits. With a win rate of up to 80%. You do not need to adjust any parameters. We have optimized the best product. Your job just need to see and trade. Products with technological breakthroughs. Contact other products: https://www.mql5.com/en/users/hncnguyen/news.
FREE

Up Down trend - determines the trend itself. Correct identification of the trend determines 95% of trading efficiency. And if a trader always accurately determines the direction of the trend, then he will only have to wait for corrections in the direction of the trend and open trades. In any trading strategy you need to correctly identify the trend. If the trend is not defined correctly, the trader will not be able to effectively enter the market and most likely the trading result will be negat
Indicator Rua Alert Trend Line. This indicator will notify when the price breaks any trendline on the chart. Notifications will be sent to the phone and on MT4. Custom parameters: in_NumbersAlert: The number of notifications that will be sent when the price breaks the trendline. A product of Ruacoder Provide code indicator and EA services upon request. Contact: Telegram : https://t.me/Ruacoder
FREE

MAJOR CHANGES HAS BEEN MADE. Parameter description will be changed. EXPECT ANOTHER UPDATE BEFORE JUNE ENDS.
PRICE WILL GO UP AFTER THE FINAL UPDATE.
True Currency Meter with Email and SMS push notifications! Have you ever wondered why would some pairs would move more than others, and 100 pips on EURGBP is bigger than 100 pips on EURUSD? And during the news, some would move 200 pips but some would only move 150 pips? This is the key to the newly developed "28 pairs" True Currency Strength Met

You've probably heard about the Dow trend Theory, where higher highs and lows indicate an uptrend, and lower highs and lows indicate a downtrend. This indicator determines this trend based on the Dow Theory. You just need to enter a number representing the number of candles between extremes. The optimal solution is the number 3, unless you want to have the trend from M5 but you're on M1, then you need to multiply this number by 5. Check various combinations to trade with the trend. In the scree
FREE

Fractal is one of the main indicators in a number of strategies. Volume Fractals has expanded the functionality of the standard indicator version. The product features fractals sorting and displaying fractals representing both price and volume extreme points.
Application Stop losses Reversal signals Placing pending orders for a fractal breakout
Options Bars of history - number of chart bars the indicator is displayed for Left side minimum bars - minimum number of bars to the left of the frac
FREE

This indicator calculates and draws lines over the chart. There are two types of trends: Trend A: the line is drawn using local lows for uptrends and local highs for downtrends Trend B: the line is drawn using local highs for uptrends and local lows for downtrends There are a few conditions, which have to be fulfilled and can be changed by the parameters (see also picture 4): MinBarAge : the count of bars to the last base point of a line is called BarAge and has to be greater than the parameter
FREE

O objetivo desta nova versão do indicador-padrão em MT4 fornecida em sua plataforma é exibir em uma sub-janela vários períodos do mesmo indicador. Veja o exemplo mostrado na imagem abaixo. Mas a exibição não é como um indicador MTF simples. Esta é a exposição real do indicador no seu intervalo de tempo. Eis as opções disponíveis no indicador FFX: Selecione os prazos a serem exibidos (M1 para Mensal) Defina a largura (número de barras) para cada caixa de tempo Alerta pop up/som/e-mail/push (preço
FREE

Tester Periods is the useful indicator for visual strategy tester which extend chart periods. Its designed for the trading utility Trade Shell (included Trade Shell SMC ).
Run the Trade Shell on the visual tester. Then put the Tester Periods indicator on the chart. If you wanna see timeframes M1, M5, M10, M15 , for example, then you have to run visual tester on M1 and to define multipliers like that: TimeFrame_Periods_Multiplier = 1,5,10,15 If you wanna see timeframes M5, M20, M30, H1, fo
FREE

The Trend Finding Channels indicator was developed to help you determine the trend direction by drawing channels on the graphical screen. It draws all channels that can be trending autonomously. It helps you determine the direction of your trend. This indicator makes it easy for you to implement your strategies. The indicator has Down trend lines and Up trend lines. You can determine the price direction according to the multiplicity of the trend lines. For example , if the Down trend lines s
FREE
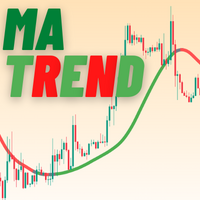
MATrend indicator makes the directional trend of the current market easily recognizable. Settings: MA Period : The amount of candles taken into consideration for the calculation of the moving average; MA Method : The method used for the calculation of the moving average. Selectable methods are: Simple averaging;
Exponential averaging;
Smoothed averaging;
Linear-weighed averaging; Usage: The color of the indcator will change based on the slope of the MA. Green : The indicator has a bullish
FREE

Indicator for the 4th strategy of the Pipsurfer EA. This indicator will allow the user to visually see the points of entry for strategy 4 of Pipsurfer. In the settings you will be able to adjust the parameters to mix and match to your trading style and find the settings that you want to either trade manually or tune the EA to do. Strategy 4 uses a market structure trend continuation approach to trading and looks for confirmed highs in downtrends and confirmed lows in uptrends to find great trend
FREE

Have you ever wondered why so many Forex traders get trapped in weak positions on the wrong side of the market? One of the easiest ways the market makers do this, is by using volatility. A currency pair moves suddenly, often on a news release or economic data. Traders jump in, expecting some quick and easy profits, but the move suddenly moves in the opposite direction. This happens in all timeframes, and in all currency pairs. The candle or bar closes, with a wide spread, but then reverses sharp

万能线段划分指标简介: 万能线段划分是依照两根相互缠绕的均线,依金死叉为标准,将金死叉两边的高低点进行连接开成线段划分。本指标可以设定不同参数多级别叠加使用。 万能分段的原理: 在任意一组均线组成的均线系统中,均线之间的相互缠绕,形成的金死叉是有位次关系的。这点,作者在这里算是首次对外公开这个秘密。上图的均线系统中,走势处于一个较大级别的振荡行情中,均线之间相互缠绕比较频繁,金死叉的数量较多,所以,情况比较复杂。 我们知道,均线可按其周期大小进行位次排序。上图均线依照周期从小到大排序为:MA10,MA30,MA60,MA144,MA233,依照这组均线的位次关系,将每相邻两根均线金死叉做上标注。如:MA10&MA30金死叉标注为“1”,MA30&MA60金死叉标注为“2”,MA60&MA144金死叉标注为“3”,MA144&MA233金死叉标注为“4”。我们将两相邻均线金死叉完全标注完毕后,发现图上还有部份金死叉并未被标注到,这些未被标注到的金死叉全部是非相邻均线之间发生的金死叉。我们依照以上方法,可以识别出均线组之间金死叉的级别位次关系。市场行情的发展是依照此级别位次关系,从小到大
FREE

Every indicator has its advantages and disadvantages. Trending ones show good signals during a trend, but lag during a flat. Flat ones thrive in the flat, but die off as soon as a trend comes. All this would not be a problem, if it was easy to predict when a flat changes to a trend and when a trend changes to a flat, but in practice it is an extremely serious task. What if you develop such an algorithm, which could eliminate an indicator's flaws and enhance its strengths? What if such an algori

Currency RSI Scalper -é um indicador profissional baseado no popular indicador Relative Strength Index (RSI).
Embora o indicador RSI funcione bem para um intervalo do mercado, ele não gera sinais lucrativos quando as condições do mercado mudam e, portanto, produz sinais errados, resultando em grandes perdas.
Você já pensou em um indicador RSI adaptativo que se adapta com base nas condições do mercado?
O indicador apresentado implementa um algoritmo de otimização que encontra os melhores n

This dynamic indicator will identify when Fast Moving Averages (EMA, SMA, or LW) cross Slow Moving Average lines on any timeframe and with any symbol.
When the moving averages cross and price close above or below the crossing, the User will receive an alert via pop-up, push, or email.
Choose any two Moving Averages to cross to receive an alert and the Indicator will also paint the Moving Average Lines and Arrows.
You can choose Exponential Moving Averages (EMA). Simple Moving Averages (SMA
MT5 Version Available Here: https://www.mql5.com/en/market/product/50255
Telegram Channel & Group : https://t.me/bluedigitsfx
V.I.P Group Access: Send Payment Proof to our Inbox
Recommended Broker: https://eb4.app/BDFXOsprey
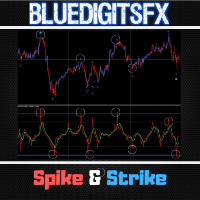
* Breakthrough Solution For Reversal Trading And Filtering With All Important Features Built Inside One Tool! BlueDigitsFx Spike And Strike Reversal is a mixed oscillator that mixes the readings of a number of indicators, which makes it potential to preci

"Drivers Road Bands" indicator that is designed to be used in the 1H, 4H and 1D timeframes in the most ideal way. If we compare timeframes to roads and streets; main streets and highways with high traffic volume are similar to high-time timeframes in technical analysis. If you can interpret the curvilinear and linear lines drawn by this indicator on the graphic screen with your geometric perspective and develop your own buy and sell strategies; you may have the key to being a successful trader.
FREE

This indicator scans for you up to 30 trading instruments and up to 8 timeframes for occurrences of the high probability reversal patterns: Double Tops/Bottoms with fake breakouts . Please read also the blog post " Professional Trading With Double Tops/Bottoms And Divergences! " which explains the concepts behind the ULTIMATE Double Top/Bottom indicator and how you can use a professional top-down approach. This FREE Version of the Scanner scans only EURUSD and GBPUSD. The full version of the sca
FREE
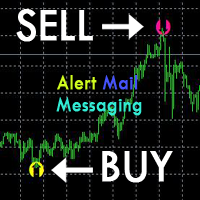
[ZhiBiZZD_MT4] O indicador é adequado para todos os ciclos e é adequado para todas as variedades do mercado.
[ZhiBiZZD_MT4] A seta para baixo é o sinal de (vender).
[ZhiBiZZD_MT4] A seta para cima é o sinal de (Comprar).
[ZhiBiZZD_MT4] pode ser definido nos parâmetros (Alerta, Enviar e-mail, Enviar notificação), definido como (verdadeiro) para enviar sinais instantâneos para a janela de alarme, e-mail, mensagens instantâneas.
Descrição da configuração de parâmetros:
[alert_NO_OFF]: Est
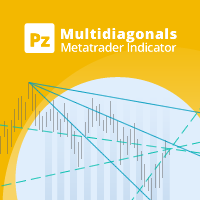
This indicator connects past price points drawing diagonals and trend lines, which converge in the future creating hidden reversal points. [ Installation Guide | Update Guide | Troubleshooting | FAQ | All Products ] Find hidden reversal points Spot convergence zones easily Dense criss-cross zones are reversal points Configurable amount of lines and price points Configurable colors
How to use the indicator The indicator draws several lines on the chart, and where many of these lines converge a
FREE

For all those traders interested or currently trading Ichimoku, you will not want to miss this article. Although I am heading out in a few hours with my girlfriend to Harbin Hot Springs, I wanted to write a brief introduction to Ichimoku Number Theory as there has been a lot of questions (and confusion) about Ichimoku settings, time frames, etc. The basis of Ichimoku as known to most is the 5 lines; Tenkan Line Kijun Line Senkou Span A (part of the Kumo) Senkou Span B (other part of the Kum
FREE

Pattern Explorer is a reliable tool for applying all the power of the most popular Japanese Candlestick Patterns . It uses Machine Learning algorithms to confirm all the patterns. What is the most impressive thing about it? Select Take Profit and Stop Loss and click on “Backtest your strategy” button to backtest your strategy in real time and to see according to your selection: Total signals Testable signals (signals that are reliable to be tested) Profitable signals (%) Loss signals (%) Total p
FREE

BB & RSI Candle Color: Technical Analysis Indicator on MetaTrader 4 The "BB & RSI Candle Color" indicator is a powerful technical analysis tool designed for MetaTrader 4 traders looking for an effective visual representation of market conditions. Created by 13 Crow Trading Club, this indicator combines the popular Bollinger Bands and the Relative Strength Indicator (RSI) to provide clear and accurate visual signals. This indicator offers three key aspects: Candle Color: Normal candles are displa
FREE
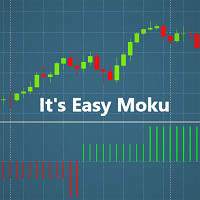
Introduction:
Welcome dear Users, This indicator has been developed in order to help traders who are daily struggling to find a strategy . I have always been acctracted by Ichimoku Strategy, however took me sometime figure out how it does work. Easy Moku makes Ichimoku Simple!
Aspect:
Easy Moku shows 2 principal ICHIMOKU signals: kijun sen/tenken sen sen crossover Span A Span B + Kijun sen/tenken sen Get Rid of all the Ichimoku Lines!
On the Mt4 Chart the Easy Moku paints an Histog
FREE
The Key level flag pattern is one of it's kind when it comes to flag patterns on the Metatrader platform. It is perfect for entering pullbacks in a trend, retests on certain structure or price action, or when you are just looking for a confirmation entry on a zone or odrerblock. It's works on all markets, whether it's forex, crypto currency, stocks or futures. In it's algorithm it incorporates an: 1. Impulsive move (leg/pole) = this is the high momentum move which creates the leg/pole of the pat

RaysFX StepMA+Stoch Caratteristiche Principali Adattabilità: Il nostro indicatore RaysFX StepMA+Stoch è progettato per adattarsi alle mutevoli condizioni di mercato. Utilizza l’Average True Range (ATR) per misurare la volatilità del mercato e regolare di conseguenza le sue strategie di trading. Precisione: L’indicatore genera segnali di trading quando la linea minima incrocia la linea media. Questi segnali sono rappresentati come frecce sul grafico, fornendo punti di ingresso e di uscita chiar
FREE

UniversalFiboChannel is a universal indicator, it builds a trading channel according to Fibonacci levels. This indicator is a full-fledged channel trading strategy. The indicator is installed in the usual way and works with any trading tool. Options HelpBasisTF = "M: 43200; W: 10080; D1: 1440; H4: 240; H1: 60" is a hint for the BasisTF parameter
BasisTF = 1440 - base period for calculating Fibonacci levels DisplayDecimals = 5 - the number of decimal places of the price of the trading instrume
FREE

Após 7 anos, decidi liberar alguns dos meus próprios indicadores e EAs gratuitamente.
Se você os achar úteis, por favor Mostre seu apoio com uma avaliação de 5 estrelas! Seu feedback mantém as ferramentas gratuitas chegando! Veja também as minhas outras ferramentas gratuitas aqui
_________________________________ Indicador de Largura das Bandas de Bollinger para Análise Avançada da Volatilidade do Mercado O Indicador de Largura das Bandas de Bollinger, desenvolvido cuidadosamen
FREE

A simple and effective trend indicator. It will be a good assistant when trading. A minimum of understandable settings. Put it on a chart and set it up Good to combine with other indicators. I will post another trend indicator soon. The combination of these two indicators gives good results. Works on all timeframes. Suitable for any couple. Experiment, adjust, observe. Filter by higher timeframes.
FREE
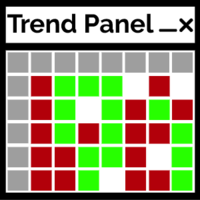
O Trend Panel é uma ferramenta simples e conveniente que exibirá uma direção de tendência confirmada dos timeframes M1 - D1 usando dez pares escolhidos pelo usuário.
O indicador foi projetado para adicionar confirmação de direção em qualquer estratégia/modelo e também funcionar como uma interface interativa limpa para alterar rapidamente o gráfico para um par ou período de tempo diferente. Bate-papo em grupo: https://www.mql5.com/en/users/conorstephenson
Entre em contato comigo após a compr
FREE

Após 7 anos, decidi disponibilizar alguns dos meus próprios indicadores e Expert Advisors (EAs) gratuitamente.
Se você os achar úteis, por favor apoie com uma avaliação de 5 estrelas! Seu feedback me motiva a continuar oferecendo ferramentas gratuitas. Explore minhas outras ferramentas gratuitas aqui .
_________________________________ Indicador "RSI com Bandas" – Decisões de Negociação Melhores O indicador "RSI com Bandas" combina o RSI clássico com bandas simples para mostrar
FREE

Introduction and Description
The indicator displays an arrow whenever a " Bearish Engulfing " is detected. The latter usually indicates the beginning of a downward trend. A bearish engulfing pattern is a technical chart pattern that signals lower prices to come. The pattern consists of an up candlestick followed by a large down candlestick that eclipses or "engulfs" the smaller up candle. The pattern can be important because it shows sellers have overtaken the buyers and are pushing the price m
FREE
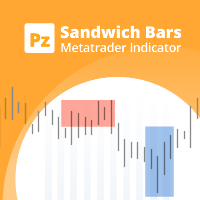
This indicator detects Sandwich Bars of several ranges, an extremely reliable breakout pattern. A sandwich setup consists on a single bar that engulfs several past bars, breaking and rejecting the complete price range. [ Installation Guide | Update Guide | Troubleshooting | FAQ | All Products ] Easy and effective usage Customizable bar ranges Customizable color selections The indicator implements visual/mail/push/sound alerts The indicator does not repaint or backpaint The indicator could not b
FREE

R Chimp Scalper é uma excelente ferramenta de negociação para especuladores forex e day traders.
Os sinais deste indicador de escalpelamento são muito claros e fáceis de ler.
Desenhe barras verdes e vermelhas acima e abaixo do nível zero em janelas de negociação separadas: As barras verdes se alinham acima do nível zero, indicando uma tendência especulativa de alta. As barras vermelhas se alinham abaixo de zero, indicando uma tendência de queda do escalpelamento. As leituras do indicador ac
FREE
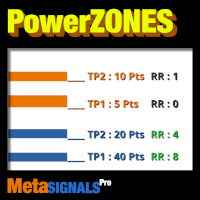
Zona estratégica tocada 3,4 ou 5 vezes que magnetizará o preço >> TP1/TP2/TP3 em pontos ou valor de acordo com as PowerZONES >> Verificar visualmente a segurança do seu rácio Risco/Recompensa Indicador não repintável e não atrasado | deal para trading manual e automatizado | adequado para todos os activos e todas as unidades de tempo Oferta por tiempo limitado - depois volta a >> $99 Após a compra, por favor contacte-me neste canal para obter as definições recomendadas
Características
1.

"Adjustable Fractals" - é uma versão avançada do indicador fractal, uma ferramenta de negociação muito útil!
Como sabemos, o indicador padrão fractals mt4 não possui nenhuma configuração - isso é muito inconveniente para os traders O Fractals Ajustáveis resolveu esse problema - possui todas as configurações necessárias: Período ajustável do indicador (valores recomendados - acima de 7) Distância ajustável dos máximos/mínimos do preço Design ajustável de setas fractais
// Mais excelentes Exp

Padrão PINBAR do indicador Forex para MT4
O indicador "Padrão PINBAR" é um indicador muito poderoso para negociação de Price Action: sem repintura, sem atrasos; O indicador detecta PinBars no gráfico: Bullish PinBar - Sinal de seta azul no gráfico (ver fotos) Bearish PinBar - Sinal de seta vermelha no gráfico (ver fotos) Alertas de PC, celular e e-mail estão incluídos O indicador "Padrão PINBAR" é excelente para combinar com Níveis de Suporte/Resistência: https://www.mql5.com/en/market/produc
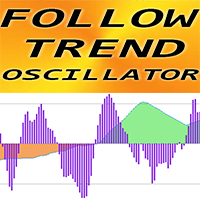
"Follow Trend Oscillator" - é um indicador personalizado avançado, uma ferramenta de negociação eficiente!
Indicador amigável oferece oportunidades para escalar na direção da tendência principal Oscilador suave e ajustável com parte histórica do sinal Cor verde do oscilador para tendências ascendentes, cor marrom - para tendências descendentes Valores sobrevendidos: abaixo de -30; Valores de sobrecompra: acima de 30 Existem muitas oportunidades para atualizar até mesmo estratégias padrão com

Indicador "Heikin Ashi Master" para MetaTrader: Transforma tu Análisis con Velas Japonesas Suavizadas El indicador "Heikin Ashi Master" es una herramienta innovadora diseñada para traders que buscan una perspectiva única del mercado a través de las Velas Japonesas. Compatible con MetaTrader, este indicador suaviza la acción del precio, ofreciendo una interpretación simplificada y visualmente atractiva de las tendencias y cambios en el mercado. Características Destacadas: Suavizado de la Acción
FREE

The FCPI indicator or Forex Currency Power Index indicator for MT4 is a multi currency pairs indicator that displays 28 pairs on 1 chart, which consists of 8 Major Pairs and 20 Cross pairs. 8 Major Pairs and 20 Cross pairs: EURUSD,GBPUSD,AUDUSD,NZDUSD,USDCAD,USDCHF,USDJPY,EURGBP,EURAUD,EURNZD,EURCAD,EURCHF,EURJPY,GBPAUD, GBPNZD,GBPCAD,GBPCHF,GBPJPY,AUDNZD,AUDCAD,AUDCHF,AUDJPY,NZDCAD,NZDCHF,NZDJPY,CADCHF,CADJPY,CHFJPY. Automatically detects symbols that have a symbol prefix and/or a symbol suffi

Elliott Wave Indicator
Perfect for trading Stocks, Futures, Forex & Crypto The Elliott Wave Indicator Suite is designed around a simple but effective Swing Trading strategy. The Indicator Suite is great for Stocks, Futures and Forex trading on multiple time-frames.
By subscribing to this indicator, you will get: Automatic Elliott Wave Count Elliott Wave Isolation High Probability Pull Back Zones Special 5-35 Oscillator 6/4 Moving Average High and Low's for trade entry and management Autom
The SD Indicator is a powerful tool in the world of Forex trading, that combines two classical strategies: Support/Resistance levels and Supply/Demand zones. The indicator helps traders to identify potential trading opportunities in the market with high accuracy.
Support and resistance levels are key price levels where buying and selling pressure converge, leading to potential price reversals. The SD Indicator identifies these levels in real-time and provides traders with a clear picture of wh

This indicator allow you to measure Profit/Loss of current, closed or future trade in account currency and estimate margin level at the trade close point. Profit/Loss indicator is based on MT4 native Crosshair instrument and has following inputs: Trade Direction = Buy/Sell Lot size = 0.1 Font size = 8 Font color = DeepSkyBlue Offset horizontal Offset vertical
FREE
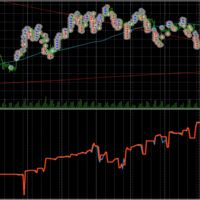
Graph shows your balance and equity in real time similar to the tester graph which is nice to see your real progress vs tester graph. This code was copied from mql5.com, it was free and it works im just putting it here to make it easier for us :-) https://www.mql5.com/en/code/13242
https://www.mql5.com/en/code/8454 .. original code
//+------------------------------------------------------------------+
//| Equity Monitor |
//| Monitori
FREE
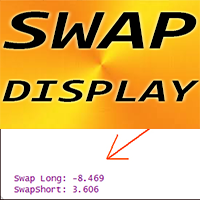
Este é um produto gratuito que você pode usar de acordo com suas necessidades!
Além disso, agradeço muito seus feedbacks positivos! Muito obrigado!
// Mais excelentes Expert Advisors e Indicadores estão disponíveis aqui: https://www.mql5.com/en/users/def1380/seller // Além disso, você está convidado a aderir a um sinal lucrativo, estável e confiável https://www.mql5.com/en/signals/1887493
Exibição SWAP do indicador Forex para MT4, suporte comercial.
O indicador SWAP Display mostra os sw
FREE

FREE FOR A LIMITED TIME ONLY!!! The Ultimate Indicator For Trading Trend This indicator clearly shows you the strength of the market in one direction or the other, which means that you can trade knowing you are either with or against the market. When used in conjunction with the +3R principles you are sure to have some serious results. The +3R Principles Routine - This is when you trade and how often Rules - This is the rule you follow Risk:Reward - This is the percentage amount of your accoun
FREE

Stochastic RSI makes a stochastic calculation on the RSI indicator. The Relative Strength Index (RSI) is a well known momentum oscillator that measures the speed and change of price movements, developed by J. Welles Wilder.
Features Find overbought and oversold situations. Sound alert when overbought/oversold level is reached. Get email and/or push notification alerts when a signal is detected. The indicator is non-repainting. Returns buffer values for %K and %D to be used as part of an EA . (
FREE

A classical MACD indicator where both the MACD line and the Signal line are displayed as lines. The difference between MACD and Signal line is displayed as a histogram. A user can change the color and thickness of histogram lines. So, histogram lines can be grouped into four different groups: positive ascending, positive descending, negative descending and negative ascending. Multi-currency Dashboard for the indicator is available https://www.mql5.com/en/market/product/72354
FREE

An “inside bar” pattern is a two-bar price action trading strategy in which the inside bar is smaller and within the high to low range of the prior bar, i.e. the high is lower than the previous bar’s high, and the low is higher than the previous bar’s low. Its relative position can be at the top, the middle or the bottom of the prior bar.
The prior bar, the bar before the inside bar, is often referred to as the “mother bar”. You will sometimes see an inside bar referred to as an “ib” and its
FREE
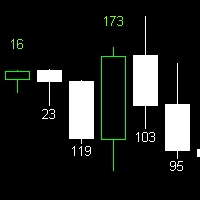
Candle Size Indicator Explore the candle size using this convenient indicator. It works across various timeframes, providing valuable insights for technical analysis. Key Features: Display the size of the candle after configuring the indicator. Compatible with all timeframes. The size of the candle is a significant metric in technical analysis, offering insights into market strength and volatility. This indicator enables clear and accurate visualization of candle sizes on your chart. Utilize thi
FREE

Após 7 anos, decidi liberar alguns dos meus próprios indicadores e EAs gratuitamente.
Se você os achar úteis, por favor Mostre seu apoio com uma avaliação de 5 estrelas! Seu feedback mantém as ferramentas gratuitas chegando! Veja também as minhas outras ferramentas gratuitas aqui
_________________________________ Indicador %B para Análise Avançada de Forex O Indicador %B, habilmente criado em MQL4, é uma ferramenta dinâmica destinada a revolucionar a análise de Forex. Utiliz
FREE

Supply Demand Zone Pro Indicator works with all products and timeframes. It is using a new calculation method, and now you can select the desired zone on any timeframe! Strongest Zones are already enabled by default This is a great advantage in trading.This indicator has a built in backtester enabled by default, just move the chart.
Supply and Demand ?
Supply is a price zone where sellers outnumbered buyers and drove the price lower. Demand is a price zone where buyers outnumbers sellers and
Saiba como comprar um robô de negociação na AppStore do MetaTrader, a loja de aplicativos para a plataforma MetaTrader.
O Sistema de Pagamento MQL5.community permite transações através WebMoney, PayPay, ePayments e sistemas de pagamento populares. Nós recomendamos que você teste o robô de negociação antes de comprá-lo para uma melhor experiência como cliente.
Você está perdendo oportunidades de negociação:
- Aplicativos de negociação gratuitos
- 8 000+ sinais para cópia
- Notícias econômicas para análise dos mercados financeiros
Registro
Login
Se você não tem uma conta, por favor registre-se
Para login e uso do site MQL5.com, você deve ativar o uso de cookies.
Ative esta opção no seu navegador, caso contrário você não poderá fazer login.