EasyTrade Indicator
- 지표
- Gabor Bocsak
- 버전: 1.9
- 업데이트됨: 17 5월 2024
- 활성화: 10
다중 통화 및 다중 시간대 매수 및 매도 알림. 자동 추적 중지 및 위험 보상 이익 실현! 지표는 시장을 스캔하고 분석하므로 귀하가 할 일이 없습니다! 하나의 차트에서 모든 통화를 거래하세요!
구매 후 댓글 남겨주시면 연락드리겠습니다. 무역도우미 EA를 보내드리겠습니다.
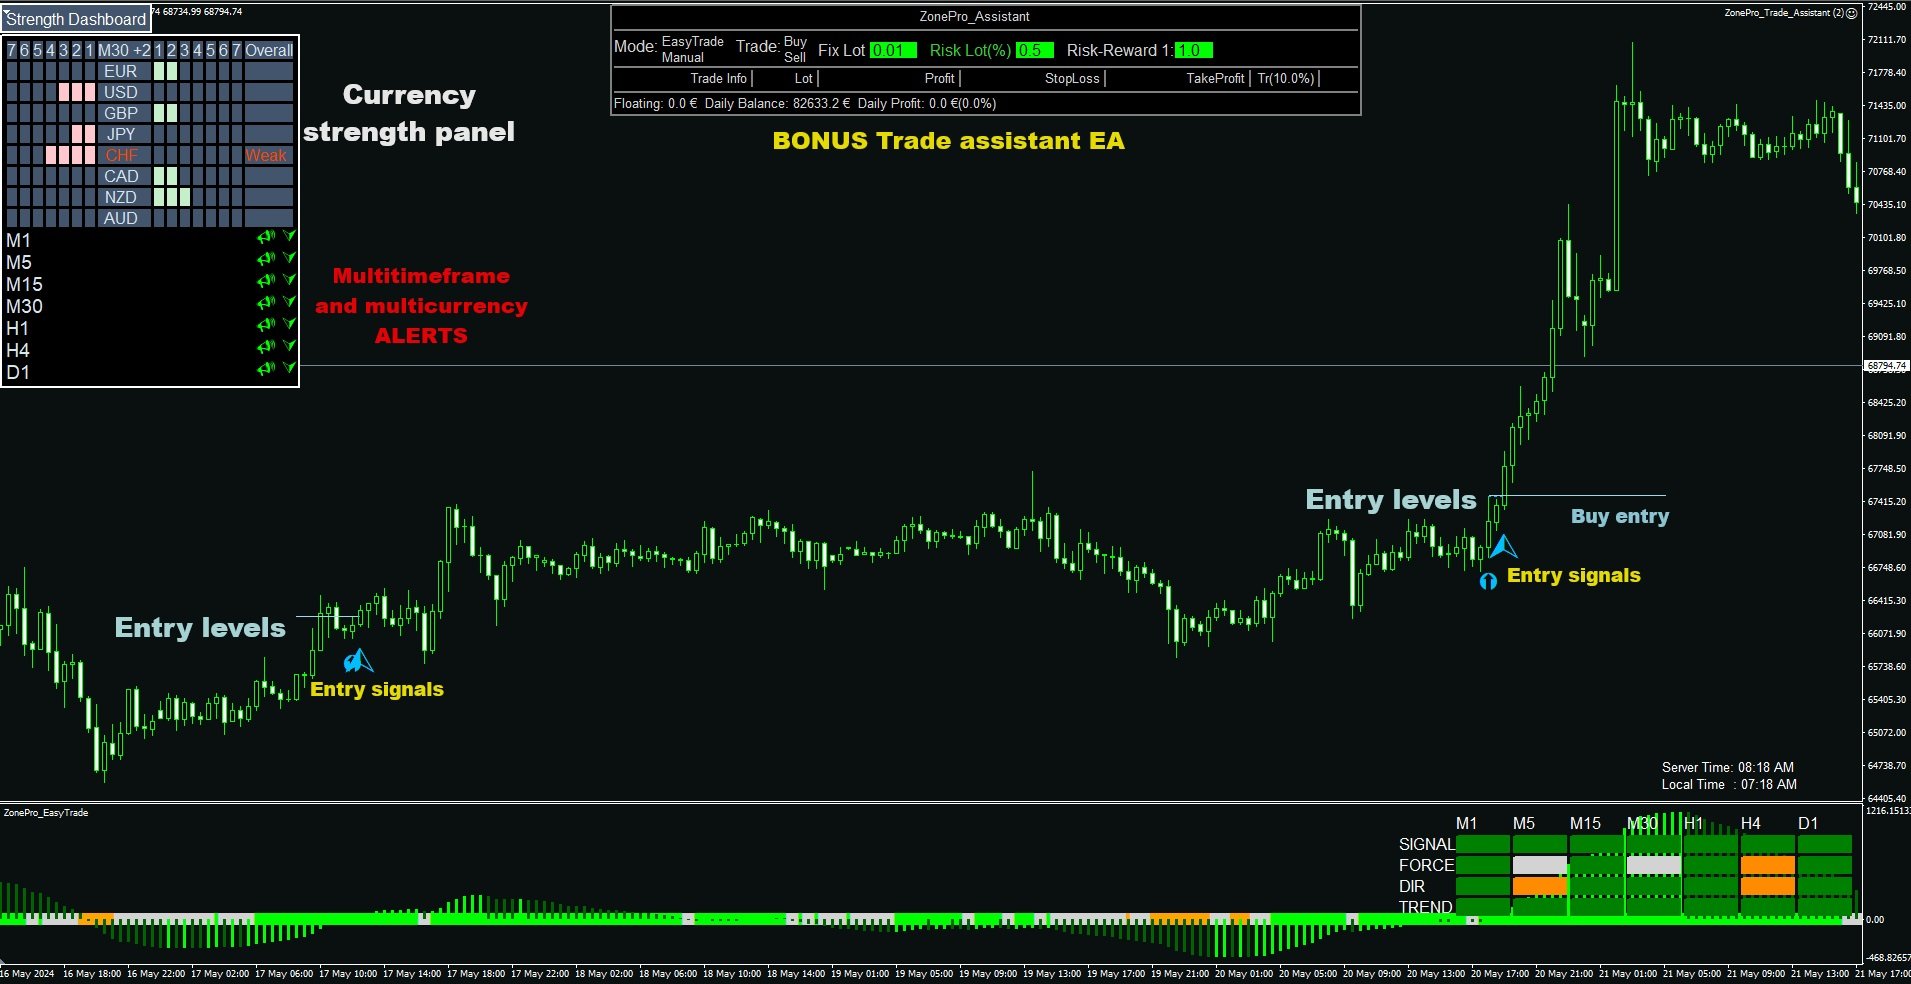
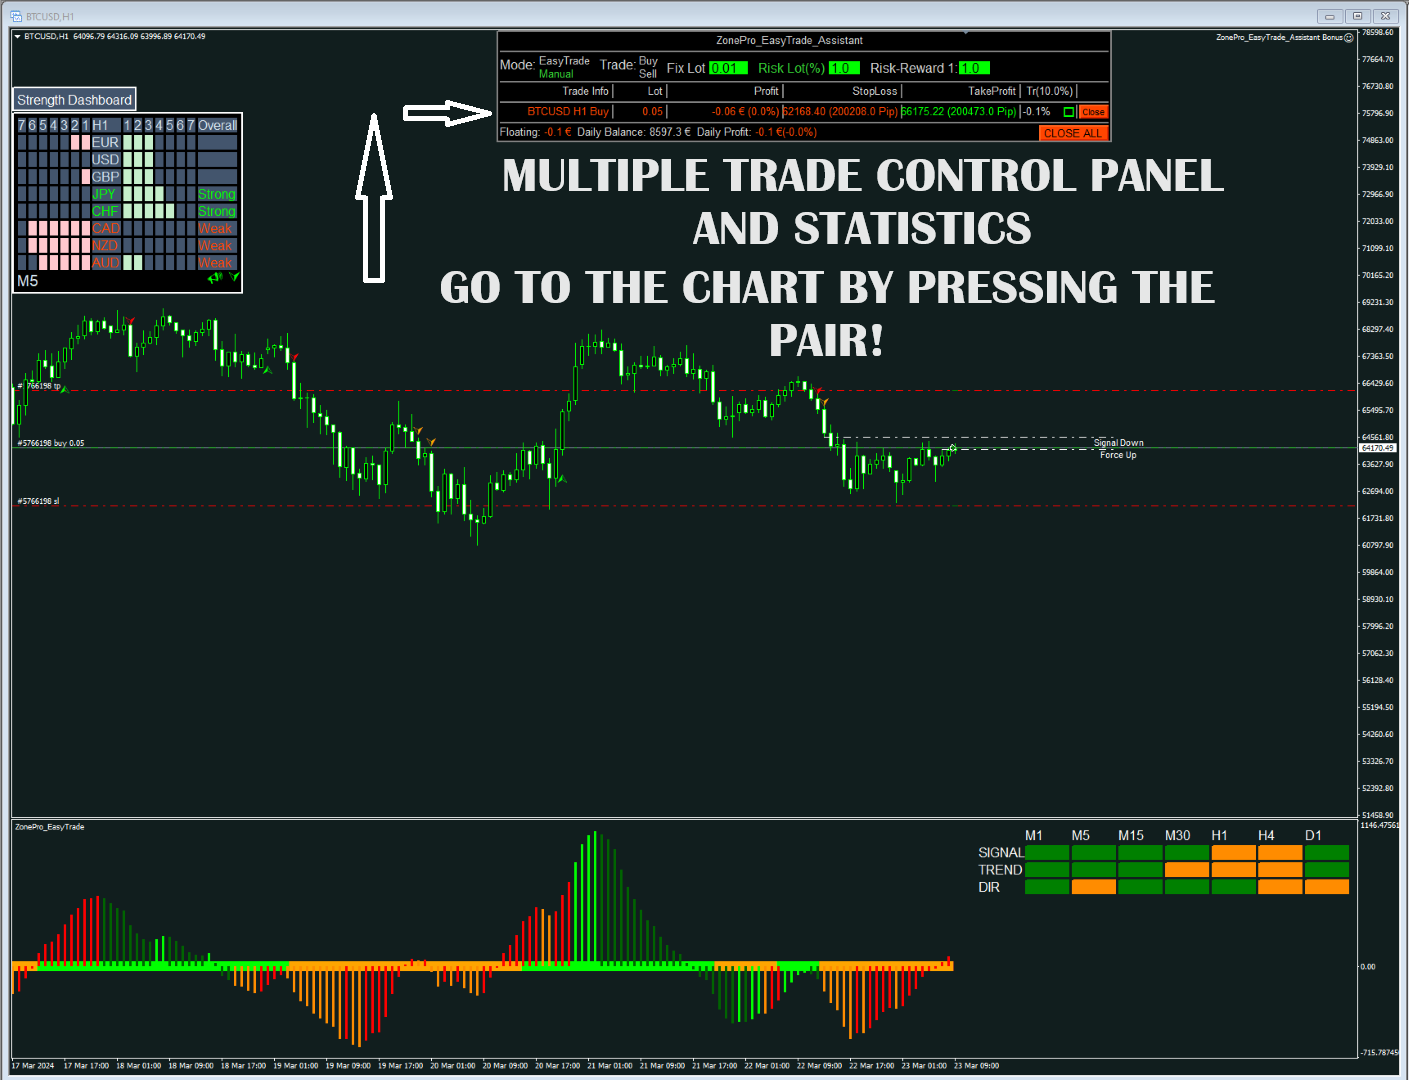
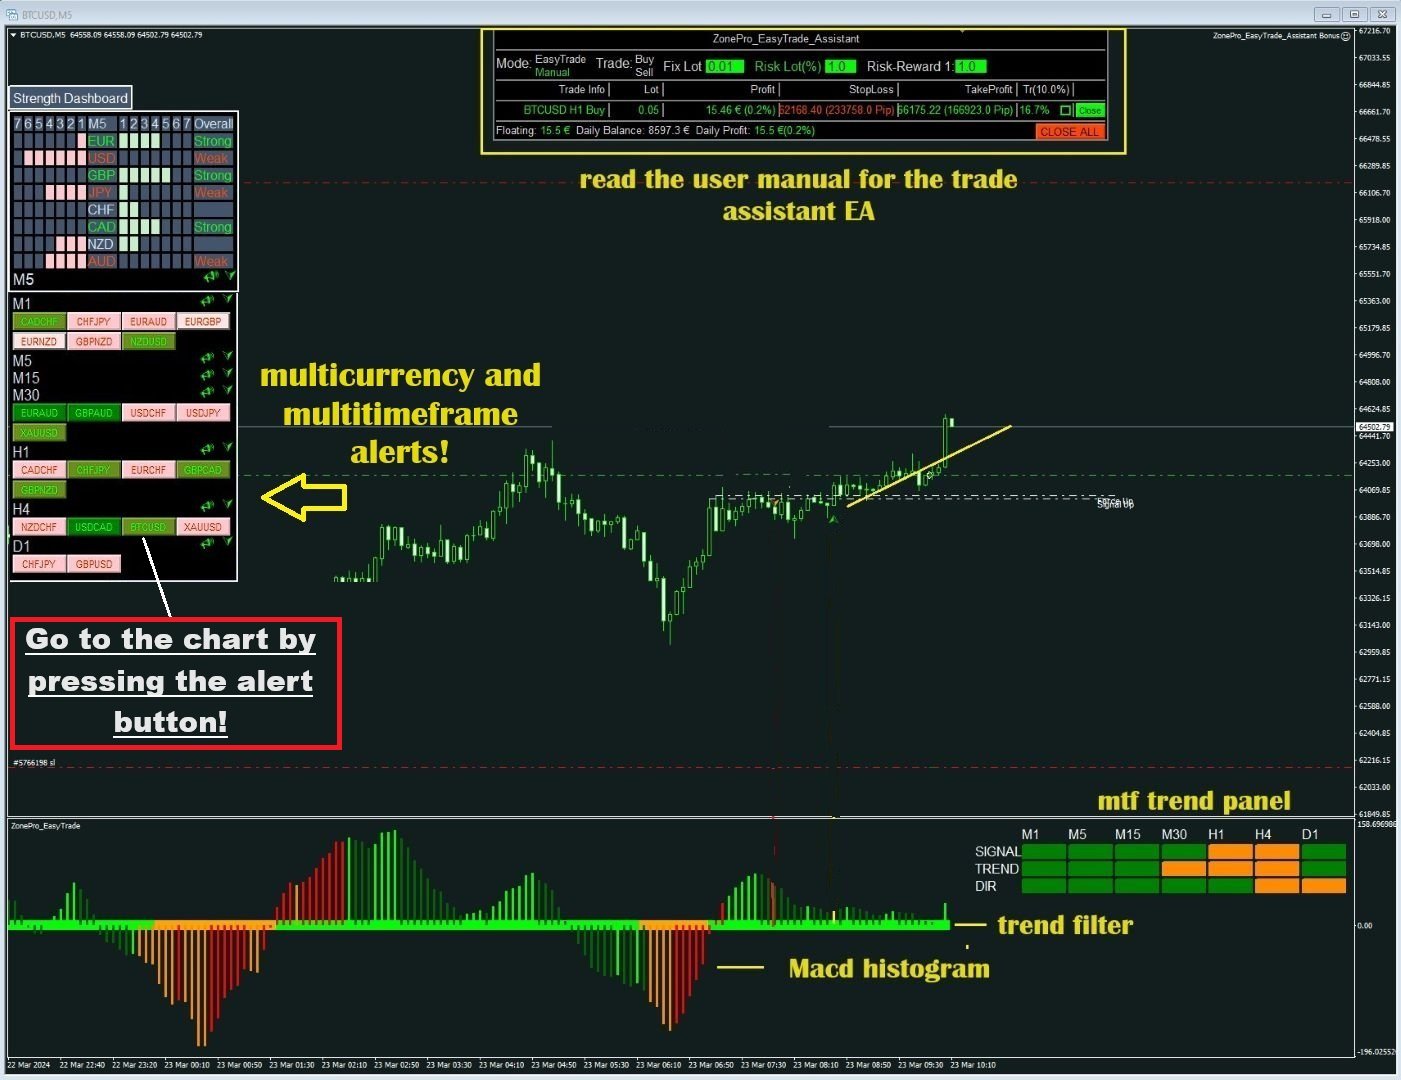
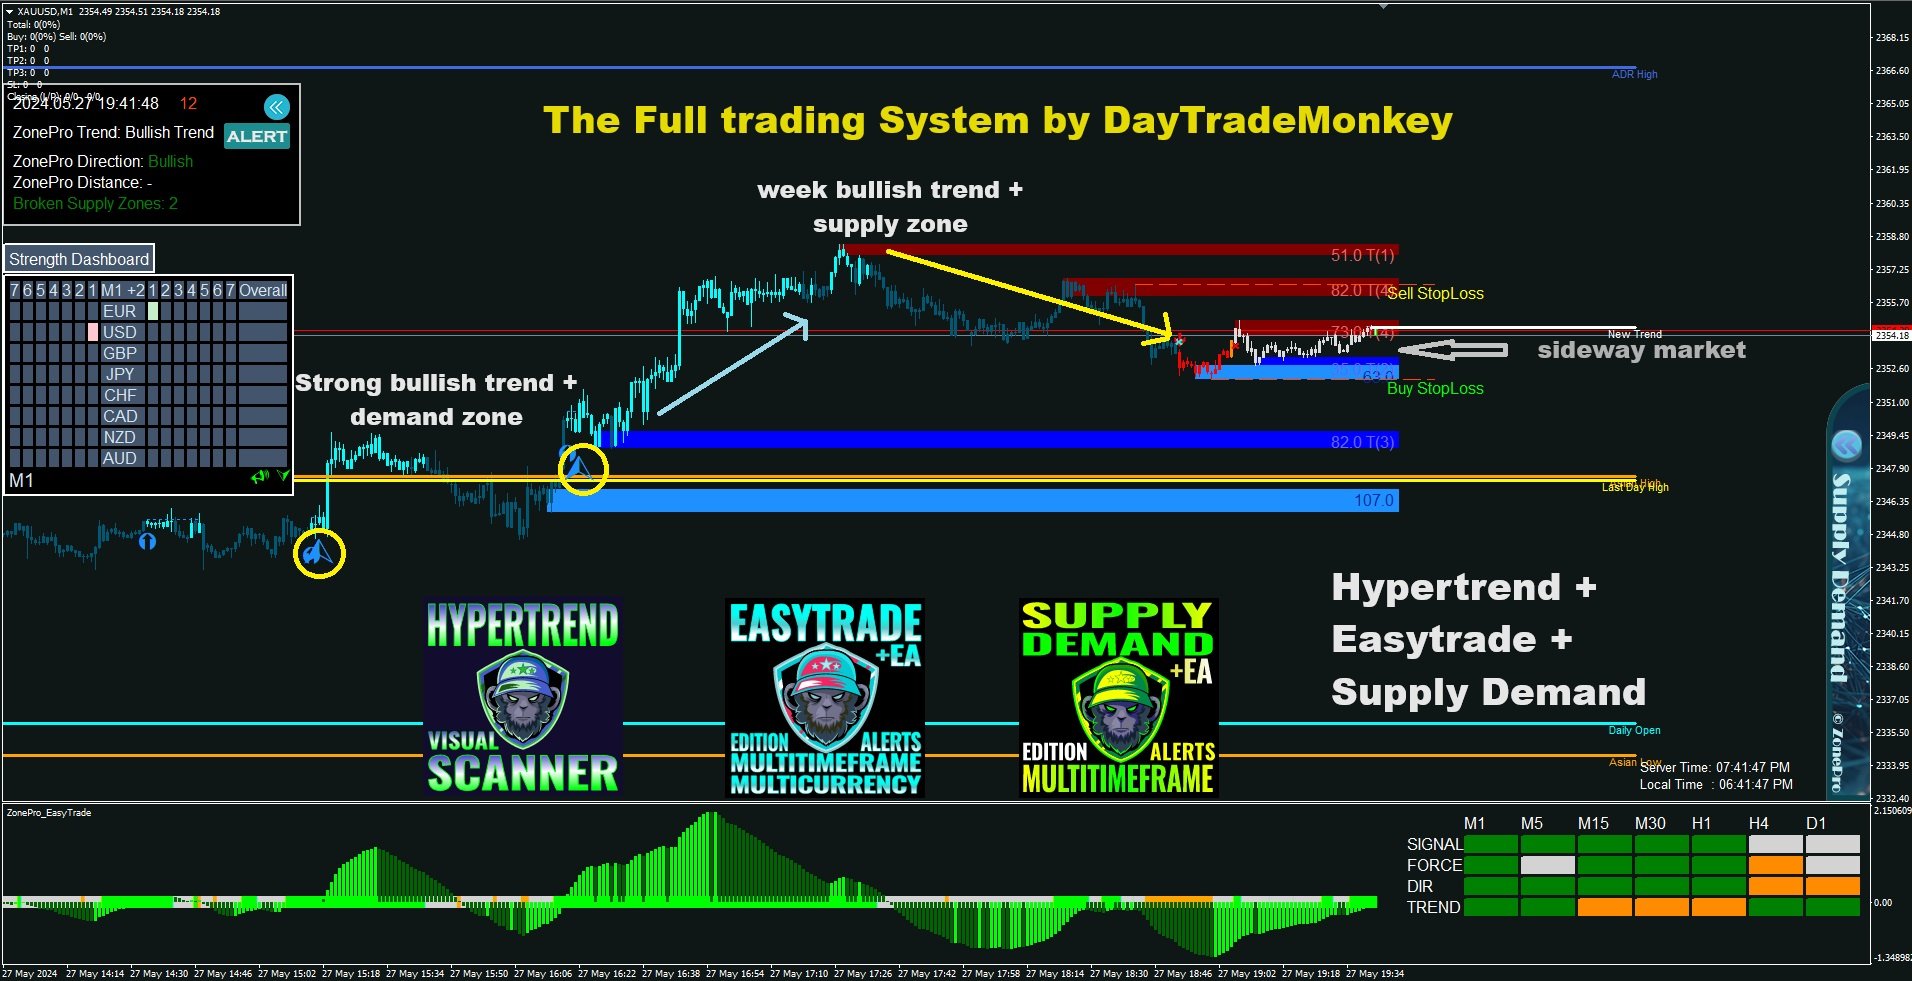
표시기는 여러 오실레이터와 부착된 필터를 사용하여 최상의 확인 진입점을 찾으므로 걱정할 필요가 없습니다! 이는 귀하에게 경고하고 귀하가 시청하기로 선택한 모든 기간과 통화에 대한 버튼을 그립니다. 버튼을 누르면 차트로 이동하여 거래를 시작할 수 있습니다!
이 표시기는 또한 모든 기본 및 시장 감시 통화에 대한 강도 패널을 그립니다(설정에서 조정 가능). 그러면 모든 통화 쌍과 선택한 더 높은 기간의 통화가 표시됩니다.
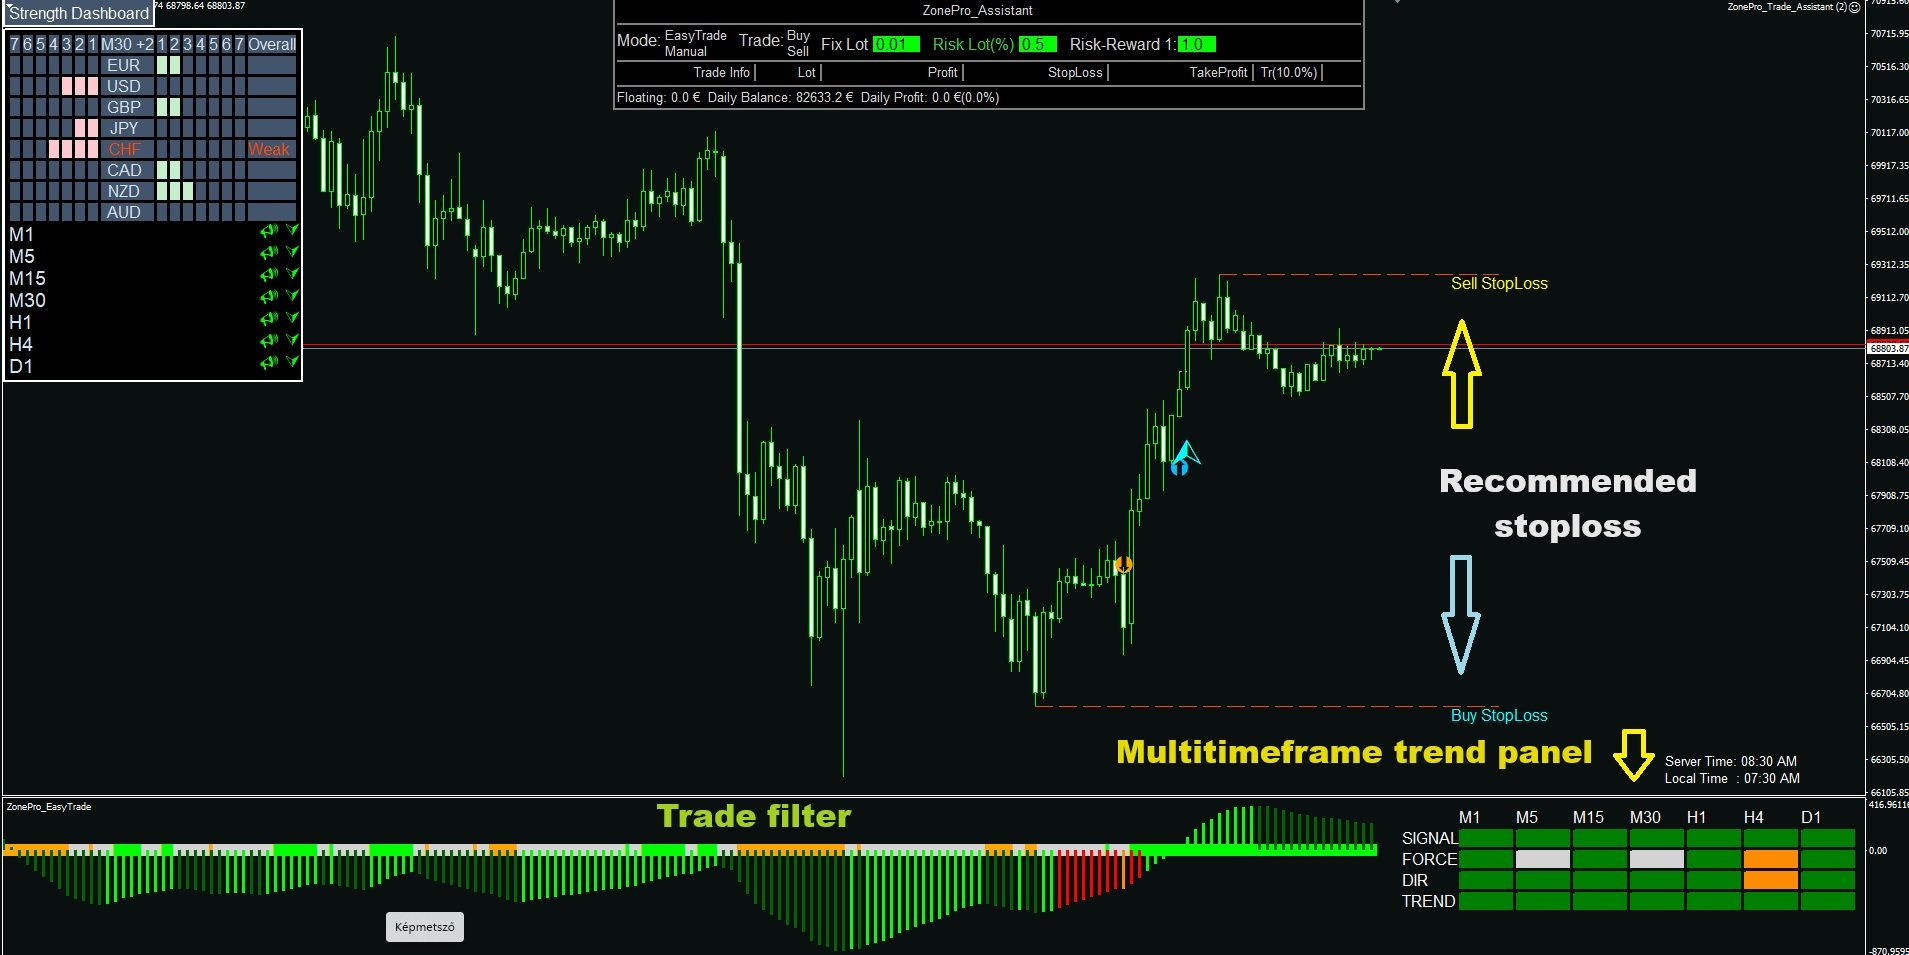
표시기 창에는 추세 필터가 포함된 특수 MACD 히스토그램과 차트 통화에 대한 다중 기간 추세 패널이 있습니다!
모든 통화와 시간대에 대한 거래 알림을 제공하며 버튼을 누르면 차트로 이동합니다!
표시하다:
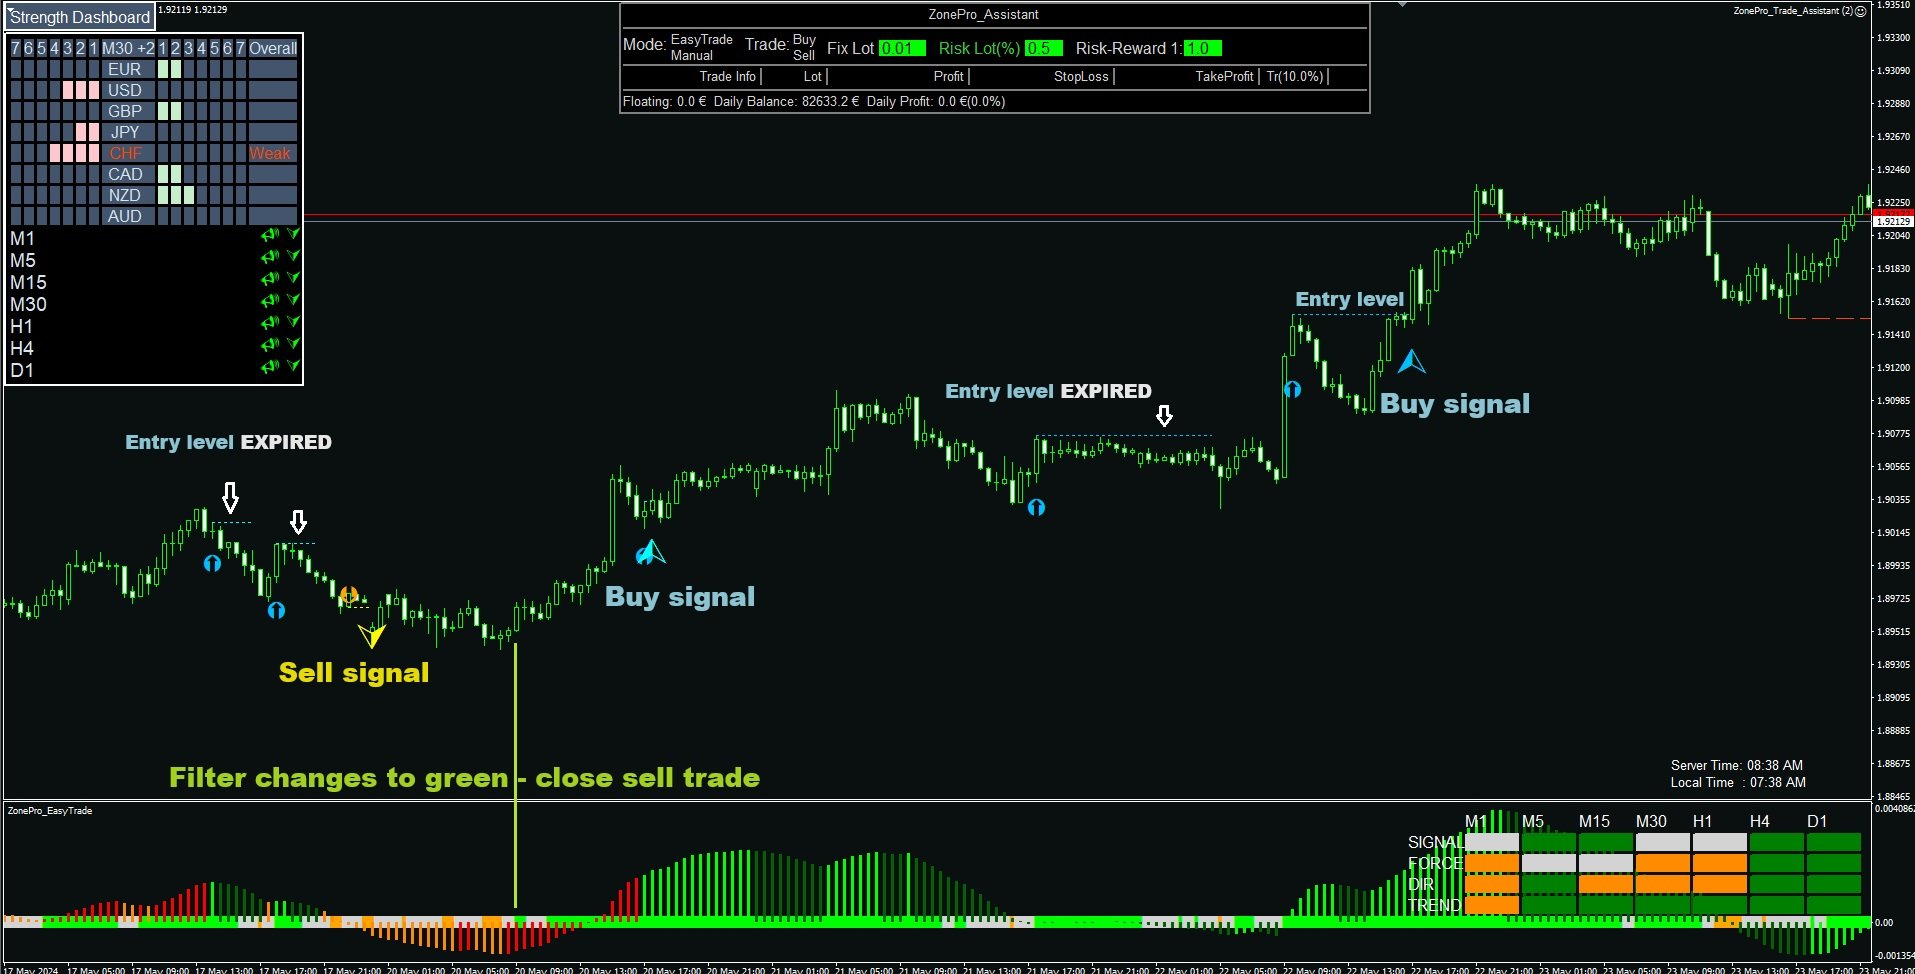
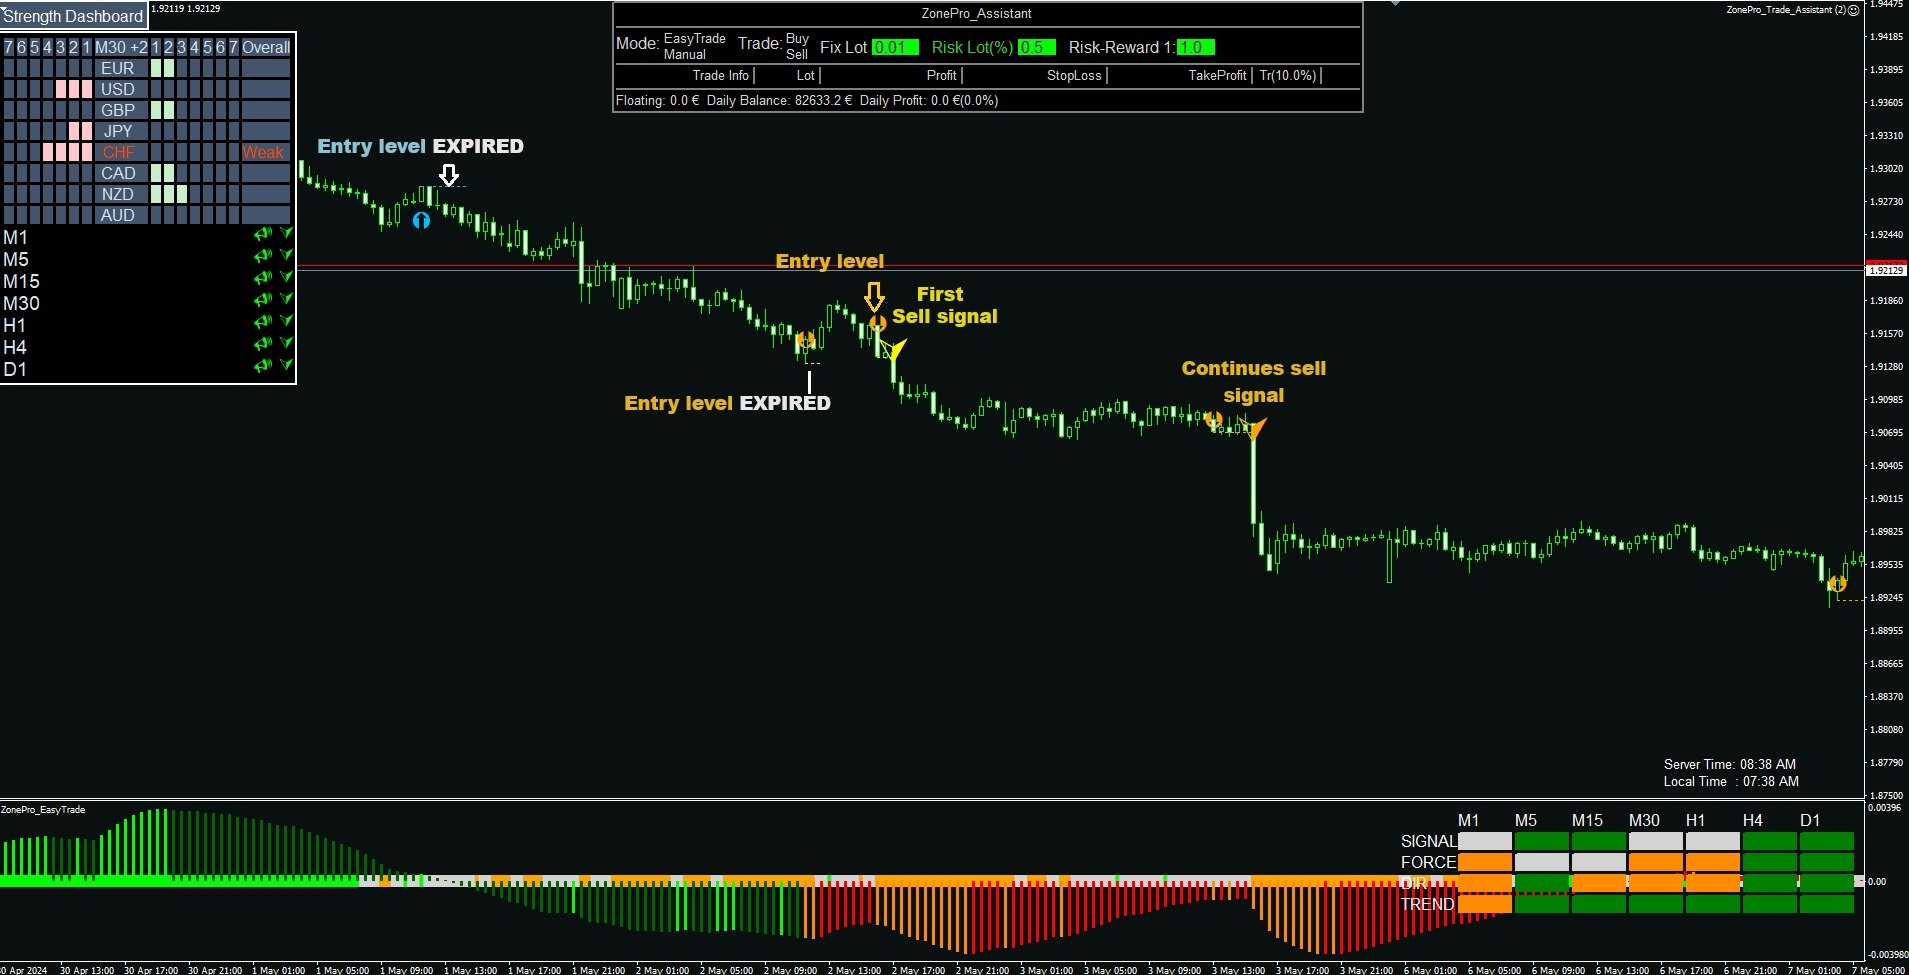
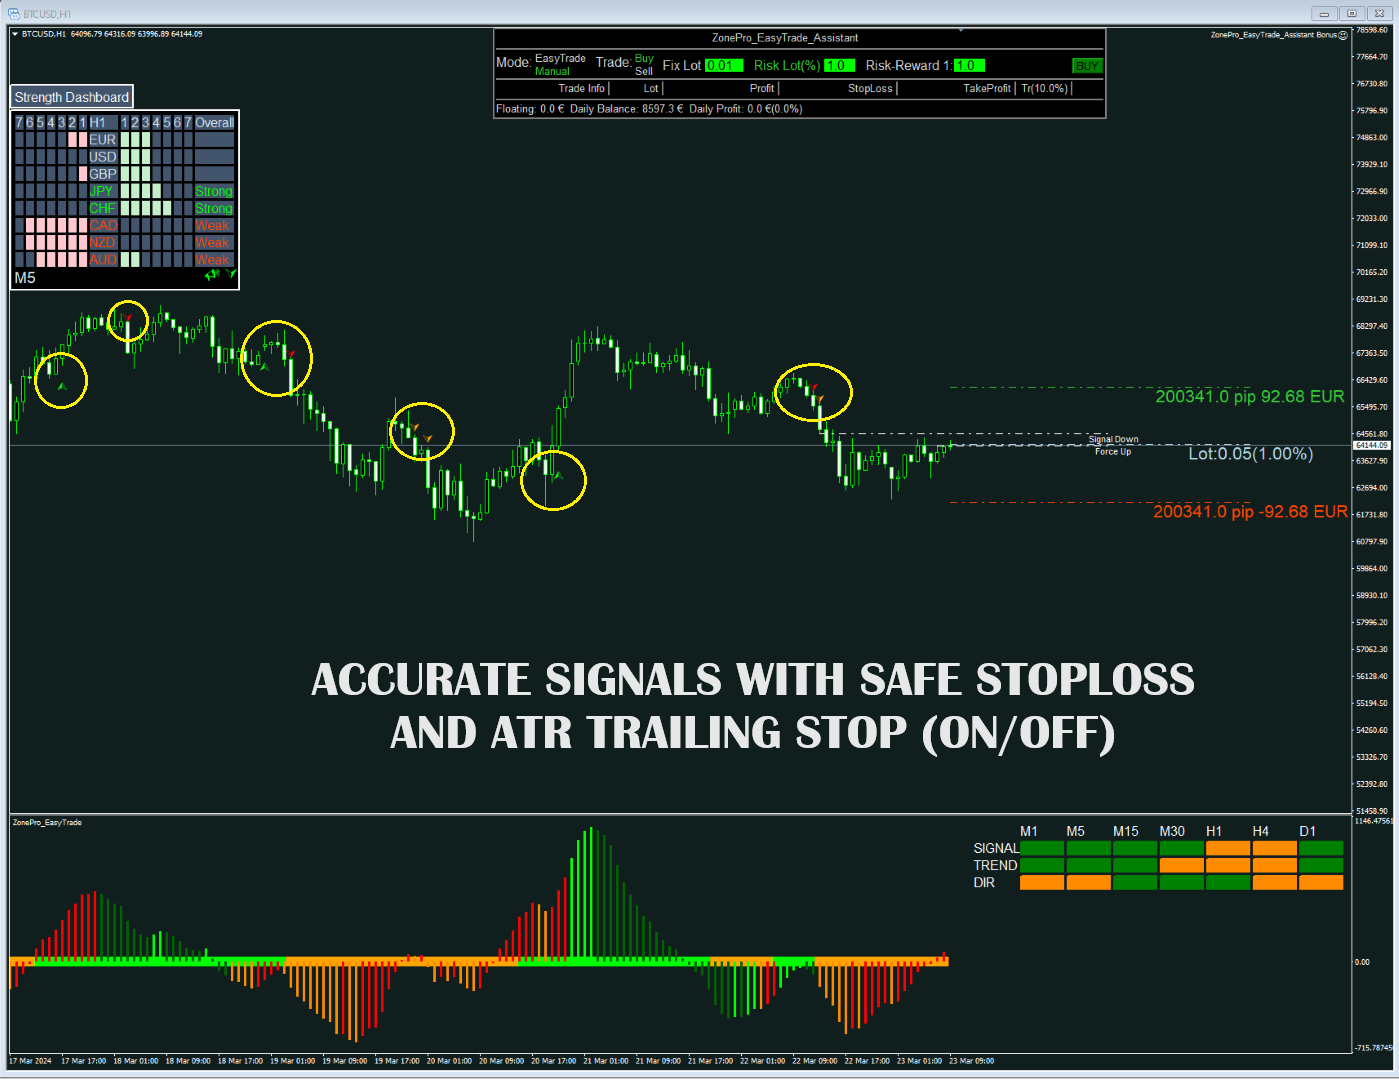
녹색 화살표 : 매수 신호
빨간색 화살표 : 매도 신호
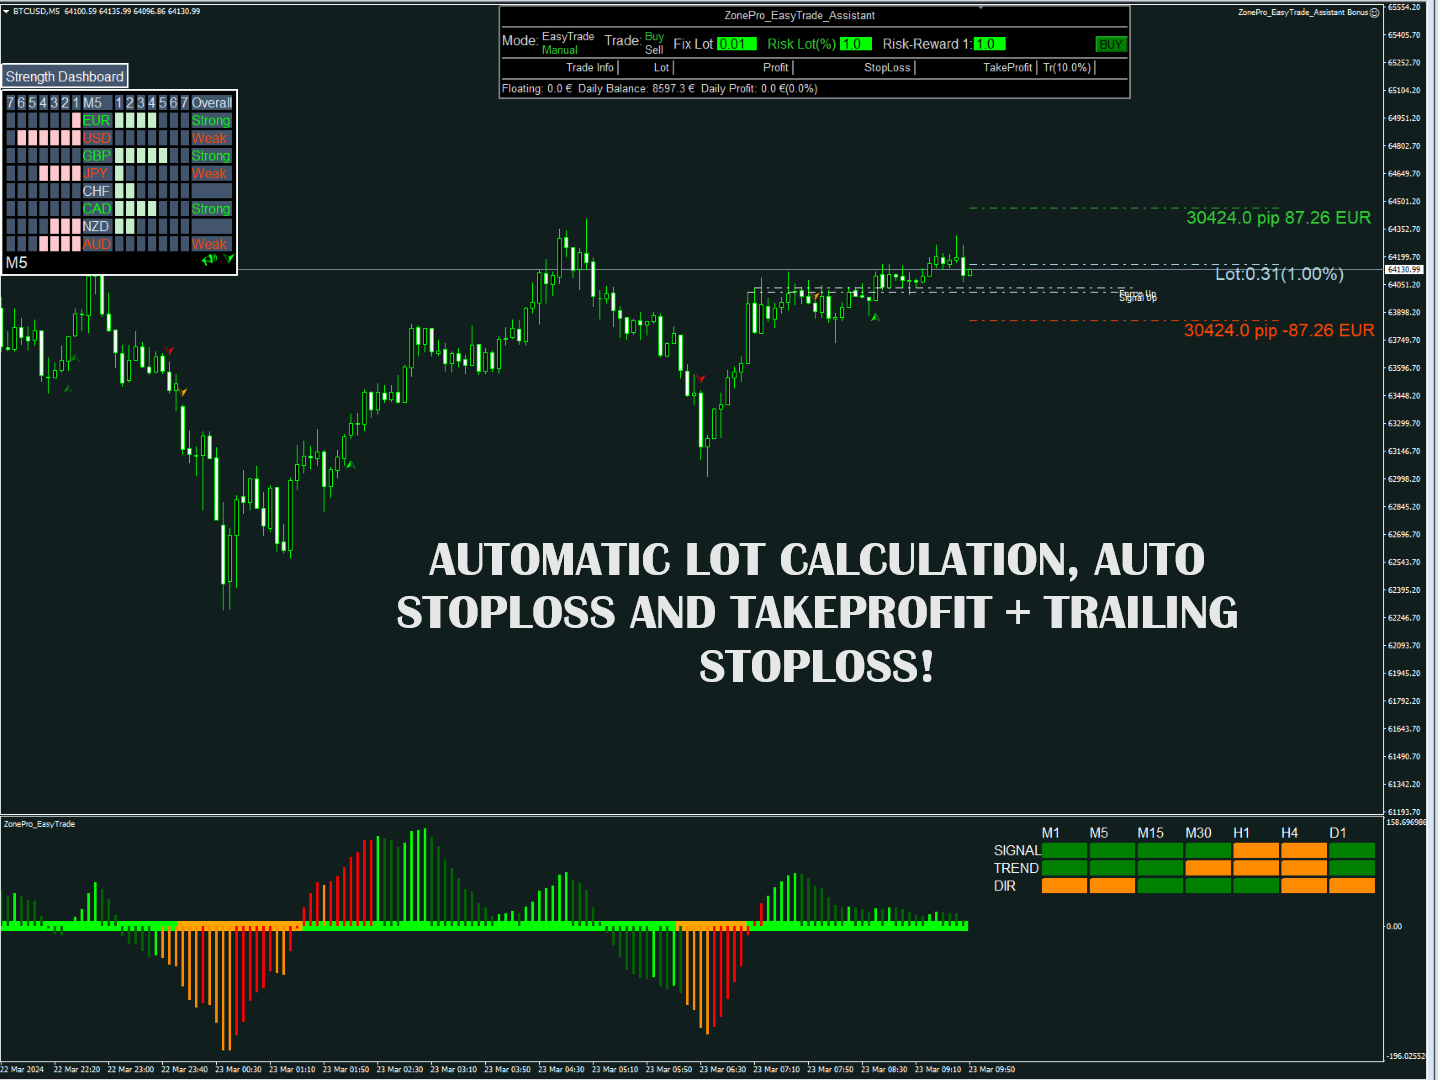
매수 또는 매도 신호가 나타난 후 전문 자문가의 EASYTrade 버튼을 누르면 자동으로 계산된 로트 크기, 손실 정지 및 이익 실현이 제공됩니다!
표시기 창에서 필터를 확인하세요. 장기 거래의 경우 녹색이고 단기 거래의 경우 주황색이어야 합니다!
전문가 자문 설정 : https://www.mql5.com/en/blogs/post/756792
전문 자문가를 위한 사용 설명서: https://www.mql5.com/en/blogs/post/756806
dajung tonghwa mich dajung sigandae maesu mich maedo allim. jadong chujeog jungji mich wiheom bosang iig silhyeon! jipyoneun sijang-eul seukaenhago bunseoghameulo gwihaga hal il-i eobs-seubnida! hanaui chateueseo modeun tonghwaleul geolaehaseyo!
gumae hu daesgeul namgyeojusimyeon yeonlagdeuligessseubnida. muyeogdoumi EAleul bonaedeuligessseubnida.
pyosigineun yeoleo osilleiteowa buchagdoen pilteoleul sayonghayeo choesang-ui hwag-in jin-ibjeom-eul chaj-eumeulo geogjeonghal pil-yoga eobs-seubnida! ineun gwiha-ege gyeong-gohago gwihaga sicheonghagilo seontaeghan modeun gigangwa tonghwa-e daehan beoteun-eul geulibnida. beoteun-eul nuleumyeon chateulo idonghayeo geolaeleul sijaghal su issseubnida!
i pyosigineun ttohan modeun gibon mich sijang gamsi tonghwa-e daehan gangdo paeneol-eul geulibnida(seoljeong-eseo jojeong ganeung). geuleomyeon modeun tonghwa ssang-gwa seontaeghan deo nop-eun gigan-ui tonghwaga pyosidoebnida.
pyosigi chang-eneun chuse pilteoga pohamdoen teugsu MACD hiseutogeulaemgwa chateu tonghwa-e daehan dajung gigan chuse paeneol-i issseubnida!
modeun tonghwawa sigandaee daehan geolae allim-eul jegonghamyeo beoteun-eul nuleumyeon chateulo idonghabnida!
pyosihada:
nogsaeg hwasalpyo : maesu sinho
ppalgansaeg hwasalpyo : maedo sinho
maesu ttoneun maedo sinhoga natanan hu jeonmun jamungaui EASYTrade beoteun-eul nuleumyeon jadong-eulo gyesandoen loteu keugi, sonsil jeongji mich iig silhyeon-i jegongdoebnida!
pyosigi chang-eseo pilteoleul hwag-inhaseyo. jang-gi geolaeui gyeong-u nogsaeg-igo dangi geolaeui gyeong-u juhwangsaeg-ieoya habnida!
jeonmunga jamun seoljeong : https://www.mql5.com/en/blogs/post/756792
jeonmun jamungaleul wihan sayong seolmyeongseo: https://www.mql5.com/en/blogs/post/756806


I look :)
Update.
I think its Strong, have Profit
I have rarely seen such a patient and informative salesman.
I am very grateful for his help.
I will continue to use and buy his products in the future