Indicadores técnicos para MetaTrader 5 - 79

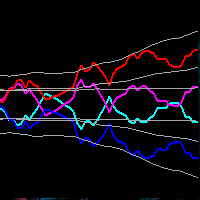
The Fat and Slim indicator tracks strong and weak money in the market. It is derived from RSI, MFI and many similar indicators. Input values are closing prices and volumes. The RSI (yellow curve) is in the range -100 ... 100. It is additionally multiplied by a coefficient so that the curve is not compressed to the middle values at higher periods (a problem with the classic RSI with different periods). Strong/Fat red curve is RSI weighted by higher volumes. Weak/Slim blue curve is calculated so t
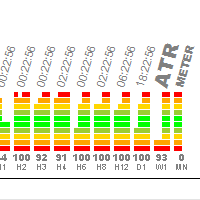
El indicador está diseñado para determinar rápidamente la volatilidad en el instrumento. Es muy conveniente cambiar los gráficos para comprender de inmediato qué instrumentos y períodos de tiempo hay un comercio dinámico y dónde hay una pausa. El indicador utiliza los datos del indicador ATR traducidos en porcentajes. Si aplica ATR en el gráfico, la pantalla mostrará aproximadamente 100-300 barras, promedié este valor y configuré 150 de forma predeterminada (puede cambiar la configuración a su

Vaya con la tendencia. Sí, espera una señal de entrada, ya sea de compra o de venta, y entra con el precio, y se toma la ganancia cuando cambia la línea del dibujo, se contabiliza la ganancia o cuando aparece una señal contraria. Es muy simple y funciona en todos. divisas, metales, índices y en todos los marcos. ¿Cómo entrar? Espere una señal de compra o venta y entre con ella. Puede tomar o reservar ganancias después de que aparezca un cambio en la línea del dibujo o la aparición de una señ
>>> BIG SALE PROMOTION: 50% OFF + GIFT EA! - Promo price: $64 / Regular price $129 <<< - The promotion will end soon!
The Forex Trend Tracker is an advanced tool designed to enhance the trading capabilities of forex traders. This sophisticated indicator uses complex mathematical formulas alongside the Average True Range (ATR) to detect the beginnings of new upward and downward trends in the forex market. It offers visual cues and real-time alerts to give traders a competitive advantage in th

Volume plays a crucial role in trading, serving as a key indicator of market activity and investor sentiment. Here are some important roles of volume in trading:
Confirming trends: Dow Theory emphasizes the importance of volume in determining market trends. Larger volume usually indicates greater disagreement between bulls and bears, while smaller volume may indicate higher market agreement with the current price. Capturing institutional moves: By analyzing volume over a period of time, one c

Overview
In the evolving landscape of trading and investment, the demand for sophisticated and reliable tools is ever-growing. The AI Trend Navigator is an indicator designed to meet this demand, providing valuable insights into market trends and potential future price movements. The AI Trend Navigator indicator is designed to predict market trends using the k-Nearest Neighbors (KNN) classifier.
By intelligently analyzing recent price actions and emphasizing similar values, it help

The Boom300 Spike Indicator is a powerful tool designed to identify significant price spikes in the market.
Key Features: Real-time Spike Detection: The indicator continuously scans the market for sudden spikes in price action, providing timely alerts when significant spikes occur. Customizable Alerts: Traders can customize alerts to suit their preferences, including audible alerts, email notifications, and push notifications to mobile devices. User-Friendly Interface: The indicator offers a

Description: The Spike Sniper Crash Market Indicator is a sophisticated tool designed to identify and navigate volatile market conditions, often associated with sudden price spikes and market crashes. Leveraging advanced algorithms and technical analysis, this indicator serves as a vigilant guardian, alerting traders to potential market disruptions and providing actionable insights to mitigate risks and capitalize on opportunities. Key Features: Precision Spike Detection: The indicator employs c

The indicator determines the ATR value (points) in a classic way (taking into calculation paranormal bars/candles) and more correctly - ignoring paranormal movements of the Instrument. Correctly it is excluding paranormal bars from the calculation, extremely small bars (less than 5%( customizable ) of the standard ATR) and extremely large bars (more than 150% ( customizable ) of the standard ATR) are ignored. This is a Extended version - allows you to set calculation parameters a
This indicator obeys the popular maxim that: "THE TREND IS YOUR FRIEND" Channel indicators incorporate volatility to capture price action. The Bollinger Bands is widely used, however, there are other options to capture swing action opportunities. Each study you will find here is unique, and reveals different types of price action.
https://www.mql5.com/en/market/product/116256
https://www.mql5.com/en/market/product/115553

MultiFractal Levels MultiFractal Levels – es un indicador fractal de Bill Williams modificado con niveles añadidos. Los fractales se construyen a partir de todos los TF permitidos en la configuración.
Los niveles se construyen únicamente en base a los últimos fractales que aún no han sido probados por precio. Ventajas sobre el indicador terminal original: Conveniencia Visibilidad Informatividad Últimos niveles Fractal personalizable Niveles personalizables El indicador es conveniente porque no

This is the MT5 version of Ku-Chart.
This is an indicator devised by Ku-chan, a famous Japanese trader, based on the dealings of Lehman Brothers' discretionary traders. Unify the measuring stick of currencies to display the true value of currencies.
Although it is an indicator, it does not use a buffer and is displayed using objects such as trend lines. Also, instead of drawing on the subchart, it is drawn in an area far above the current price of the main chart, so you can switch from the
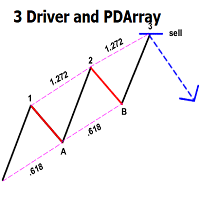
This indicator automatically identifies the SMC 3-Drive pattern and sends notifications to users when the pattern is detected. Additionally, the indicator identifies PDArray (including FVG and OB) and offers an option to combine the 3-Drive pattern with PDArray. This combination provides users with more reliable signals. What is the 3-Drive Pattern? This pattern is formed by three price pushes in one direction, providing a strong reversal signal (Figure 3). The key to identifying this pattern is

Introduction
The "Smart Money Concept" transcends the realm of mere technical trading strategies to embody a comprehensive philosophy on the dynamics of market operations. It posits that key market participants engage in price manipulation, thereby complicating the trading landscape for smaller, retail traders.
Under this doctrine, retail traders are advised to tailor their strategies in alignment with the maneuvers of "Smart Money" - essentially, the capital operated by market makers

Introducing our state-of-the-art Wave Indicator, meticulously designed for the discerning traders of the MQL5 community! At the core of this innovative tool lies an unmatched sensitivity to capture even the slightest market movements. Our Wave Indicator serves as the foundational element for constructing comprehensive trading strategies, providing you with an unwavering edge in the dynamic world of finance. Whether you're aiming to refine short-term tactics or develop long-term systems, this ind

TMA CG FAST MT4 REPLICADO PARA MT5 Cuenta con todas las caracteristicas del original con la funcion adicional de tener señal al fallo que consiste en que despues de una cantidad de velas establecida por el usuario emita una preseñal para una potencial entrada tiene alerta sonora para la posible entrada y la entrada definitiva tiene la posibilidad de repintar o no , queda a eleccion de usuario

Contact me for instruction, any questions! Introduction A flag can be used as an entry pattern for the continuation of an established trend. The formation usually occurs after a strong trending move. The pattern usually forms at the midpoint of a full swing and shows the start of moving. Bullish flags can form after an uptrend, bearish flags can form after a downtrend.
Flag Pattern Scanner Indicator It is usually difficult for a trader to recognize classic patterns on a chart, as well as sear

Contact me for instruction, any questions! Introduction V Bottoms and Tops are popular chart patterns among traders due to their potential for identifying trend reversals. These patterns are characterized by sharp and sudden price movements, creating a V-shaped or inverted V-shaped formation on the chart . By recognizing these patterns, traders can anticipate potential shifts in market direction and position themselves accordingly. V pattern is a powerful bullish/bearish reversal pattern
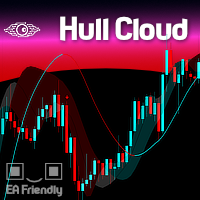
The Hull Moving Average is known for its ability to reduce lag and provide a clearer, more accurate depiction of market trends. By smoothing price data more effectively than traditional moving averages, it helps traders identify trend directions and reversals with greater precision. The Hull Cloud indicator elevates this by using four Hull Moving Averages working together like an orchestra. This combination creates a dynamic system that highlights short, medium, and long-term trends, giving trad
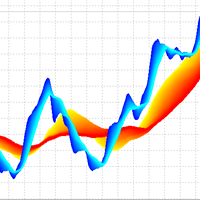
3D Trend Indicator is a non-repaint indicator using multiple moving averages with a 3D surface view. By using this indicator, you can remove uncertainties that can happen using a single and fixed moving average period. You can use a cloud area using a range of moving average periods. Also a wide range of visual settings are added to this indicator to have a better view from the cloud area. Alert and notification system added to the indicator to inform the trader about the action of candles on t
Apresentamos o Indicador de novo grafico - uma ferramenta poderosa para traders que buscam uma análise de preço suave e clara. Este indicador inovador calcula a média simples dos preços, oferecendo uma visão precisa e ajustada dos movimentos do mercado. Como Funciona : O Indicador de Média de Preços Simples (SMA) utiliza uma fórmula simples e eficaz: Ele soma o valor do último preço com o preço anterior. Em seguida, divide essa soma por 2 para obter a média. Fórmula : SMA = U ˊ ltimo Pre c ¸ o +

MinMax Levels MinMax Levels – es un indicador de los niveles de precio máximo, mínimo y de apertura para períodos comerciales importantes: día, semana y mes.
Cada participante del mercado Forex utiliza niveles en su sistema comercial. Pueden ser la señal principal para realizar transacciones o una adicional, actuando como una herramienta analítica. En este indicador se seleccionaron los días, semanas y meses como períodos importantes, ya que son los períodos comerciales clave de los grande
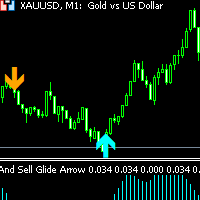
Buy and Sell Glide Arrow non-repaint and arrow appears on current candlestick orange arrow is a sell signal blue arrow is a buy signal Buy and Sell Glide Arrow works on 1 minute, 5 minutes and 15 minutes timeframes only as it is a scalping indicator. Pairs to trade: Forex pairs such as EURUSD,GBPUSD and other METALS: XAUUSD(GOLD) and other INDICES: Boom and crash 1000, Volatility Pairs such as VIX 10 - VIX 100 and other Lastly BTC AND LTC and other

Si necesita un indicador que muestre los puntos de entrada al mercado, este es su indicador.
El indicador no se vuelve a dibujar. Muestra puntos de compra y venta para cualquier TF (período de tiempo) y cualquier par de divisas. Los ajustes son ajustables para todos los instrumentos. Puede configurar cada parámetro para cualquier corredor, para cualquier cuenta.
Esta es una ALMOHADA que es cómoda :)) Solo compruébalo......

Conquistador is a fundamental technical indicator designed to assess the current market situation and determine the optimal entry and exit points in the currency pairs market with minimal risk. This indicator was created on the basis of original indicators for searching for extremes and is excellent for determining a reversal or sharp movement of the market. Thanks to Conquistador, you can recognize such moments in a timely manner and receive notifications in the form of colored dots on the cha

Description of the Indicator The indicator "BullsBearsPulse" is designed for MetaTrader 5 and provides a visual representation of the Bulls Power and Bears Power indicators. These indicators are useful tools for technical analysis, particularly for the EUR/USD currency pair, to help traders identify potential trading opportunities. Functionality Bulls Power : This indicator measures the strength of the bulls (buyers) in the market. It calculates the difference between the highest price and a 20

The Engulf Seeker indicator is a powerful tool designed to detect engulfing candlestick patterns with precision and reliability. Built on advanced logic and customizable parameters, it offers traders valuable insights into market trends and potential reversal points.
Key Features and Benefits: Utilizes revised logic to analyze previous candles and identify strong bullish and bearish engulfing patterns. Convenient arrow-based alert system notifies traders of pattern occurrences on specific symb

This spread indicator displays the actual spread of each candle. It highlights the maximum spread and the minimum spread of the chosen symbol. This indicator is very helpful to see in real time the spread evolution helping to avoid taking a trade when the spread is too high.
Inputs:
Print value in Points: if true displays the spread as a whole number
D isplay minimum and maximum spread of the past N days: select the number of days to consider the maximum and minimum spread
Automatically
===> ¿Qué hace este indicador? Dibuja solo un SMA promedio con la elección del plazo
Puse este indicador en sus gráficos tantas veces como necesite el promedio.
¡Elija los parámetros y características de su promedio y eso es todo! **** Ver captura de pantalla 01 a 02
No dude en solicitarme que el código Icustom integre fácilmente este promedio en sus propios códigos, otro indicador o EA
Elegir El plazo objetivo El número de períodos El retraso El ohlc deseado Color de moda Puede encon
===> ¿Qué hace este indicador? Dibuja solo un EMA promedio con la elección del plazo
Puse este indicador en sus gráficos tantas veces como necesite el promedio.
¡Elija los parámetros y características de su promedio y eso es todo! **** Ver captura de pantalla 01 a 02
No dude en solicitarme que el código Icustom integre fácilmente este promedio en sus propios códigos, otro indicador o EA
Elegir El plazo objetivo El número de períodos El retraso El ohlc deseado Color de moda Puede encon
===> ¿Qué hace este indicador? Dibuja solo un SMMA promedio con la elección del plazo
Puse este indicador en sus gráficos tantas veces como necesite el promedio.
¡Elija los parámetros y características de su promedio y eso es todo! **** Ver captura de pantalla 01 a 02
No dude en solicitarme que el código Icustom integre fácilmente este promedio en sus propios códigos, otro indicador o EA
Elegir El plazo objetivo El número de períodos El retraso El ohlc deseado Color de moda Puede enco
===> ¿Qué hace este indicador? Dibuja solo un LWMA promedio con la elección del plazo
Puse este indicador en sus gráficos tantas veces como necesite el promedio.
¡Elija los parámetros y características de su promedio y eso es todo! **** Ver captura de pantalla 01 a 02
No dude en solicitarme que el código Icustom integre fácilmente este promedio en sus propios códigos, otro indicador o EA
Elegir El plazo objetivo El número de períodos El retraso El ohlc deseado Color de moda Puede enco

¡Optimiza tus estrategias de trading con el indicador RAR (Relative Adaptive RSI)! Este avanzado indicador de análisis técnico combina la potencia del índice de fuerza relativa (RSI) con técnicas adaptativas, proporcionando señales más precisas y confiables que un oscilador común. ¿Qué es el Indicador RAR? El RAR es un indicador diseñado para MetaTrader 5 que utiliza medias móviles exponenciales (EMA) y medias móviles adaptativas (AMA) para suavizar el RSI y ajustarlo dinámicamente a las condici
=== > ¿Qué hace este indicador? Traza una línea que representa la Supertendencia, basada en un ATR
Elegir El múltiplo ATR El período ATR y es todo !!! **** Ver captura de pantalla 01 a 2
No dudes en pedirme el código iCustom para integrar fácilmente esta SuperTrend en tus propios códigos.
=== > Ejemplo sobre Bitcoin **** Ver captura de pantalla 03
=== > ¿Para quién? Si usted es un operador discrecional, un operador algorítmico o un desarrollador, el indicador está diseñado para satisfac

The Trendy SMC indicator monitors trends and SMC concepts from multiple timeframes, allowing you to see what's happening from different perspectives, but on the one chart.
It is designed to help with a range of trading strategies related to trends and SMC concepts (such as Premium / Discount prices, Fib retracement levels and Fair Value Gaps). Features include:
Determining the trend based on market structure (breaks of highs and lows) Displaying the current trading range (between the recent s

This is the test product. Please, DO NOT BUY IT! This is the test product. Please, DO NOT BUY IT! This is the test product. Please, DO NOT BUY IT! This is the test product. Please, DO NOT BUY IT! This is the test product. Please, DO NOT BUY IT! This is the test product. Please, DO NOT BUY IT! This is the test product. Please, DO NOT BUY IT! This is the test product. Please, DO NOT BUY IT!
Compruebe lo fácil y sencillo que es comprar un robot en la MetaTrader AppStore, la tienda de aplicaciones para la plataforma MetaTrader.
El Sistema de pago MQL5.community permite efectuar pagos con ayuda de PayPal, tarjeta bancaria y los sistemas de pago más populares. Además, le recomendamos encarecidamente testar el robot comercial antes de la compra, para así hacerse una idea más completa sobre él.
Está perdiendo oportunidades comerciales:
- Aplicaciones de trading gratuitas
- 8 000+ señales para copiar
- Noticias económicas para analizar los mercados financieros
Registro
Entrada
Si no tiene cuenta de usuario, regístrese
Para iniciar sesión y usar el sitio web MQL5.com es necesario permitir el uso de Сookies.
Por favor, active este ajuste en su navegador, de lo contrario, no podrá iniciar sesión.