Rate of MACD
Question ...
don't like MACD that much, always keep on changing -- so harder to use
but this picture look interesting, give it a go
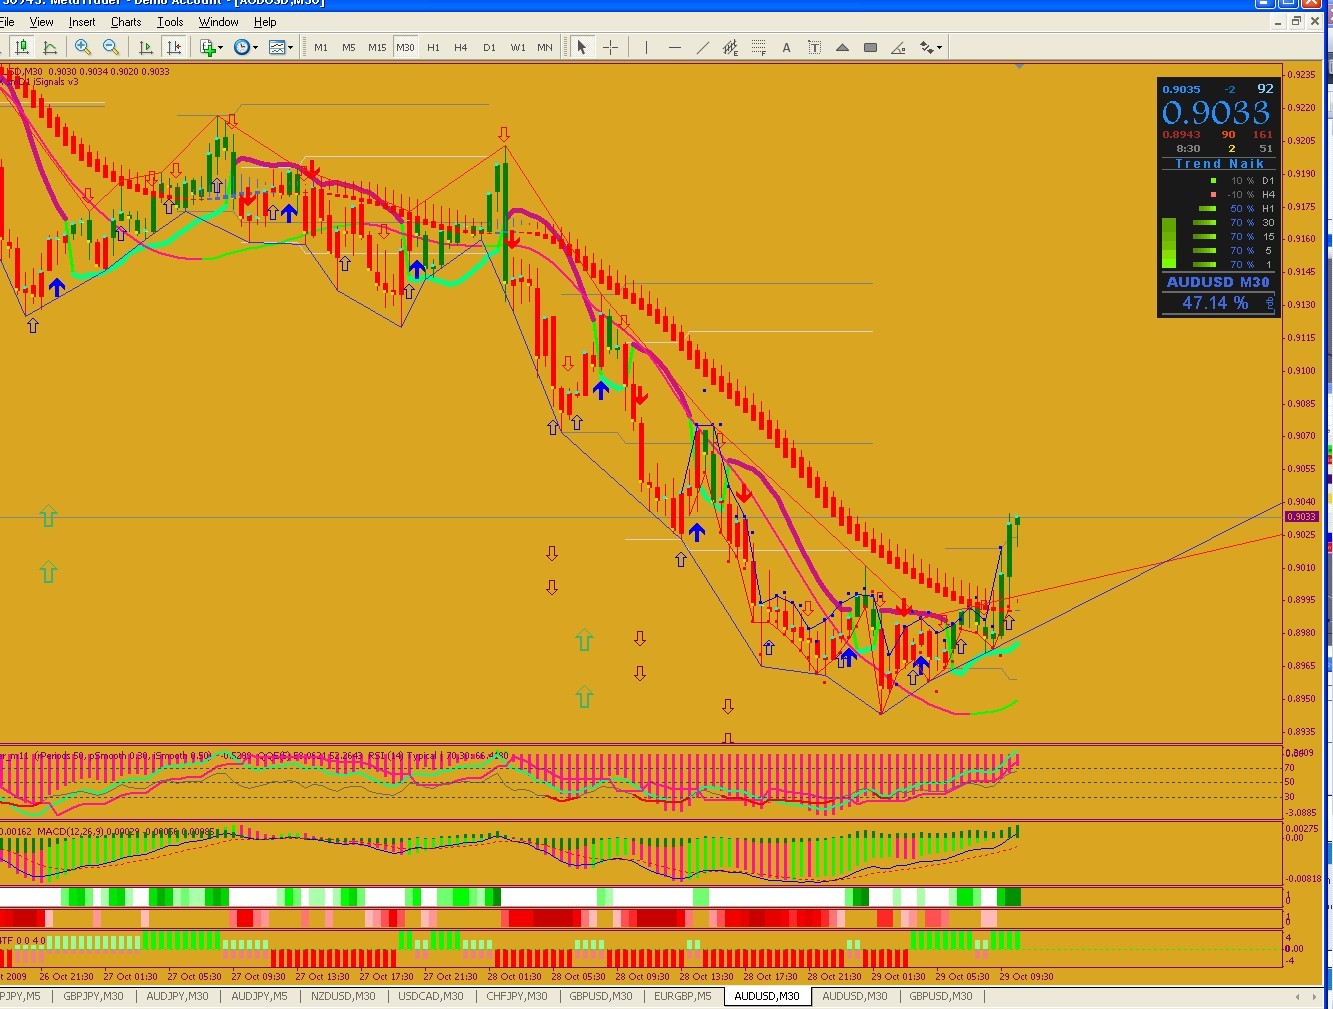
and mine is on 30M chart
look very different from yours though

Thanks for your interest buddy.
I did not get your point when you said Give it a GO. You mean to say try your set-up or the one that I am testing at the moment. Sorry for not getting your point on that. As far as our charts are concerned while I am checking it on 1H, yours is on 30m. I do not have any strategy for 30m chart that I can trade. I would still appreciate if I can get this indicator for MT4 so that I can test it.
Thanks buddy...
Cheers,
Yusuf SHAIKH
Sincere Thanks
I also have added in 2 extra inputs which show/hide the Zero level or Histogram just in case you need to display them.
[attach]92298[/attach]
[attach]92297[/attach]Hello cja...
I don't have words to thank you Sir. Forex TSd has always helped me whenever I needed them. My response will be in terms of the results of the startegy under test if it turns out to be profitable. Infact I lost one trade today becaue I was an idiot to take it against the direction it was showing.
No worries. I am still alive and looking forward to trading better. Your work for this indicator has given me reasons to do my research this week-end and I just hope that I extract something fruitful out of that.
Sincere thanks once again for your kindness.
Cheers...
Yusuf SHAIKH
MACD Dots
hi everyone...
I am testing a strategy on 1h time frame for eur/usd but my problem is that i do not have this indicator on mt4 though i designed it on ninja trader but don't know about coding in mt4. I just request any one of you to use their expertise and code it if possible.
I am uploading 3 screenshots to let you know what it does.
Let us assume that we are starting from the vertical line marked at screen 1. So starting from screen 1: Take this as the starting point where macd value reads -0.00651. So assign a = -0.00651
screen 2: Macd = -0.00658. So assign b = -0.00658
screen 3: Macd = -0.00653. So assign c = -0.00653
what i am trying to do is to check the rate at which macd is changing. It means to check the differences and compare between (c - b) with (b - a).
In this example:
(c - b) = (-0.00653) - (-0.00658) = 0.00005
(b - a) = (-0.00658) - (-0.00651) = -0.00007
clearly (c - b) > (b - a)
hence at the close of the current bar as at screen 3, this indicator must plot a blue color dot on the macd as shown in the image.
Summary:
The logic can be summerized as follows:
If (macd at current closed bar - macd of previous bar) > (macd of previous bar - macd of previous to previous bar, 2 bars ago from current closed bar) then plot blue dot on the macd at the close of current bar.
If (macd at current closed bar - macd of previous bar) < (macd of previous bar - macd of previous to previous bar, 2 bars ago from current closed bar) then plot red dot on the macd at the close of current bar.
I hope to have explained the requirement of this indicator properly.
While i still await to see the results from this indicator and if productive, it can be shared in this forum.
Please, make arrangements to allow user defined fast, slow and signal values for macd and also the choice to select colors for dots.
I am attaching the macd true indicator just in case.
Thanks for your time and effort.
Best regards,
yusuf shaikhI also have added in 2 extra inputs which show/hide the Zero level or Histogram just in case you need to display them.
I have had a think about this indicator and i have changed the basic look back logic which i think improves the indicator and removes a lot of the noise, give it a go and let me know what you think.
Strategy - 5m Using EMA60 (Close)
Hi...
First of all let me tell you that I trade Euro Future Contracts where 1 Tick movement is equal to USD 12.5 and therefore I prefer scalping for 2 to 3 trades at the most per day and attain my target. I aim at achieving minimum 5 Ticks per scalp trade. this strategy may best be suited with 2 or 3 contracts where you have runners to maximise profits. The rules and indicators are as follows.
Indicators:
EMA 5 (Close) - Yellow Thin Line
EMA 20 (Close) - Sienna Thin Line
EMA 60 (Close) - Yellow thick Line
MACD Dots (5,34,5)
Entry Rules:
LONG:
What to look for:
1: MACD Dots crosses from below Zero to above Zero
2: MACD Dots color is Blue at the close of the candle
3: Price closes above EMA 60 (Close)
4: EMA5 > EMA20
SHORT:
What to look for:
1: MACD Dots crosses from above Zero to above Zero
2: MACD Dots color is Red at the close of the candle
3: Price closes below EMA 60 (Close)
4: EMA5 < EMA20
Enter at the open of next candle.
STOP LOSS:
Place any safe Stop Loss you may desire based on the risk you can handle. However exit the trade immediately once EMA 5 crosses EMA 20 in the opposite direction.
Trailing Take Profits:
Once the trade shows green, exit 2 contracts at 5 ticks of profit and auto trail the 3rd one to break-even. If the trend continues, this 3rd one fetches trade for the week.
Test it as changes and improvements are most welcome. This was simple stuff that I observed while checking the PA. Let me know where it fails and we will try to add some filters if at all required to avoid these trades. Hope it helps the community. I am attaching the template that has trigger lines and arrows of enteries added manually on the chart that may help a trader to understand how to enter the trade using this concept. Attached are also the screenshots for both types of enteries.
Thanks for your participation and thanks once again to my friend from New Zealand cja without whose help I would not be in a position to post this simple strategy. Buddy, you are right, I am from Australia but at the moment I am in India to meet my family members.
Take care everybody,
Best regards,
Yusuf SHAIKH
Strategy 2 - Loss of Momentum and Continuation - 1H
Hi All...
I am here with another strategy that can be applied on 1H time frame. I trade only Euro, just four your kind info.
The idea behind this trade is identifying the loss of developing momentum or you can say continuation of what market has decided earlier.
How to identify this?
I imagine it to be as simple as reading the Rate of MACD indicator woth setting (5,34,5) on 1H time frame chart.
Long SetUp:
Let the dots cross the Signal line COMPLETELY and form the 1st Blue Dot. Be prepared to watchout for a Red Dot formation. This signifies a pause in the momentum. Once the Red Dot confirms, wait for next confirmation of CONTINUATION by Blue Dot formation again, in all cases the dots must remain above Signal line on MACD. Once Blue Dot appears, lets call the respective candle as trigger Candle and enter at the open of next candle after trigger candle. Stop loss at 1 Tick below the trigger candle. Take profit between 15 to 25 ticks for the 1st contract and trail the 2nd contract as runner.
Short SetUp:
Reverse of the logic descibed for Long SetUp.
NOTE:
This strategy is effective if taken at the initial stage of cross between dots and signal line. Why I say so is to ensure that we enter the trade at the initial stage of its development rather than the stage when the market has moved far away from the desired entries.
Attached image showing both setups.
Hope that helps.
Cheers,
Yusuf SHAIKH
Awesome Job Yusuf!

And Also CJA -- As Usual...
Strategy - 1: 5m Using EMA60 (Close)
Hi...
Template attached with updated marked enteries for Trigger Line followed by Entry Arrows. Could be good for further studies.
I understand how to call off this trade and prepare to take losses. What I am trying to learn now as to how can we grab max. out of this setup though I am able to get the conservative 5 ticks very easily. Expert comments from traders are welcomed.
Cheers,
Yusuf SHAIKH
- Free trading apps
- Over 8,000 signals for copying
- Economic news for exploring financial markets
You agree to website policy and terms of use
Hi everyone...
I am testing a strategy on 1H time frame for EUR/USD but my problem is that I do not have this indicator on MT4 though I designed it on Ninja Trader but don't know about coding in MT4. I just request any one of you to use their expertise and code it if possible.
I am uploading 3 screenshots to let you know what it does.
Let us assume that we are starting from the vertical line marked at Screen 1. So starting from Screen 1: Take this as the starting point where MACD value reads -0.00651. So assign a = -0.00651
Screen 2: MACD = -0.00658. So assign b = -0.00658
Screen 3: MACD = -0.00653. So assign c = -0.00653
What I am trying to do is to check the rate at which MACD is changing. It means to check the differences and compare between (c - b) with (b - a).
In this example:
(c - b) = (-0.00653) - (-0.00658) = 0.00005
(b - a) = (-0.00658) - (-0.00651) = -0.00007
Clearly (c - b) > (b - a)
Hence at the close of the current bar as at Screen 3, this indicator must plot a Blue Color Dot on the MACD as shown in the image.
Summary:
The logic can be summerized as follows:
If (MACD at Current Closed Bar - MACD of Previous Bar) > (MACD of Previous Bar - MACD of Previous to Previous Bar, 2 Bars ago from Current Closed Bar) then Plot Blue Dot on the MACD at the close of current bar.
If (MACD at Current Closed Bar - MACD of Previous Bar) < (MACD of Previous Bar - MACD of Previous to Previous Bar, 2 Bars ago from Current Closed Bar) then Plot Red Dot on the MACD at the close of current bar.
I hope to have explained the requirement of this indicator properly.
While I still await to see the results from this indicator and if productive, it can be shared in this forum.
Please, make arrangements to allow user defined Fast, Slow and Signal Values for MACD and also the choice to select colors for dots.
I am attaching the MACD True indicator just in case.
Thanks for your time and effort.
Best regards,
Yusuf SHAIKH