This indicator obeys the popular maxim that: "THE TREND IS YOUR FRIEND" It paints a GREEN line for BUY and also paints a RED line for SELL. (you can change the colors). It gives alarms and alerts of all kinds. IT DOES NOT REPAINT and can be used for all currency pairs and timeframes. Yes, as easy and simple as that. Even a newbie can use it to make great and reliable trades. NB: For best results, get my other premium indicators for more powerful and reliable signals. Get them here: https://www.m
What is this indicator? This indicator is the MACD (Moving Average Convergence/Divergence) supporting Virtual Trading mode of Knots Compositor . When the mode is turned on, the indicator will be recalculated based on the displayed candlesticks. When the mode is turned off, the indicator will be recalculated based on the original chart candlesticks.
Types of the applied price - Close - Open - High - Low - Median Price (HL/2) - Typical Price (HLC/3) - Weighted Price (HLCC/4)
KC-Indicators
This indicator will mirror the assets in use in another metatrader, being able to choose the timeframe and a template. This is the Metatrader 5 Client, it needs the Metatrader 4 or 5 Server versions: Metatrader 4 Mirror Chart Server: https://www.mql5.com/en/market/product/88644
Metatrader 5 Mirror Chart Server: https://www.mql5.com/en/market/product/88652 Details of how it works in the video.
Donchian Channel DC is the indicator of Donchian Channels, that plots maximum and minimum values of a specific period, besides mean value line. It´s possible to configure simple period for analysis and the indicator will plot all three values. You can trade with this indicator as trend or reversal, according to each strategy. Do not let to test others indicators as soon as others expert advisors.
A professional tool for trading - the divergence indicator between the RVI and the price, which allows you to receive a signal about a trend reversal in a timely manner or catch price pullback movements (depending on the settings). The indicator settings allow you to adjust the strength of the divergence due to the angle of the RVI peaks and the percentage change in price, which makes it possible to fine-tune the signal strength. The indicator code is optimized and is tested very quickly as p
This indicator displays Pivot-Lines, preday high and low, preday close and the minimum and maximum of the previous hour. You just have to put this single indicator to the chart to have all these important lines, no need to setup many single indicators.
Why certain lines are important Preday high and low : These are watched by traders who trade in a daily chart. Very often, if price climbs over or falls under a preday low/high there is an acceleration in buying/selling. It is a breakout out of
The indicator analyzes the volume scale and splits it into two components - seller volumes and buyer volumes, and also calculates the delta and cumulative delta. The indicator does not flicker or redraw, its calculation and plotting are performed fairly quickly, while using the data from the smaller (relative to the current) periods. The indicator operation modes can be switched using the Mode input variable: Buy - display only the buyer volumes. Sell - display only the seller volumes. BuySell -
Order Book, known also as Market Book, market depth, Level 2, - is a dynamically updated table with current volumes of orders to buy and to sell specific financial instument at price levels near Bid and Ask. MetaTrader 5 provides the means for receiving market book from your broker, but in real time only, without access to its history. The indicator OrderBook Cumulative Indicator accumulates market book data online and visualizes them on the chart. In addition, the indicator can show the market
This indicator is a zero-lag indicator and displays strength of trend change . True Trend Oscillator Pro works best in combination with True Trend Moving Average Pro that displays exact trend as is. Oscillator value is exact price change in given direction of the trend.
True Trend Moving Average Pro: https://www.mql5.com/en/market/product/103586
If you set PERIOD input parameter to 1 this indicator becomes a sharpshooter for binary options.
Developers can use True Trend Oscillator in E
This indicator is especially for the binary trading. Time frame is 1 minutes and exp time 5 or 3 minutes only. You must be use martingale 3 step. So you must put lots size is 10 % at most. You should use Mt2 trading platform to connect with my indicator to get more signal without human working. This indicator wining rate is over 80% but you may get 100% of profit by using martingale 3 step. You should use MT2 Trading Platform to connect meta trader platform and binary platform . You can get mt2
Do you, like me, like to trade with the trend? Then this indicator will help you! Rainbow Trend is a trend indicator, which uses several Moving Averages on the chart.
It measures different trend strenght zones for different periods: very long term, long term, mid term, short term and very short term.
Each zone has its color, and it is possible to have sound alert when the prices leaves a zone and enters another.
Its configuration is very simple. If you find any bug or have any suggestions, co
Donchian Channel is an indicator created by Richard Donchian. It is formed by taking the highest high and the lowest low of the last specified period in candles. The area between high and low is the channel for the chosen period.
Its configuration is simple. It is possible to have the average between the upper and lower lines, plus you have alerts when price hits one side. If you have any questions or find any bugs, please contact me. Enjoy!
Hull Moving Average (HMA) is well-deservedly popular among traders because of the effective averaging of market noise and a relatively small delay. The current MetaTrader 5 version changes its color when the movement direction changes. Sound and text signals are available. It also supports sending email and push messages. It is possible to trigger a signal on the current incomplete bar, although such a signal may be canceled before completion if conditions are no longer appropriate. One of the p
Description : Rainbow MT5 is a technical indicator based on Moving Average with period 34 and very easy to use. When price crosses above MA and MA changes color to green, then this is a signal to buy. When price crosses below MA and MA changes color to red, then this is a signal to sell. The Expert advisor ( Rainbow EA MT5 ) based on Rainbow MT5 indicator is now available here .
MT4 version is available here .
The idea of a Value Chart indicator was presented in the very good book I read back in 2020 , " Dynamic Trading Indicators: Winning with Value Charts and Price Action Profile ", from the authors Mark Helweg and David Stendahl. The idea is simple and the result is pure genius: Present candlestick Price analysis in a detrended way!
HOW TO READ THIS INDICATOR
Look for Overbought and Oversold levels. Of course, you will need to test the settings a lot to find the "correct" one for your approach.
This indicator calculates the volume profile and places labels that correspond to the VAH, VAL and POC levels, for each candle individually.
Indicator operation features The indicator works on the timeframes from M3 to MN, but it uses the history data of smaller periods: M1 - for periods from M3 to H1, M5 - for periods from H2 to H12, M30 - for the D1 period, H4 - for the W1 period, D1 - for the MN period. The color and location of the VAL, VAH and POC labels on the current candle are consider
The indicator is based on Robert Miner's methodology described in his book "High probability trading strategies" and displays signals along with momentum of 2 timeframes. A Stochastic oscillator is used as a momentum indicator.
The settings speak for themselves period_1 is the current timeframe, 'current' period_2 is indicated - the senior timeframe is 4 or 5 times larger than the current one. For example, if the current one is 5 minutes, then the older one will be 20 minutes The rest of the
About the indicator: DALA Forecast is a universal tool for predicting the dynamics of time series of any nature. For prediction, modified methods of nonlinear dynamics analysis are used, on the basis of which a predictive model is built using machine learning methods. To get the trial version of the indicator, you can contact me in private messages.
How to use the indicator: Apply the indicator to your chosen financial instrument or indicator with the settings you need. The prediction will b
Indicator alerts for Dual Relative strength index rsi. Large rsi preset at 14 is below 30 small rsi preset at 4 is below 10 for buy bullish signals .
Large rsi preset are 14 is above 70 small rsi preset at 4 is above 90 for sell bearish signals . Includes mobile and terminal alerts. draws lines when alerts.
This indicator can help identify extremes and then the tops or bottoms of those extremes .
Market Profile 3 MetaTrader 5 indicator version 4.70— is a classic Market Profile implementation that can show the price density over time, outlining the most important price levels, value area, and control value of a given trading session. This indicator can be attached to timeframes between M1 and D1 and will show the Market Profile for daily, weekly, monthly, or even intraday sessions. Lower timeframes offer higher precision. Higher timeframes are recommended for better visibility. It is als
Are you tired of drawing trendlines every time you're analyzing charts? Or perhaps you would like more consistency in your technical analysis. Then this is for you. This indicator will draw trend lines automatically when dropped on a chart. How it works Works similar to standard deviation channel found on mt4 and mt5. It has 2 parameters: 1. Starting Bar 2. Number of bars for calculation The starting bar is the bar which drawing of the trend lines will begin, while the number of bars for c
The TradeQL Indicator is a customizable tool that highlights specific trading patterns on candlestick charts. Users can define patterns through TradeQL queries, which the indicator then applies to the chart, visually representing matches and captured groups. Ideal for identifying complex trade setups in real-time.
TradeQL queries are specified using the TradeQL Language. See https://github.com/abdielou/tradeql for more details. This language is expressed as a regular expression. The language a
The Half ma arrow indicator for the MetaTrader 5 trading terminal is a simple but effective tool that gives a signal about a change in the current trend. The Half ma indicator looks like a solid dynamic line that changes color at the points where the trend changes. At these points, the indicator draws arrows of the corresponding color and direction.The Half ma arrow indicator for the MT5 terminal is not an independent source of input signals. It will be most effective to use it as a trend filte
Improved version of the free HMA Trend indicator (for MetaTrader 4) with statistical analysis. HMA Trend is a trend indicator based on the Hull Moving Average (HMA) with two periods. HMA with a slow period identifies the trend, while HMA with a fast period determines the short-term movements and signals in the trend direction.
The main differences from the free version: Ability to predict the probability of a trend reversal using analysis of history data. Plotting statistical charts for analyz
The Penta-O is a 6-point retracement harmonacci pattern which usually precedes big market movements. Penta-O patterns can expand and repaint quite a bit. To make things easier this indicator implements a twist: it waits for a donchian breakout in the right direction before signaling the trade. The end result is an otherwise repainting indicator with a very reliable trading signal. The donchian breakout period is entered as an input. [ Installation Guide | Update Guide | Troubleshooting | FAQ | A
Reversal First Impulse levels (RFI) INSTRUCTIONS RUS - ENG R ecommended to use with an indicator - TREND PRO - Version MT4 A key element in trading is zones or levels from which decisions to buy or sell a trading instrument are made. Despite attempts by major players to conceal their presence in the market, they inevitably leave traces. Our task was to learn how to identify these traces and interpret them correctly.
Main functions:: Di
Bill Williams Advanced is designed for automatic chart analysis using Bill Williams' "Profitunity" system. The indicator analyzes four timeframes at once.
Manual (Be sure to read before purchasing)
Advantages
1. Automatically analyzes the chart using the "Profitunity" system of Bill Williams. The found signals are placed in a table in the corner of the screen.
2. Equipped with a trend filter based on the Alligator indicator. Most of the system signals are recommended to be used only accordi
74% discount for the next 10 buyers (original price $605): 1 left
Get a 50% bonus by buying (or even renting) any of our products. After buying (or renting), send a message for more information. 3 Indicators in 1 indicator
Strategy based on price action
Made specifically for the best forex currency pairs
Can be used in the best time frame of the market
at a very reasonable price This indicator is basically 3 different indicatos . But we have combined these 3 indicators in 1 indicator so th
通过 mql5 和 Telegram 上 的晨间简报获取每日市场更新,包括详细信息和屏幕截图 ! FX Power MT5 NG 是我们长期以来非常受欢迎的货币强度计算器 FX Power 的下一代产品。 这款下一代强度计算器能提供什么?您所喜爱的原版 FX Power 的所有功能 附加功能 黄金/XAU 强度分析 更精确的计算结果 可单独配置的分析周期 可自定义计算限制,以获得更好的性能 为希望查看更多信息的用户提供特殊的多实例设置 无尽的图形设置,可在每个图表中设置您最喜欢的颜色 无数的通知选项,让您再也不会错过任何重要信息 采用 Windows 11 和 macOS 风格的全新圆角设计 神奇的移动指标面板
FX Power 主要功能 所有主要货币的完整强势历史 所有时间框架内的货币强弱历史 所有经纪商和图表的计算结果完全相同 100% 可靠的实时计算 -> 无重绘 可通过下拉列表选择分析时段
通过自定义模式单独配置分析时段 可在一个图表中使用多个实例 可移动 FX Power 显示屏(通过拖放) 适用于高分辨率 QHD、UHD 和 4K 显示器 自动终端配置 针对平板电脑
Quantum Heiken Ashi PRO 简介 Heiken Ashi 蜡烛旨在提供对市场趋势的清晰洞察,以其过滤噪音和消除虚假信号的能力而闻名。告别令人困惑的价格波动,迎接更流畅、更可靠的图表表示。 Quantum Heiken Ashi PRO 的真正独特之处在于其创新公式,它将传统烛台数据转换为易于阅读的彩色条。红色和绿色条分别优雅地突出了看跌和看涨趋势,让您能够以非凡的精度发现潜在的进入和退出点。
量子 EA 通道: 点击这里
MT4版本: 点击这里
这一卓越的指标具有以下几个关键优势: 增强清晰度:通过平滑价格波动,Heiken Ashi 金条可以更清晰地反映市场趋势,使您更容易识别有利的交易机会。 减少噪音:告别经常导致错误信号的不稳定价格变动。 Quantum Heiken Ashi 指标可过滤噪音,使您能够做出更明智的交易决策 无缝集成:Heiken Ashi 指标专为 MetaTrader 开发,可无缝集成到您的交易平台中。它用户友好、高度可定制,并且与您的其他交易指标和过滤器兼容 无论您是寻求新优势的经验丰富的交易者,
Auto Order Block with break of structure based on ICT and Smart Money Concepts (SMC)
Futures Break of Structure ( BoS )
Order block ( OB )
Higher time frame Order block / Point of Interest ( POI ) shown on current chart
Fair value Gap ( FVG ) / Imbalance - MTF ( Multi Time Frame )
HH/LL/HL/LH - MTF ( Multi Time Frame )
Choch MTF ( Multi Time Frame )
Volume Imbalance , MTF vIMB
Gap’s Equal High / Low’s ,
Was: $249 Now: $99 Market Profile defines a number of day types that can help the trader to determine market behaviour. A key feature is the Value Area, representing the range of price action where 70% of trading took place. Understanding the Value Area can give traders valuable insight into market direction and establish the higher odds trade. It is an excellent addition to any system you may be using. Inspired by Jim Dalton’s book “Mind Over Markets”, this indicator is designed to suit the
"Piranha" - an autonomous trading system that determines overbought and oversold levels on the chart. Red and blue zones represent overbought and oversold levels respectively. Entry points are marked with arrows: a downward arrow in the red zone for "sell" and an upward arrow in the blue zone for "buy". The Take profit level is indicated by the green moving average. Key features: Adjusting the Take profit level as the green moving average changes position. Averaging ability when a new market e
IX Power 终于将 FX Power 的无与伦比的精确性带到了非外汇交易符号中。
它能准确判断您喜爱的指数、股票、商品、ETF 甚至加密货币的短期、中期和长期趋势强度。
您可以 分析 终端提供的 一切 。试试吧,体验一下您在交易时如何把握 时机 。
IX Power 主要功能
100% 精确的非重绘计算结果 - 适用于您终端中的所有交易符号 下拉式选择预配置以及可单独配置的强度分析周期 通过电子邮件、消息和手机通知的无数种通知选项
可访问的 EA 请求缓冲区 可自定义计算限制,以获得更好的性能
为希望查看更多信息的用户提供特殊的多实例设置 无尽的图形设置,让您在每个图表中都能找到最喜欢的颜色
采用 Windows 11 和 macOS 风格的圆角新面板设计
神奇的移动指标面板,可在子窗口和主图表之间无缝移动 适用于高分辨率 QHD、UHD 和 4K 显示器,并针对平板电脑和触摸屏进行了优化
IX Power 参数 最重要的参数不言自明,但我们很快会在另一篇文章中为您提供所有 IX Power 参数的完整说明。
使用别名 "参数可为技术交易符号
Step into the realm of Forex trading with confidence and precision using XQ, a cutting-edge Forex indicator designed to elevate your trading game to unprecedented heights. Whether you're a seasoned trader or just stepping into the world of currency exchange, XQ Forex Indicator empowers you with the insights and signals needed to make informed trading decisions. The signal conditions are a combination of three indicators, and XQ Forex Indicator only display medium and long-term trends . The ind
Introducing the South African Sniper indicator created by a small group of traders with a few years trading trading the financial market profitably . This is a plug and play indicator that provides you with BUY and SELL (SNIPER ENTRY) signals with TARGET and trail stops. The indicator Works with all MT5 trading instruments. The indicator uses previous chart data as receipt to speculate on future market moves.
"The South African Sniper indicator community are very happy with the indicator an
趋势线图指标是趋势筛选器指标的插件。它用作趋势筛选器(趋势线信号)生成的所有信号的扫描仪。
它是基于趋势筛选器指标的趋势线扫描仪。如果您没有 Trend Screener Pro Indicator,Trend Line Map Pro 将无法使用。 It's a Trend Line Scanner based on Trend Screener Indicator. If you don't have Trend Screener Pro Indicator, the Trend Line Map Pro will not work .
通过访问我们的 MQL5 博客,您可以下载趋势线图指标的免费版本。购买前试用,不受 Metatrader Tester 限制。 : 点击这里
1. 容易获得的优势 根据货币和时间范围显示买入和卖出信号。 评估自图表中出现箭头以来价格上涨或下跌的点数。 (趋势筛选指标箭头) 显示信号的时序。 获取多时间范围和多货币警报以购买和出售警报。
2. 如何使用趋势线图 如何显示买卖信号仪表板?
如果您有任何问题或需
Welcome to our Price Wave Pattern MT4 --(ABCD Pattern)-- The ABCD pattern is a powerful and widely used trading pattern in the world of technical analysis.
It is a harmonic price pattern that traders use to identify potential buy and sell opportunities in the market.
With the ABCD pattern, traders can anticipate potential price movements and make informed decisions on when to enter and exit trades. EA Version : Price Wave EA MT4
MT5 version : Price Wave Pattern MT5
Features :
Aut
Unlock the power of synchronized chart analysis with Chart Sync, your ultimate solution for harmonizing technical objects across multiple charts on the same trading symbol,
ChartsSync Pro MT5 is a groundbreaking MetaTrader 5 utility designed to streamline your trading workflow, enhance analysis precision, and amplify your trading decisions.
Features:
Effortless Object Synchronization.
Multi-Chart Harmony.
User-Friendly Interface.
Real-Time Updates.
Sync Objects Color,Width and Style.
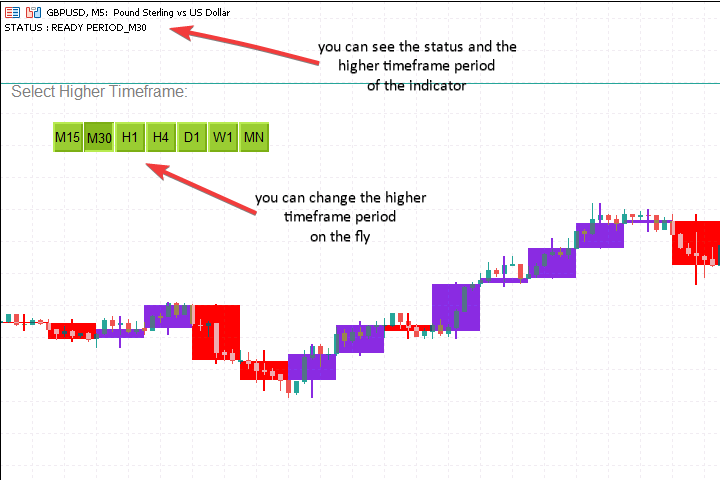
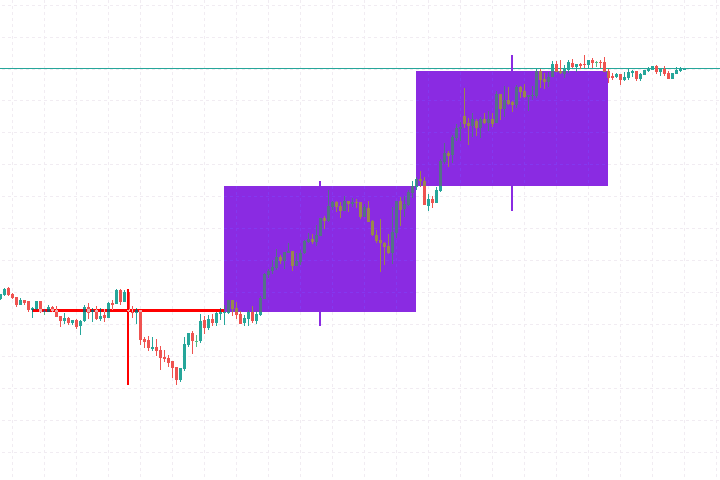
Candles Fusion is a powerful MT4 indicator that enhances your trading analysis by displaying higher timeframe candles on the current timeframe.
This unique feature provides traders with a comprehensive view of price action across different timeframes, enabling them to make more informed trading decisions.
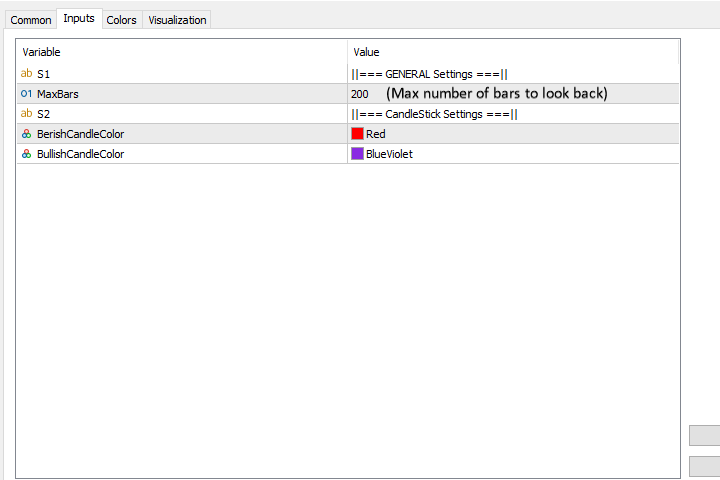
Features:
Multi-Timeframe Overlay. Customizable Timeframe Selection. Clear Visualization and color candle selection . Real-Time Updates. User-Friendly Interface.
Candles Fusion is
Unlock the power of trend continuation with TrendWizard, your ultimate companion in the world of Forex and financial trading ,
Are you tired of missing out on profitable trend continuation opportunities?
Look no further – TrendWizard is here to elevate your trading game and maximize your profits. --This EA is based on WH Trend Continuation MT4 with custom setting and other EA features-- MT5 Version : WH TrendWizard MT5 -This EA does NOT use : No Martingale - No Grid - No
Are you tired of missing crucial market movements? Do you wish for a tool that not only identifies swing points but also provides insights into price action movements?
Look no further – our Market Structure Analysis indicator is here to revolutionize the way you analyze markets on MQL5! MT5 Version : WH Market Structure Analysis MT5 Key Features:
Swing Point Detection: Our indicator excels at identifying significant swing points in the market, helping you understand key turning points with p
Welcome to the Ultimate Harmonic Patterns recognition indicator that is focused to detect advanced patterns. The Gartley pattern, Bat pattern, and Cypher pattern are popular technical analysis tools used by traders to identify potential reversal points in the market.
Our Ultimate Harmonic Patterns recognition Indicator is a powerful tool that uses advanced algorithms to scan the markets and identify these patterns in real-time.
With our Ultimate Harmonic Patterns recognition Indicator, you
Need serious improvement